
Offshore Decommissioning Services Market Size and Share
Market Overview
| Study Period | 2021 - 2031 |
|---|---|
| Market Size (2026) | USD 8.08 Billion |
| Market Size (2031) | USD 11.52 Billion |
| Growth Rate (2026 - 2031) | 7.34 % |
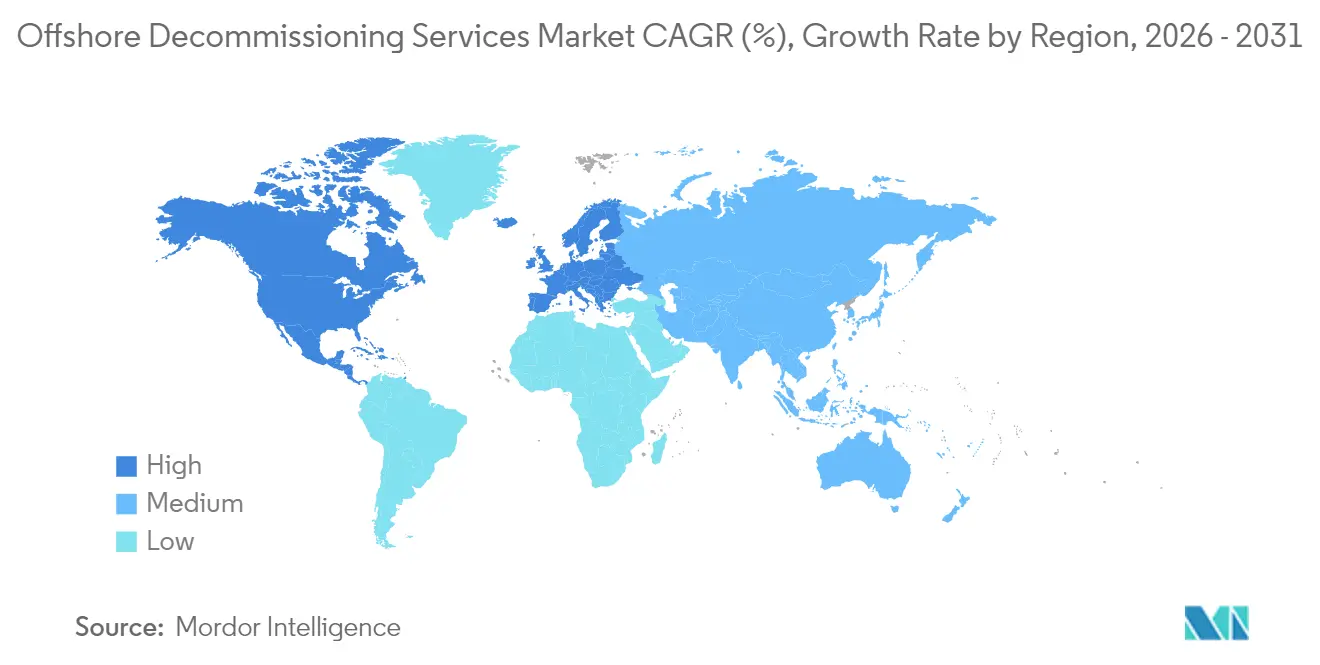
| Fastest Growing Market | Europe |
| Largest Market | North America |
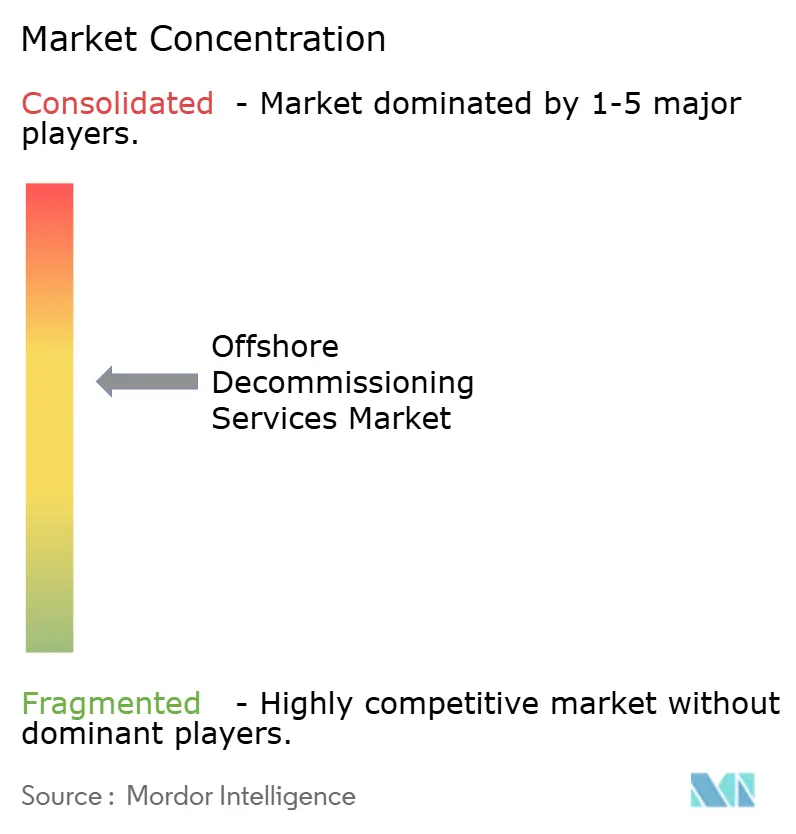
| Market Concentration | Medium |
Major Players *Disclaimer: Major Players sorted in no particular order Image © Mordor Intelligence. Reuse requires attribution under CC BY 4.0. | |
Offshore Decommissioning Services Market Analysis by Mordor Intelligence
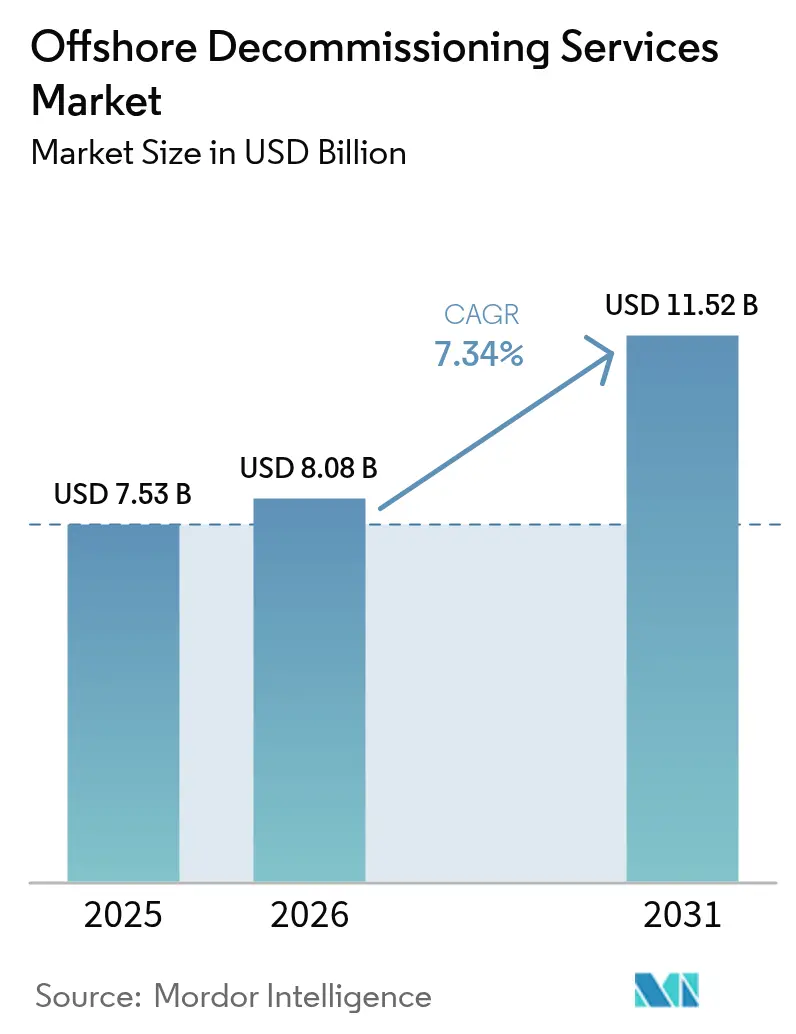
The Offshore Decommissioning Services market size is expected to grow from USD 7.53 billion in 2025 to USD 8.08 billion in 2026 and is forecast to reach USD 11.52 billion by 2031 at 7.34% CAGR over 2026-2031.
The steady retirement of aging platforms in the Gulf of Mexico (GoM) and the North Sea, along with tighter financial assurance regulations and rapid technological upgrades, collectively propel the offshore decommissioning services market. Operators are accelerating well-plugging and abandonment (P&A) programs to comply with the Bureau of Ocean Energy Management’s USD 6.9 billion bonding rule, while European producers face similar scrutiny from the North Sea Transition Authority. Cost-saving breakthroughs in robotic cutting, efficient heavy-lift vessel scheduling, and scrap steel recovery have eased historical cost barriers; yet, vessel and crew bottlenecks persist as offshore wind rebounds. Competitive dynamics are shifting toward scale: the 2025 Saipem–Subsea7 merger created a EUR 43 billion backlog champion capable of bidding for complex, multi-year campaigns.
Key Report Takeaways
- By service type, well P&A captured 31.85% of the offshore decommissioning services market share in 2025. Topsides and platform removal is projected to expand at an 8.39% CAGR through 2031.
- By water depth, shallow-water projects accounted for 72.95% of the offshore decommissioning services market size in 2025, while ultra-deepwater work is advancing at an 8.18% CAGR.
- By infrastructure type, fixed platforms and jackets commanded 41.10% of spending in 2025; subsea wells and templates represent the fastest-growing segment at an 8.78% CAGR.
- North America led with a 34.55% revenue share in 2025, whereas Europe is projected to achieve a 9.54% CAGR from 2025 to 2031.
Note: Market size and forecast figures in this report are generated using Mordor Intelligence’s proprietary estimation framework, updated with the latest available data and insights as of 2026.
Market Trends and Insights
Drivers Impact Analysis of Offshore Decommissioning Services Market*
| Driver | (~) % Impact on CAGR Forecast | Geographic Relevance | Impact Timeline |
|---|---|---|---|
| Regulatory mandates accelerating asset retirement | +2.1% | Global, primarily North America & Europe | Medium term (2-4 years) |
| Ageing North Sea & GoM infrastructure | +1.8% | North America & Europe | Long term (≥ 4 years) |
| Investor-driven P&A liability disclosures | +1.2% | Global | Short term (≤ 2 years) |
| Heavy-lift vessel over-supply after wind FID slowdown | +0.9% | Europe & Asia-Pacific | Short term (≤ 2 years) |
| Robotics and cold-cutting innovations | +0.7% | Global | Medium term (2-4 years) |
| Circular-economy revenues from scrap and reefing | +0.5% | North America & Asia-Pacific | Long term (≥ 4 years) |
| Source: Mordor Intelligence | |||
Leading Regulatory Mandates Accelerating Asset Retirement
Global regulators have tightened the rules that determine when and how operators must retire end-of-life infrastructure. In April 2024, the BOEM introduced a USD 6.9 billion financial assurance rule, compelling GoM leaseholders to post bonds or execute decommissioning programs within a three-year window. The measure addresses a backlog of more than 2,700 wells and 500 platforms identified as overdue. In Europe, the North Sea Transition Authority has issued schedules that penalize operators for slippage, signalling that deferral is no longer tolerated. Australia’s 2025 Offshore Resources Decommissioning Roadmap mirrors this stance, confirming that strengthened oversight is a worldwide phenomenon. Collectively, these actions pull forward spending, driving near-term growth in the offshore decommissioning services market. Operators now prefer early abandonment to avoid escalating bonding costs, improving backlog visibility for contractors.
Ageing North Sea & GoM Infrastructure Reaching Cessation-of-Production
Many fixed platforms installed before 1990 now operate at marginal rates of less than 10% of their original nameplate capacity. Shell’s retirement of the Brent Charlie platform, a single-lift extraction of 31,000 tonnes, underscored the technical scale awaiting contractors(1). In the GoM, more than 3,000 structures face similar economics, while 1,350 installations remain active in the North Sea. Depletion alongside low commodity price scenarios undermines the case for enhanced recovery, firmly tilting decisions toward abandonment. Concentration of assets in water depths below 125 m allows fleet and crew standardization, shaving mobilization costs, and accelerating project pipelines. This structural ageing profile sustains a long-duration demand stream that anchors the offshore decommissioning services market.
Increasing P&A Liability Disclosures Demanded by Investors
Institutional investors now evaluate upstream portfolios through the lens of undiscounted decommissioning liabilities. NEO Energy built its 2025 merger with Repsol’s UK assets around a dedicated USD 1.8 billion liability funding structure. Credit-rating agencies incorporate coverage ratios into scoring models, prompting operators to restate provisions upwards by up to 50%. ESG mandates require clear road maps to liability reduction; activist shareholders press companies to convert provisions into executed work scopes rather than rolling extensions. This transparency imperative aligns corporate finance with decommissioning schedules, stimulating predictable contracting opportunities and reinforcing growth prospects for the offshore decommissioning services market.
Robotics & Cold-Cutting Tech Slashing Topside Removal Time
Automation has transformed cutting and inspection workflows. Baker Hughes’ Terminator system removes wellheads in 35 minutes, compared to several hours via legacy mechanical methods, delivering 300% productivity gains(2). DeepOcean’s autonomous drone verified subsea cuts at 3,000 m, halving inspection cycles. Cold cutting eliminates the need for explosives, improves worker safety, and yields cleaner steel for recycling. AI-enabled path planning optimizes blade contact angles, reducing tool wear and vessel spread downtime. The rapid adoption of these systems enhances competitiveness and further expands the addressable offshore decommissioning services market.
Restraints Impact Analysis of Offshore Decommissioning Services Market*
| Restraint | (~) % Impact on CAGR Forecast | Geographic Relevance | Impact Timeline |
|---|---|---|---|
| High cost uncertainty & funding shortfalls | −1.4% | Global | Medium term (2-4 years) |
| Frequent schedule slippage due to weather windows | −0.8% | North Sea & North America | Short term (≤ 2 years) |
| OSV & crew bottlenecks as offshore wind surges | −1.1% | Europe & Asia-Pacific | Medium term (2-4 years) |
| Asset repurposing for CCS delaying full removals | −0.6% | North Sea & GoM | Long term (≥ 4 years) |
| Source: Mordor Intelligence | |||
High Cost Uncertainty & Funding Shortfalls
Deepwater well abandonment costs have risen to USD 24 million per well in parts of the GoM, a five-fold premium over shallow-water analogues. Inflation in steel-cutting consumables, mobilization fuel, and specialized crew wages pushed some projects 30–40% above early engineering estimates. Smaller independent companies lack access to project finance, forcing deferrals that swell their backlog. Bonding requirements have tightened just as credit conditions harden, intensifying pressure. These factors reduce near-term execution velocity and temper upside for the offshore decommissioning services market.
OSV & Crew Bottlenecks as Offshore Wind Surges
Norway estimates that 3,000 offshore personnel will retire by 2028, while the average workforce age is already 44.4 years. Crews migrate toward wind projects offering multi-year tenure and higher wages. Helix Energy’s 300-day Hornsea 3 trenching award demonstrates how single renewables contracts can block significant vessel capacity(3). As wind FIDs resume after 2026, capacity strain is likely to return, restraining the growth momentum for the offshore decommissioning services market.
*Our forecasts treat driver/restraint impacts as directional, not additive. The impact forecasts reflect baseline growth, mix effects, and variable interactions.
Offshore Decommissioning Services Market Segment Analysis
By Service Type:
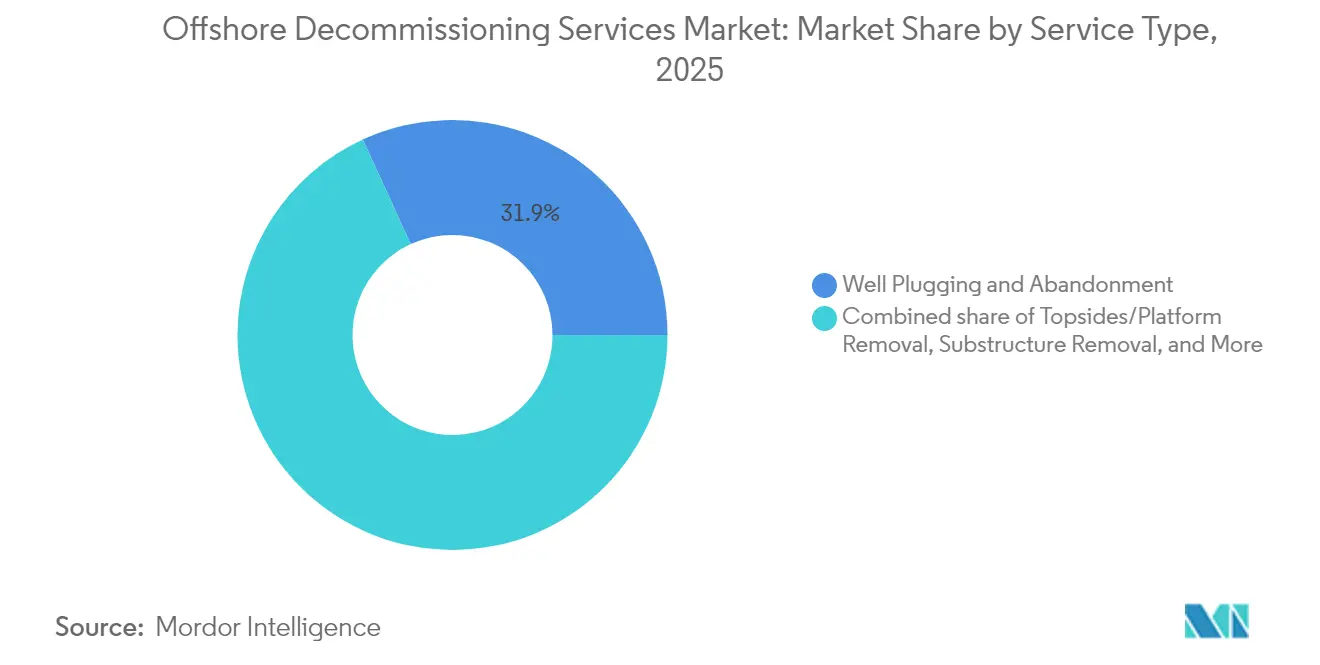
Well P&A’s Fundamental Scale Supports GrowthWell plugging and abandonment represented 31.85% of 2025 spend, anchoring the offshore decommissioning services market size, owing to the 27,000-plus wells awaiting permanent isolation in the GoM alone. The cost per shallow-water well ranges from USD 2 to USD 5 million, but deepwater P&A regularly exceeds USD 24 million, explaining the significant dollar allocation to this segment. Petrobras’ USD 170 million P&A framework with Constellation, covering 1,143 days of rig time, illustrates contractual scale. Topsides and platform removal is forecast as the fastest-expanding sub-sector at 8.39% CAGR. Single-lift campaigns, utilizing vessels such as Allseas’ Pioneering Spirit, reduce offshore exposure hours and lower project risk, thereby supporting uptake.
Pipeline and subsea-system decommissioning is gaining share as mature deepwater fields retire. The offshore decommissioning services market benefits from AI-driven toolpath optimization, which reduces cut cycles and supports safer multi-string pipeline severance. Site clearance and monitoring, though smaller, show rising growth because regulators mandate multi-year post-removal seabed surveys. Substructure removal, particularly jackets in water depths of 60-150 m, remains cost-intensive; however, it is increasingly executed through reverse-installation methods that shorten lift durations.

By Water Depth:
Shallow-Water Dominance Meets Ultra-Deepwater UpsideIn 2025, shallow-water projects below 125 m captured 72.95% of spending, bolstered by decades-old North Sea and GoM infrastructure and the availability of lower-cost lift spreads. Shallow work scopes enable campaign-style scheduling, maximizing vessel utilization and allowing for economies of scale across neighboring leases. Ultra-deepwater projects above 1,500 m record the strongest 8.18% CAGR. Wild Well’s DeepRange 10,000 ft-rated intervention system confirms the technology readiness for such depths. Operator budgets factor high-spec rig day rates of up to USD 500,000, translating into large contract values that expand the offshore decommissioning services market size.
Deepwater assets (125–1,500 m) occupy a middle ground; they require enhanced equipment but avoid the extreme pressures of ultra-deepwater. Weather exposure intensifies with depth as operations extend longer per well, and spread costs outperform shallow baselines by three to five times. Contractors with deepwater ROV fleets and DP3 vessels, such as TechnipFMC and Saipem, enjoy a clear advantage in this growth pocket of the offshore decommissioning services market.
By Infrastructure Type:
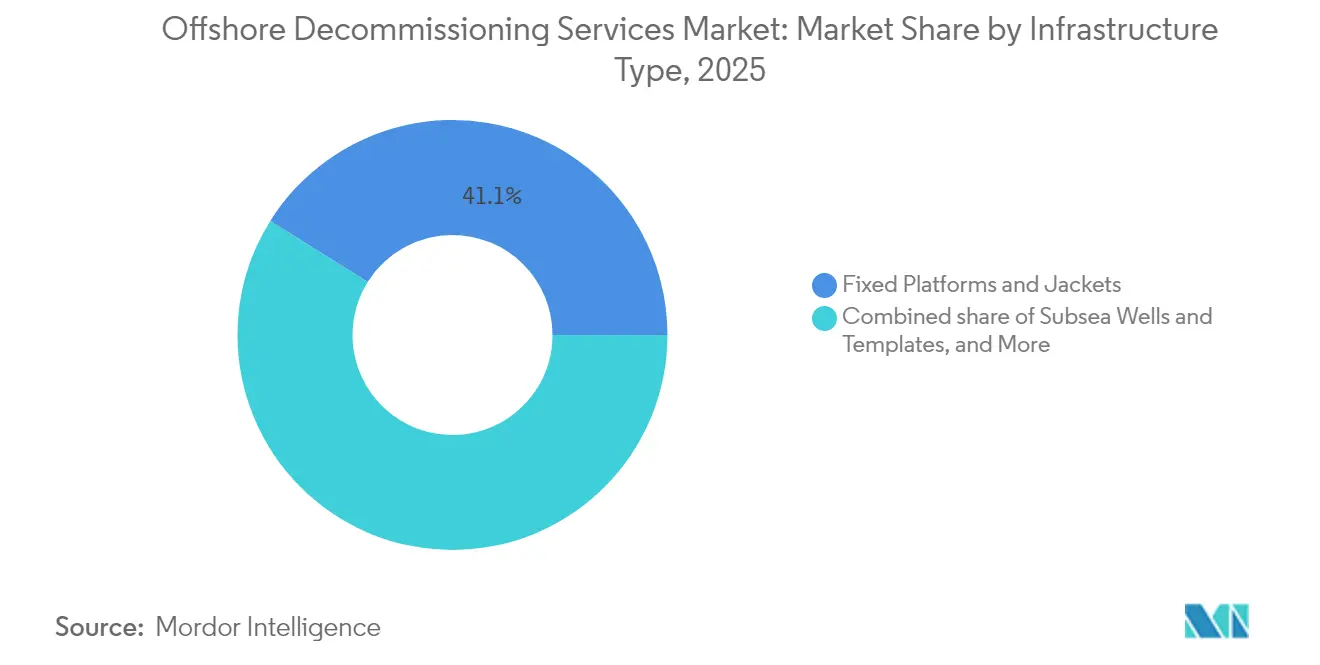
Fixed Platforms Remain High-Value Work ScopesFixed platforms and jackets accounted for 41.10% of the 2025 decommissioning value, reflecting heavy steel tonnage and robust lift requirements. Single-lift removals, such as Brent Charlie, have proven viable, but multi-lift segmenting remains prevalent for smaller barges. Subsea wells and templates deliver the fastest 8.78% CAGR, supported by a wave of pre-2008 deepwater tiebacks now at the end of their life. These jobs rely on advanced ROV tooling that can detach connector frames in low-visibility, high-pressure environments, further professionalizing the offshore decommissioning services market.
Floating production systems, including FPSOs and spars, represent both removal opportunities and refurbishment prospects. Some owners evaluate redeployment to marginal fields. Pipeline and flowline scopes require fit-for-purpose trencher spreads; decisions on removal versus in-situ abandonment hinge on risk assessments and host-nation rules. The offshore decommissioning services market adapts by offering integrated engineering that compares environmental, safety, and cost outcomes before final work-scope definition.
Geography Analysis
North America Offshore Decommissioning Services Market
North America retained 34.55% of 2025 revenue. The BOEM bonding rule accelerated GoM contract awards and established logistics hubs in Port Fourchon and Ingleside, enabling rapid mobilization. Mexico’s legacy Cantarell infrastructure adds incremental demand as Pemex programs early P&A on non-commercial wells. Canada’s Atlantic offshore assets are fewer, but they draw attention for the risk of iceberg mitigation during decommissioning. Together, these dynamics maintain regional primacy for the offshore decommissioning services market.
Europe Offshore Decommissioning Services Market
Europe is the fastest-growing region at a 9.54% CAGR. The UK’s projected GBP 59.7 billion spend through 2050 anchors activity, while Norway’s mature Ekofisk and Frigg fields continue to retire assets. Continental Europe contributes to pipeline removals in the Dutch and Danish sectors. The North Sea’s clustered asset layout favors multi-field campaign approaches, unlocking cost savings and elevating the offshore decommissioning services market share captured by integrated contractors.
APAC Offshore Decommissioning Services Market
Asia-Pacific offers mixed opportunities. Malaysia’s 200-plus idle wells, Australia’s Bass Strait platform retirements, and Thailand’s rapid multi-platform program executed by James Fisher exhibit early momentum. Regulatory heterogeneity complicates scheduling, yet government grants for local content spur joint-venture models. Ultra-deepwater abandonment off Western Australia’s Carnarvon Basin is pushing drilling-rig demand and raising technical benchmarks inside the offshore decommissioning services market.
South America and MEA Offshore Decommissioning Services Market
Brazil leads South America. Petrobras alone intends to decommission 26 platforms and 18 gas lift manifolds by 2030, highlighted by the USD 170 million P&A contract awarded in 2025. Colombia and Trinidad plan smaller campaigns that favor regional contractors. The Middle East and Africa present nascent potential: mature Egyptian platforms in the Gulf of Suez and shallow-water Nigerian infrastructure are nearing the end of their lifespan, but many host governments are still refining their guidelines. As clarity improves, these theatres will enlarge the global offshore decommissioning services market footprint.
Regulatory Landscape
Regulation continues to pull forward offshore retirement work in the most mature basins. In the United States, offshore decommissioning is administered under BSEE requirements (30 CFR 250 Subpart Q), while BOEM has tightened financial assurance expectations, including the April 2024 USD 6.9 billion bonding rule highlighted in the report context. In the UK and wider North Sea, the North Sea Transition Authority (NSTA) is strengthening execution discipline through decommissioning stewardship expectations and oversight under the Petroleum Act 1998, with added visibility from its February 2026 publication on the remaining Exchequer cost of decommissioning UK upstream infrastructure.
In Europe, OSPAR continues to anchor the policy presumption of full removal. OSPAR Agreement 2024-04 (adopted June 2024) provides harmonized guidance for assessing derogation applications under Decision 98/3, keeping exemptions limited to case-by-case approvals. The result is higher documentation and compliance burden across well decommissioning, structure removal, and post-removal monitoring, alongside a stronger emphasis on campaign-based delivery models to reduce slippage against regulator schedules.
Competitive Landscape
The offshore decommissioning services market displays moderate fragmentation. Tier-one EPC and marine heavy-lift specialists—including Allseas, Heerema, TechnipFMC, and the merged Saipem-Subsea7 entity—dominate turnkey campaigns that require integrated lift, subsea, and P&A competency. Mid-cap specialists, such as Acteon and DeepOcean, compete through differentiated tooling or regional expertise.
Consolidation escalated in 2025 when Saipem and Subsea7 combined to form a EUR 20 billion revenue leader with a EUR 43 billion backlog, enhancing scale synergy for multi-basin programs. SLB’s acquisition of ChampionX augments production-chemistry and intervention know-how, enabling bundled P&A and late-life production optimization services(5). TechnipFMC secured a large iEPCI award for Johan Sverdrup Phase 3, reinforcing its ability to cross-sell decommissioning solutions alongside greenfield developments.
Technology is a key differentiator. Baker Hughes’ Terminator system accelerates wellhead removal, while Helix Robotics deploys trenchers and ROVs that shorten pipeline burial timelines. Autonomous drones for subsea metrology reduce human exposure and widen operational windows. Carbon-capture repurposing opens new revenue avenues that may offset the costs of removals; Aker Solutions has positioned itself for this pivot through CCS project awards.
Pricing power rests with owners of ultra-heavy-lift assets capable of lifting 20,000 tonnes in a single lift. Competition in shallow-water scopes remains intense, pressuring margins; however, contractors offering bundled engineering, regulatory interface, and cost-certainty continue to secure repeat business. Overall, legacy fleet ownership, digital toolset, and balance-sheet strength determine success in the offshore decommissioning services market.
Offshore Decommissioning Services Industry Leaders
-
Aker Solutions ASA
-
Petrofac Ltd
-
TechnipFMC PLC
-
Heerema Marine Contractors
-
Allseas Group SA
- *Disclaimer: Major Players sorted in no particular order
Offshore Decommissioning Services Market Companies Covered in this Report
- Able UK
- Aker Solutions ASA
- AF Gruppen ASA
- John Wood Group PLC
- DNV AS
- Heerema Marine Contractors
- Allseas Group SA
- TechnipFMC PLC
- DeepOcean Group Holding BV
- Equinor ASA
- Petrofac Ltd
- Saipem SpA
- Subsea 7 SA
- Oceaneering International Inc
- Fugro NV
- Kiewit Offshore Services
- Boskalis Westminster NV
- PGS ASA
- DEME Offshore
- Acteon Group Ltd
- Maersk Supply Service
- Shelf Subsea
- Bourbon Subsea Services
- Swiber Holdings Ltd
- VAALCO Energy Inc
Read Analysis of Offshore Decommissioning Services Companies
Market Opportunities and Future Outlook
The clearest whitespace is emerging where regulators and operators are converting long-dated liabilities into structured, multi-asset programs. These tend to favor contractors that can bundle engineering, marine operations, and verification under one delivery approach. In the UK, policy and cost-transparency initiatives are moving into more operational detail, including DESNZ consulting (February 2026) on proposed 2026/27 hourly rates for OPRED environmental and decommissioning functions and a draft shift toward a quarterly charging approach under the proposed 2026 abandonment charges regulations. That direction pushes operators toward better-defined scopes and documentation, supporting service providers that can industrialize permitting, environmental submissions, and evidence packs alongside execution.
Geographic expansion beyond the North Sea and GoM is also becoming more tangible through named, multi-platform programs. QatarEnergy commissioned McDermott (February 2026) to develop a technical and commercial strategy for decommissioning and removing 27 offshore platforms across the Al-Karkara, Idd El-Shargi, and Maydan Mahzam fields, creating downstream pull for integrated EPRD planning, lift solutions, and disposal routing. In Australia, Esso Australia Resources (ExxonMobil) appointed ABL (May 2026) for marine warranty survey services for the first phase of the Bass Strait campaign involving removal of up to 12 platforms, signaling demand for assurance, risk management, and marine-specification work packages that can be reused across structures. Execution-side opportunity is visible in specialized lift methods as well, including Petrodec completing removals in the UK Southern North Sea using the OBANA heavy-lift jackup vessel (March 2026), which supports sustained demand for contractors and yards capable of reverse-installation style dismantling, heavy-lift scheduling, and recycling logistics at scale.
Recent Industry Developments in Offshore Decommissioning Services Market
- July 2026: Aker Solutions completed the departure of the Hugin B topside from its Verdal facility, closing out a notable decommissioning-related project portfolio with Aker BP. The milestone highlights ongoing demand for heavy topside handling, dismantling preparation, and yard-based logistics that help enable safer and more repeatable removal campaigns in the North Sea.
- October 2025: Petrofac marked the final voyage of the Northern Endeavour FPSO to Singapore, concluding a multi-year decommissioning effort. The tow-out and export phase highlights the role of late-life specialists in integrating offshore shutdown, marine logistics, and downstream dismantling pathways for large floating assets.
- July 2024: BOEM introduced a USD 6.9 billion financial assurance rule for US offshore assets, tightening bonding and related compliance for leaseholders. The change accelerates the commercial conversion of end-of-life liabilities into executed well P&A and removal scopes, improving near-term bid visibility for contractors active in the Gulf of Mexico.
Offshore Decommissioning Services Market Report Scope and Research Methodology
Market Definition and Coverage
This market covers revenue generated from offshore decommissioning services used to retire end-of-life offshore oil and gas assets, starting from planning and regulatory work through removal, disposal, and post-activity monitoring. We treat it as a global services market measured in value terms.
Scope exclusions: Onshore decommissioning work, routine offshore maintenance, and new-build installation or commissioning services are excluded.
Segments Covered in This Report
- By Service Type
- Well Plugging and Abandonment
- Topsides/Platform Removal
- Substructure (Jacket) Removal
- Pipeline and Subsea Infrastructure Decommissioning
- Site Clearance and Monitoring
- By Water Depth
- Shallow Water (Below 125 m)
- Deepwater (125 to 1,500 m)
- Ultra-Deepwater (Above 1,500 m)
- By Infrastructure Type
- Fixed Platforms and Jackets
- Floating Production Systems (FPSO, TLP, Spar)
- Subsea Wells and Templates
- Pipelines and Flowlines
- By Geography
- North America
- United States
- Canada
- Mexico
- Europe
- Germany
- United Kingdom
- France
- Italy
- Spain
- NORDIC Countries
- Russia
- Rest of Europe
- Asia-Pacific
- China
- India
- Japan
- South Korea
- Australia
- ASEAN Countries
- Rest of Asia-Pacific
- South America
- Argentina
- Brazil
- Rest of South America
- Middle East and Africa
- Saudi Arabia
- United Arab Emirates
- Qatar
- South Africa
- Rest of Middle East and Africa
- North America
Data Sources, Market Sizing, and Validation
Desk Research
Desk research starts with building a fact base around offshore oil and gas asset aging, project pipelines, and the regulatory requirements that trigger retirement work. For this, we lean on public and official sources such as Bureau of Safety and Environmental Enforcement releases, UK offshore regulator publications, International Energy Agency statistics, European Commission environment directives, and customs and trade statistics when relevant to heavy-lift and subsea activity trends.
In parallel, we review company annual reports, investor presentations, tender portals, and credible press coverage to map project awards, timing shifts, and cost drivers, including vessel day rates and waste handling requirements. Patent databases also provide a directional check on technology adoption in cutting, lifting, and subsea intervention. Where needed, paid subscriptions for company financials and news intelligence are used to confirm exposure to decommissioning revenue and to cross-check contract announcements. The desk sources listed here are illustrative only, and many additional public references were reviewed to fill gaps and validate assumptions.
Primary Interviews and Surveys
Primary work is used to pressure-test the desk assumptions and make sure the cost and schedule logic matches what is happening offshore. We spoke with a mix of service providers, project managers, engineering and compliance specialists, and asset operators across the main basins so regional rules and practical project constraints are reflected in the final model.
Distribution of primary research fieldwork respondents
| Company type | Respondent position | Region |
|---|---|---|
| Top tier: 31% | CXOs: 15% | APAC: 44% |
| Mid tier: 47% | Functional/Unit leaders: 36% | EMEA: 31% |
| Smaller Players: 22% | Managers: 49% | Americas: 25% |
Market-Sizing & Forecasting
Sizing starts with a top-down build where announced and expected offshore retirement activity is reconstructed using asset counts, typical decommissioning sequences, and region-specific execution constraints. That demand pool is then translated into value using service mix splits and cost drivers that change by basin, for example well plugging and abandonment intensity, removals of topsides and jackets, and pipeline or subsea infrastructure scope.
To keep totals realistic, we run selective bottom-up checks such as sampled project cost ranges, supplier capacity signals, and volume by activity multiplied by practical average pricing for key work packages. Where direct data is thin, gaps are handled with proxy indicators like project award cadence, vessel availability, and disposal or recycling capacity, and then adjusted only after it is supported by interview feedback.
For forecasting, scenario analysis is used because decommissioning spend can shift quickly based on oil price expectations, operator budget cycles, and permitting timing. Inputs we track include the inventory of late-life platforms and subsea wells, water depth distribution, regional regulatory milestones, heavy-lift and subsea vessel day rates, and the expected pace of final investment decisions for retirement campaigns, with assumptions tuned to expert consensus from primary discussions.
Data Validation & Update Cycle
Validation is done through repeated cross-checks between the model and independent signals such as published decommissioning schedules, known project awards, and visible capacity constraints in vessels and yards. Large variances are flagged, reviewed, and then traced back to the assumption that caused them, after which the relevant input is corrected or narrowed.
Before sign-off, the market model is reviewed in multiple steps so math errors, scope overlaps, and timing mismatches are removed. Reports are refreshed annually, and interim updates are made when material events occur, such as major regulatory changes, large project awards, or sudden shifts in offshore activity levels. Right before delivery, a final review pass is completed so the numbers reflect the latest available signals.
Mordor Intelligence's Offshore Decommissioning Market Size Compared With Other Published Estimates
Published market values for offshore decommissioning can look far apart because the boundary is not always set the same way, and because timing assumptions can move spend between years. Differences also come from what gets counted as decommissioning services versus adjacent work, and from how regional project pipelines are treated when dates are uncertain.
By tracking project-level retirement schedules, pricing drivers like vessel day rates, and scope lines for subsea infrastructure, and then refreshing those assumptions through re-contacts, Mordor Intelligence keeps the estimate aligned to services that are executed offshore rather than broader asset retirement spending.
Benchmark comparison
| Source | Market Size | Gaps in Research Methodology |
|---|---|---|
| Mordor Intelligence | USD 8.08 B (2026) | |
| Global Consultancy A | USD 8.52 B (2025) | Uses a different base year and appears to roll up a broader set of cost items across regions, which can pull spend forward into the stated year when project timing is uncertain. |
| Industry Publisher B | USD 8.38 B (2025) | Defines scope as oil and gas offshore decommissioning and may apply a simplified split by water depth and structure, which can change the service mix weighting versus a detailed activity-based build. |
The spread in values mainly reflects year selection and how tightly the service boundary is drawn around offshore execution work. When project timing, service mix, and regional constraints are treated explicitly, the final number stays easier to reconcile with visible demand signals and can be repeated with clear inputs.
Key Questions Answered in the Report
What is the current value of the offshore decommissioning services market?
The offshore decommissioning services market size was USD 8.08 billion in 2026 and is projected to grow to USD 11.52 billion by 2031.
Which service segment dominates spending?
Well plugging and abandonment dominates with 31.85% share in 2025 because every asset retirement requires permanent well isolation before other activities can start.
Why is Europe the fastest-growing regional market?
Europe’s 9.54% CAGR reflects North Sea regulators tightening enforcement, pushing operators to accelerate retirements and generating a sizeable pipeline of platform and subsea removals.
How do new technologies lower decommissioning costs?
Robotic cold-cutting, autonomous inspection drones and single-lift vessels cut operational hours, reduce safety risks and unlock 15–30% cost savings compared with conventional methods.
What is the biggest restraint on market growth?
High cost uncertainty—especially in deepwater projects where well abandonment can exceed USD 24 million per well—creates funding gaps and delays execution schedules.
Will CCS repurposing reduce decommissioning activity?
In the near term, pipeline and platform conversion for carbon storage can defer certain removals, but overall industry forecasts still anticipate rising decommissioning demand as assets age.