
Office Furniture Rental Market Size and Share
Market Overview
| Study Period | 2020 - 2031 |
|---|---|
| Market Size (2026) | USD 9 Billion |
| Market Size (2031) | USD 12.86 Billion |
| Growth Rate (2026 - 2031) | 7.45 % |
| Fastest Growing Market | Asia-Pacific |
| Largest Market | North America |
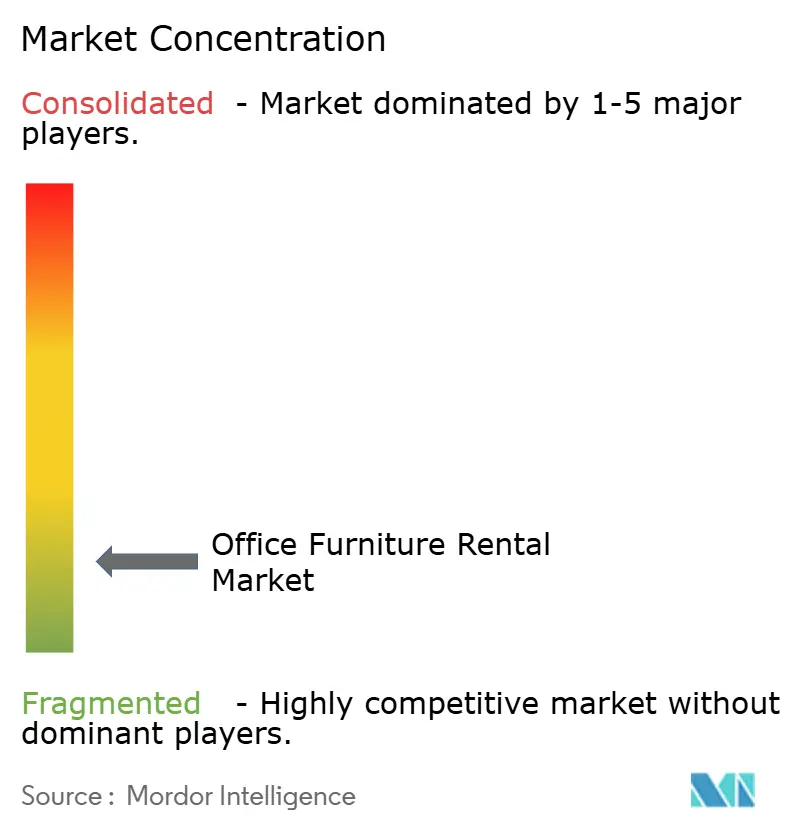
| Market Concentration | Low |
Major Players *Disclaimer: Major Players sorted in no particular order Image © Mordor Intelligence. Reuse requires attribution under CC BY 4.0. | |
Office Furniture Rental Market Analysis by Mordor Intelligence
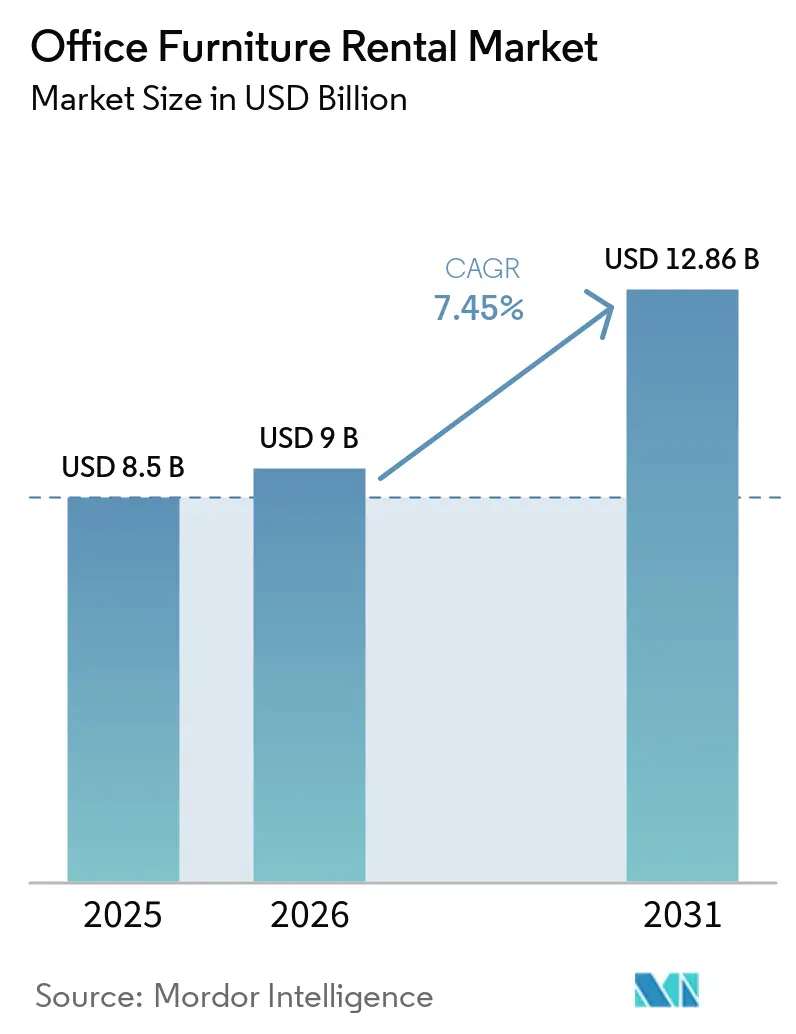
The office furniture rental market size was valued at USD 8.50 billion in 2025 and is estimated to grow from USD 9.0 billion in 2026 to reach USD 12.86 billion by 2031, at a CAGR of 7.45% during the forecast period (2026-2031). The office furniture rental market is benefiting from companies replacing fixed furniture purchases with arrangements that can be adjusted as staffing and workplace use change. Hybrid work has made fixed desk allocations less useful, which has increased interest in furniture fleets that can be expanded, reduced, or refreshed without leaving unused assets. Flexible workspace operators are reinforcing this demand because they need furnished sites that can open quickly and adapt as members change. Suppliers that combine delivery coverage, digital asset records, and refurbishment capacity are better placed to serve larger accounts. High retrieval and repair costs remain a constraint, particularly for short-term arrangements, while some mid-sized companies still treat furniture as a purchase rather than a service. The outlook, therefore, depends on providers showing that flexible contracts and reliable service can outweigh the perceived simplicity of ownership.
Key Report Takeaways
- By product type, desks and workstations held 45.5% of the office furniture rental market share in 2025, while chairs and seating are forecast to register an 8.3% CAGR through 2031.
- By rental model, long-term rental accounted for 42.4% of global revenue in 2025, while subscription-based furniture-as-a-service is projected to register a 7.9% CAGR through 2031.
- By consumer type, SMEs and startups held 55.4% of global revenue in 2025, while coworking and flexible-workspace operators are forecast to register an 8.1% CAGR through 2031.
- By distribution channel, offline showrooms and rental specialists held 64.2% of global revenue in 2025, while online platforms and digital marketplaces are projected to register an 8.3% CAGR through 2031.
- By geography, North America held 37.1% of the global office furniture rental market in 2025, while Asia-Pacific is forecast to register an 8.5% CAGR through 2031.
Note: Market size and forecast figures in this report are generated using Mordor Intelligence’s proprietary estimation framework, updated with the latest available data and insights as of January 2026.
Global Office Furniture Rental Market Trends and Insights
Drivers Impact Analysis*
| Driver | (~) % Impact on CAGR Forecast | Geographic Relevance | Impact Timeline |
|---|---|---|---|
| Hybrid Work And Workforce Reconfiguration | +1.2% | Global | Short term (≤ 2 years) |
| CapEx-To-OpEx Conversion And Liquidity Preservation | +1.4% | North America and Europe | Medium term (2-4 years) |
| Coworking, Flexible Offices And Temporary Workspace Expansion | +1.3% | Asia-Pacific and the Middle East | Medium term (2-4 years) |
| Circular Procurement And Furniture-As-A-Service Adoption | +0.9% | Northern Europe and Asia-Pacific | Long term (≥ 4 years) |
| Faster Deployment For Relocations, Projects And Business Expansion | +0.8% | Global | Short term (≤ 2 years) |
| Digital Procurement, Space Planning And Asset-Tracking Platforms | +0.7% | North America and Europe | Medium term (2-4 years) |
| Source: Mordor Intelligence | |||
Hybrid Work And Workforce Reconfiguration
Hybrid work is now an established part of workplace planning and continues to change how companies organize furniture. Office attendance patterns vary by day, which makes a fully owned and fixed furniture fleet harder to use efficiently. Corporate workplace platforms recorded an 8% increase in desk bookings and a 20% increase in meeting room bookings in 2025, showing that attendance was becoming more structured rather than returning to a traditional daily pattern [1]OfficeSpace Software, “Built World Market Report,” OfficeSpace Software, officespacesoftware.com. Employers that reduce permanent desk counts can redirect part of the released budget toward collaboration areas and more ergonomic furniture. Rental also enables facilities teams to test the balance between shared areas, meeting spaces, and individual workstations before making a lasting layout decision. The office furniture rental market can serve this need because rental terms allow furniture mixes to change with the way people use an office.
CapEx-To-OpEx Conversion And Liquidity Preservation
Financial planning is a central reason that companies choose rental arrangements rather than buying furniture outright. CORT reported that a 20,000 sq ft office over 3 years cost under USD 135,000 under a furniture-as-a-service model, compared with USD 188,000 under purchase when depreciation, maintenance, and disposal were included [2]CORT Business Services, “Beyond the Price Tag The Real Cost of Office Furniture,” CORT Business Services, cort.com. In a project-based example cited by CORT, rental spending was USD 112,000 in year 1 and USD 96,000 in year 2, compared with USD 585,000 for an outright purchase. Returning furniture at project completion also avoids disposal work and the risk of holding assets that no longer fit operational needs. A recurring payment structure can also make facilities spending easier to align with occupancy and project budgets. This cost structure supports the office furniture rental market, where companies want to conserve capital while keeping workplace standards consistent.
Coworking, Flexible Offices And Temporary Workspace Expansion
Coworking operators need furnished spaces that can be deployed quickly, which gives rental providers a recurring source of demand. IWG opened 782 centers in 2025, and 99% were opened through capital-light managed partnerships [3]International Workplace Group, “Preliminary Results Announcement 2025,” IWG plc, iwgplc.com. The company signed 728 additional locations in the first half of 2026, a 47% increase from the prior-year period. Operators that outsource furniture management can direct more resources to technology, member experience, and site growth. They can also maintain a more consistent workplace offer as sites open in new cities and tenant needs shift. This pattern supports the office furniture rental market in regions where managed offices and temporary workspaces are expanding.
Circular Procurement And Furniture-As-A-Service Adoption
Circular procurement is becoming more relevant as companies look for documented reuse and lower waste in workplace fit-outs. CORT states that assets in its system are redeployed 3 to 6 times after refurbishment, keeping more than 95% of product out of landfill and reducing lifecycle greenhouse gas emissions by 66% compared with conventional purchase. NORNORM states that its circular subscription approach can reduce carbon dioxide emissions by up to 70% compared with traditional ownership [4]NORNORM, “Circular Economy Leader NORNORM Secures EUR 50 Million to Further Scale Its Furniture Subscription Model,” NORNORM, nornorm.com. These offerings make it easier for customers to reuse records in internal sustainability reporting. Refurbishment also gives providers a reason to retain product responsibility beyond the first delivery. They also give providers in the office furniture rental market a practical way to differentiate their service beyond monthly pricing.
Restraints Impact Analysis*
| Restraint | (~) % Impact on CAGR Forecast | Geographic Relevance | Impact Timeline |
|---|---|---|---|
| Reverse-Logistics And Refurbishment Cost Intensity | -0.9% | Global | Short term (≤ 2 years) |
| Delivery, Installation And Cross-Border Coordination Complexity | -0.7% | Asia-Pacific, the Middle East, and South America | Medium term (2-4 years) |
| Quality, Hygiene, Ergonomics And Product-Availability Concerns | -0.5% | Global | Short term (≤ 2 years) |
| Limited Customization And Residual-Value Risk For Nonstandard Assets | -0.4% | North America and Europe | Long term (≥ 4 years) |
| Source: Mordor Intelligence | |||
Reverse-Logistics And Refurbishment Cost Intensity
Retrieval, inspection, cleaning, repair, and storage make furniture rental more operationally demanding than a conventional sale. Each returned item must be assessed and restored before it can generate rental income again. Freight and last-mile coordination can make these steps more expensive in dense urban areas. Idle inventory creates an added burden because it occupies warehouse capacity without producing revenue. The office furniture rental market providers with their own refurbishment capacity can reduce delays and have greater control over quality. Smaller providers that depend on external repair and storage partners can face lower margins, which may limit their ability to compete in the office furniture rental market.
Delivery, Installation And Cross-Border Coordination Complexity
Office furniture is large, varied in size, and prone to handling damage, which raises shipping and installation requirements. Urban delivery restrictions can reduce the available time for installation crews to complete site work. Cross-border contracts also require coordination of product classifications, local ergonomic requirements, and installation teams. Large customers often want one supplier to furnish several offices across countries at the same time. A service failure at one location can affect the confidence of an enterprise buyer in the wider contract. These requirements can limit the ability of smaller office furniture rental market companies to compete for multi-country contracts, especially in regions with logistics gaps.
*Our forecasts treat driver/restraint impacts as directional, not additive. The impact forecasts reflect baseline growth, mix effects, and variable interactions.
Segment Analysis
By Product Type: Desks And Workstations Retain The Largest Position
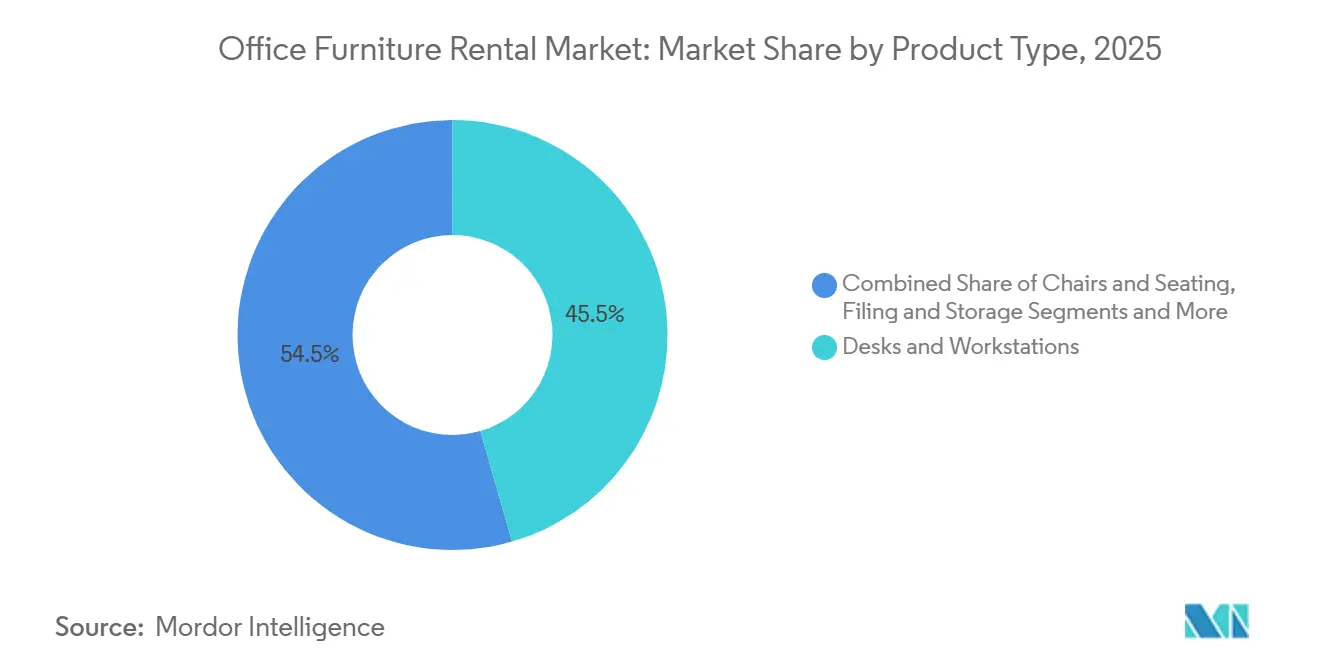
Desks and workstations held 45.5% of the office furniture rental market share in 2025 because they remain necessary in most workplace configurations. Their position reflects the continuing need for standard work surfaces across offices, managed workspaces, and temporary project sites. Chairs and seating are forecast to grow at an 8.3% CAGR through 2031 as employers place greater emphasis on ergonomics and employee comfort. This growth is supported by demand for seating packages that can be upgraded when office layouts or employee needs change.
Height-adjustable desks and ergonomic chairs are increasingly provided together in managed packages. These assets commonly need review or recertification after 5 to 7 years, which creates a renewal opportunity for office furniture rental market suppliers with maintenance services. Filing and storage furniture, meeting tables, and reception or break-room products address different stages of a workplace fit-out. Shared meeting and social spaces are receiving more attention as offices become places for collaboration rather than only individual desk work. Customers can use rental to vary these shared settings as attendance patterns and team needs change—the office furniture rental industry, therefore, benefits from customers testing layouts before choosing a long-term configuration.



By Rental Model: Subscription Services Gain Ground Alongside Long-Term Rental
Long-term rental accounted for 42.4% of global revenue in 2025, supported by large companies that align furniture payments with multi-year lease commitments. The model offers predictable billing and is familiar to facilities teams that manage stable office locations. Subscription-based furniture-as-a-service is forecast to grow at a 7.9% CAGR through 2031. It gives customers more regular options to change the furniture mix, service level, or contract scope.
NORNORM secured EUR 50 million (USD 58.81 million), equivalent to USD 55 million (USD 64.69 million) at 2025 exchange rates, in October 2025 to expand its furniture subscription model. The company reported EUR 14 million (USD 16.46 million), equivalent to USD 15 million (USD 17.64 million) at 2025 exchange rates, in annual subscription revenue and operational profitability across core markets in 17 countries and 59 cities. Short-term rental remains relevant for events, projects, and relocations where return timing affects profitability. Lease-to-own and leaseback models provide options for organizations that want to move from ownership toward operating expenditure. Together, these models give office furniture rental market suppliers several ways to engage customers those are at different stages of changing their procurement approach. Leaseback can also help companies release capital from furniture bought during earlier office expansion cycles.
By Consumer Type: SMEs Provide Volume While Coworking Operators Accelerate Demand
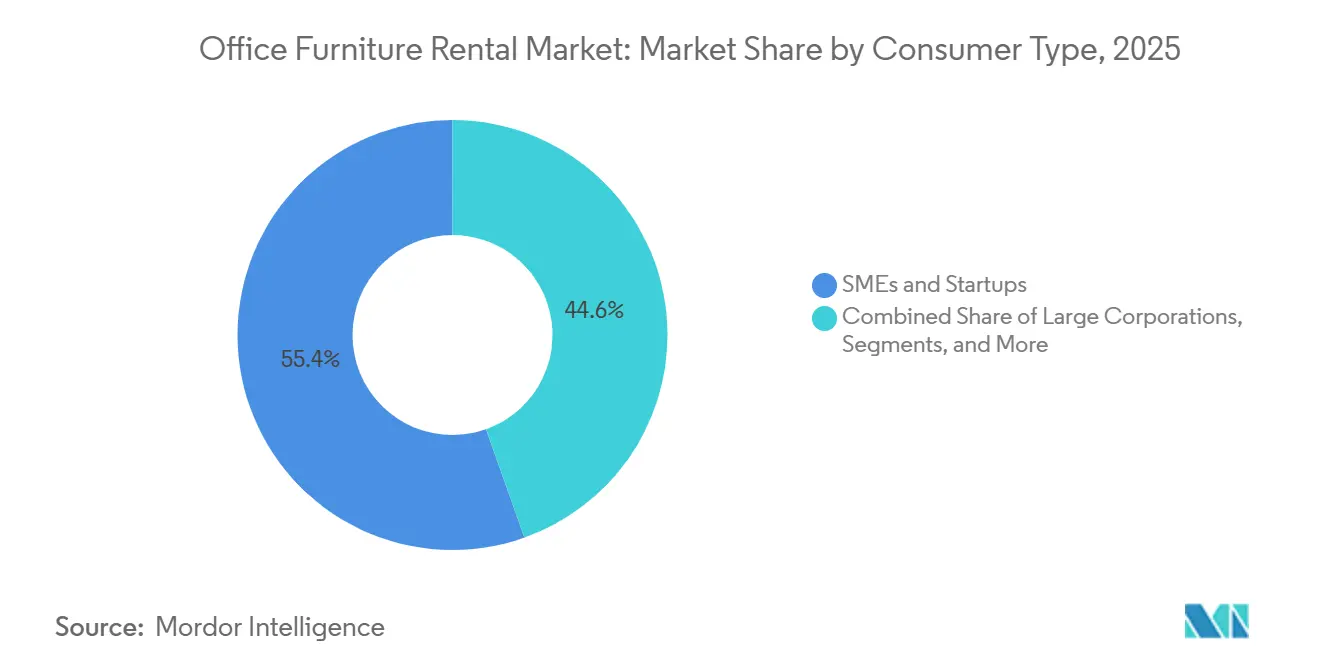
SMEs and startups held 55.4% of global revenue in 2025, reflecting their need to avoid holding unused furniture during changes in headcount. Smaller companies can use rental to open an office without a large initial purchase. Coworking and flexible-workspace operators are forecast to grow at an 8.1% CAGR through 2031. Their multi-site growth creates repeat demand for furnished and operationally ready spaces.
WeWork India ended FY26 with 76 centers, 110,200 members, and 86.9% portfolio occupancy. Enterprise customers contributed 77% of the company’s core revenue, which shows the role of large clients in demand for flexible workspace capacity. Large corporations, public institutions, educational sites, and event operators each require furniture for different time frames and uses. These customer groups also have different expectations for design, maintenance, and the timing of delivery. Office furniture rental market suppliers that offer small entry-level packages can make rental more accessible to early-stage companies. Government and public procurement may create longer contracts where circular purchasing requirements become more common.
By Distribution Channel: Digital Access Expands Customer Reach
Offline showrooms and rental specialists held 64.2% of global revenue in 2025, because large deployments often require in-person planning and site assessment. Customers use these providers for floor-plan design, ergonomic selection, and installation coordination. Online platforms and digital marketplaces are forecast to grow at an 8.3% CAGR through 2031. Digital channels reduce the effort required for SMEs and project teams to start a furniture rental order.
RentoMojo’s platform had an 83.3% product occupancy rate as of March 2026, showing how digital systems can support high asset use. Direct corporate contracts remain important because multi-site customers need tailored supply arrangements and consistent service. Other channels include facilities management providers and workplace technology platforms that add furniture procurement to their services. These intermediaries can create new lead sources, but they can also stand between providers and end customers. Digital catalogs and self-service tools can make it easier for smaller customers to compare packages and begin an order. The office furniture rental market will continue to use both direct consultation and digital ordering because they meet different customer requirements.
Geography Analysis
North America held 37.1% of the global office furniture rental market in 2025, supported by corporate relocations, temporary housing services, and established asset-light workplace practices. CORT completed its acquisition of Dwellworks Living in July 2026 and now operates the business as Dwellworks Living by CORT. The transaction combines furniture rental with corporate housing and relocation support. Europe has moderate growth overall, but country conditions vary, and the German office furniture association reported that conventional office furniture sales declined 10.9% in the first half of 2025.
Asia-Pacific is projected to record the fastest growth at an 8.5% CAGR through 2031, making it the main growth region for the office furniture rental market. India’s flexible workspace capacity is projected to increase 16% to 18% in FY26 and FY27 to 140 million to 145 million sq ft. This pipeline creates demand for offices that can be furnished and opened without a large initial furniture purchase. IWG identified Egypt as its largest growing market globally in 2025 and is targeting 60 centers there by the end of 2026. This expansion points to growing demand for furnished flexible offices across the Middle East and North Africa.
South America is a high-growth area, with Brazil, Chile, Argentina, and Peru providing demand from SMEs and recovering business activity. Rental penetration is lower than in North America and Europe, leaving more room for adoption to increase. Oceania has moderate growth, supported by established coworking activity in Australia’s major cities and demand for subscription services. Russia has lower growth because geopolitical conditions and supply disruption restrict cross-border relationships. Office furniture rental market providers with regional logistics can use SME-focused offerings to address demand in Peru and Chile.
Competitive Landscape
The office furniture rental market remains fragmented, with the top 5 companies together holding 27% of global revenue. Competition is strongest in North America and Western Europe, where logistics reach, fleet quality, and contract flexibility influence supplier selection. Asia-Pacific is more often served by domestic, subscription-focused operators that have limited cross-border coverage. This structure favors companies that can deliver dependable local operations rather than only a recognized brand.
NORNORM is pursuing enterprise customers that value circular subscription services and documented reuse. It's October 2025, EUR 50 million funding round from Verdane, Inter IKEA, Philian AB, and Banco Santander supports further expansion of that model. CORT broadened its service offer through the Dwellworks Living acquisition, adding corporate housing and relocation support to its furniture rental activities. IWG signed 728 locations in the first half of 2026, which increases the downstream demand base for furnished flexible workplaces. These actions show that customer coverage, circular operations, and workplace network expansion are shaping competitive positions in the office furniture rental market.
Integrated refurbishment is a key operational capability because it helps providers return assets to service and document their reuse. Digital asset-tracking systems can also help suppliers monitor location, condition, and maintenance needs across a distributed fleet. Customers in regulated European settings increasingly expect credible reuse information and lifecycle records in procurement processes. Office furniture rental market providers that cannot provide clear asset histories may find it harder to win accounts with sustainability requirements. This favors companies that can connect physical operations with accurate customer reporting.
Office Furniture Rental Industry Leaders
CORT
AFR Furniture Rental
Furlenco
Alvero
NORNORM
- *Disclaimer: Major Players sorted in no particular order

Recent Industry Developments
- September 2026: RentoMojo completed its INR 1,256 crore, equivalent to USD 133 million, IPO in India, which was subscribed 73 times and listed at a 25% premium to its issue price. Shares closed the first day, valuing the company at USD 553 million, making RentoMojo the first listed furniture rental company in India. The listing is expected to catalyze institutional attention toward the Asia-Pacific furniture subscription segment and create a benchmark valuation for comparable operators in the region.
- August 2026: CORT Business Services completed the acquisition of Dwellworks Living, the temporary housing division of Dwellworks, operating it as Dwellworks Living by CORT. The deal merges CORT's furniture rental and transition services infrastructure with Dwellworks Living's corporate housing platform and global supplier network, creating an integrated mobility services offering across furniture, housing, and relocation support for corporate clients in more than 90 countries.
- August 2026: IWG reported H1 2026 network signings of 728 new locations globally, a 47% increase over H1 2025, bringing its total signed network to more than 6,000 locations across 120 countries. India ranked as IWG's third-largest growth market worldwide with 43 signings in H1 2026, underscoring the region's increasing weight in global flexible workspace demand.
- May 2026: WeWork India closed FY26 with 76 centers across 8 cities, 110,200 members, and an all-time high portfolio occupancy of 86.9%. The company sold 48,000 new desks in FY26, its highest total, with enterprise clients contributing 77% of core revenue.


Global Office Furniture Rental Market Report Scope
| Desks and Workstations |
| Chairs and Seating |
| Filing and Storage |
| Conference and Meeting Tables |
| Reception, Break-Room and Ancillary Furniture |
| Short-Term Rental |
| Long-Term Rental |
| Subscription-Based Furniture-as-a-Service |
| Lease-to-Own |
| Leaseback and Circular Purchase |
| SMEs and Startups |
| Large Corporations |
| Coworking and Flexible-Workspace Operators |
| Government Agencies and Public Institutions |
| Educational Institutions |
| Event, Exhibition and Temporary-Office Operators |
| Direct Corporate Contracts |
| Offline Showrooms and Rental Specialists |
| Online Platforms and Digital Marketplaces |
| Other Distribution Channels |
| North America | Canada |
| United States | |
| Mexico | |
| South America | Brazil |
| Peru | |
| Chile | |
| Argentina | |
| Rest of South America | |
| Europe | United Kingdom |
| Germany | |
| France | |
| Spain | |
| Italy | |
| BENELUX (Belgium, Netherlands, and Luxembourg) | |
| NORDICS (Denmark, Finland, Iceland, Norway, and Sweden) | |
| Rest of Europe | |
| Asia-Pacific | India |
| China | |
| Japan | |
| Australia | |
| South Korea | |
| South East Asia (Singapore, Malaysia, Thailand, Indonesia, Vietnam, and the Philippines) | |
| Rest of Asia-Pacific | |
| Middle East and Africa | United Arab Emirates |
| Saudi Arabia | |
| South Africa | |
| Nigeria | |
| Rest of the Middle East and Africa |
| By Product Type | Desks and Workstations | |
| Chairs and Seating | ||
| Filing and Storage | ||
| Conference and Meeting Tables | ||
| Reception, Break-Room and Ancillary Furniture | ||
| By Rental Model | Short-Term Rental | |
| Long-Term Rental | ||
| Subscription-Based Furniture-as-a-Service | ||
| Lease-to-Own | ||
| Leaseback and Circular Purchase | ||
| By Consumer Type | SMEs and Startups | |
| Large Corporations | ||
| Coworking and Flexible-Workspace Operators | ||
| Government Agencies and Public Institutions | ||
| Educational Institutions | ||
| Event, Exhibition and Temporary-Office Operators | ||
| By Distribution Channel | Direct Corporate Contracts | |
| Offline Showrooms and Rental Specialists | ||
| Online Platforms and Digital Marketplaces | ||
| Other Distribution Channels | ||
| By Geography | North America | Canada |
| United States | ||
| Mexico | ||
| South America | Brazil | |
| Peru | ||
| Chile | ||
| Argentina | ||
| Rest of South America | ||
| Europe | United Kingdom | |
| Germany | ||
| France | ||
| Spain | ||
| Italy | ||
| BENELUX (Belgium, Netherlands, and Luxembourg) | ||
| NORDICS (Denmark, Finland, Iceland, Norway, and Sweden) | ||
| Rest of Europe | ||
| Asia-Pacific | India | |
| China | ||
| Japan | ||
| Australia | ||
| South Korea | ||
| South East Asia (Singapore, Malaysia, Thailand, Indonesia, Vietnam, and the Philippines) | ||
| Rest of Asia-Pacific | ||
| Middle East and Africa | United Arab Emirates | |
| Saudi Arabia | ||
| South Africa | ||
| Nigeria | ||
| Rest of the Middle East and Africa | ||


Key Questions Answered in the Report
What is driving demand for office furniture rental?
Hybrid work, flexible office growth, and the need to preserve capital are increasing the demand for adjustable furniture arrangements. Companies can expand, reduce, or refresh their furniture fleet without making a new full purchase when their staffing, office use, or project pipeline changes.
Which product category leads office furniture rental?
Desks and workstations led with 45.5% share in 2025, while chairs and seating are projected to grow at an 8.3% CAGR through 2031. Work surfaces remain essential across standard offices and managed workspaces, while ergonomic seating responds to changing expectations for employee comfort.
Why do SMEs use rented office furniture?
SMEs use rental to avoid large initial purchases and reduce the risk of holding unused furniture when staffing changes. Small packages can make a new office easier to establish, and flexible terms can help companies adjust the scope of a workplace without disposal work.
Which region is expected to grow fastest through 2031?
Asia-Pacific is projected to grow at an 8.5% CAGR through 2031, supported by flexible workspace growth. India’s growing flexible workspace capacity is an important part of this outlook because newly opened sites need ready-to-use workplace furniture and supporting services.
How do furniture-as-a-service arrangements support sustainability goals?
These arrangements can extend product use through refurbishment and redeployment while giving customers reuse records for procurement and reporting. They give suppliers an incentive to retain responsibility for product condition and help customers avoid treating usable furniture as waste at the end of an office project.
Why are online rental platforms becoming more important?
Online channels simplify ordering for SMEs and project teams, while digital systems can support higher utilization of rental assets. They complement consultation for complex workplace projects by helping customers compare packages, review options, and begin a rental request with less administrative effort.
Page last updated on:


 Your data is secure and never sold or shared.


