Nuclear Decommissioning Services Market Size and Share
Market Overview
| Study Period | 2019 - 2030 |
|---|---|
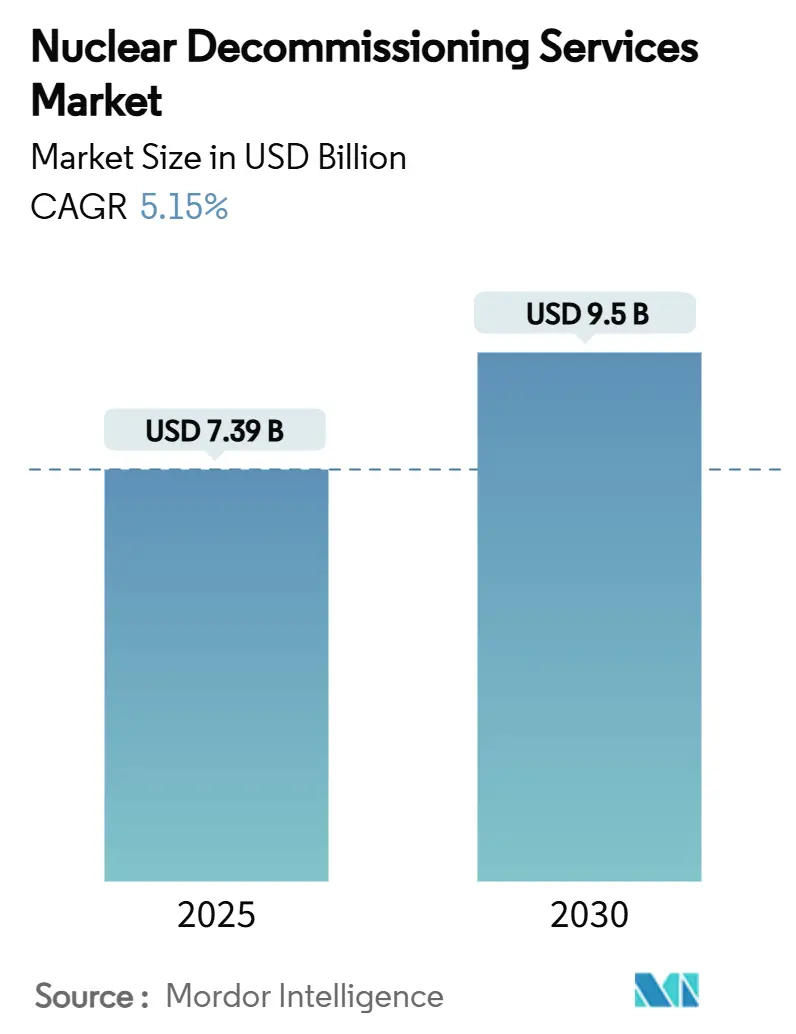
| Market Size (2025) | USD 7.39 Billion |
| Market Size (2030) | USD 9.5 Billion |
| Growth Rate (2025 - 2030) | 5.15% CAGR |
| Fastest Growing Market | Asia Pacific |
| Largest Market | Europe |
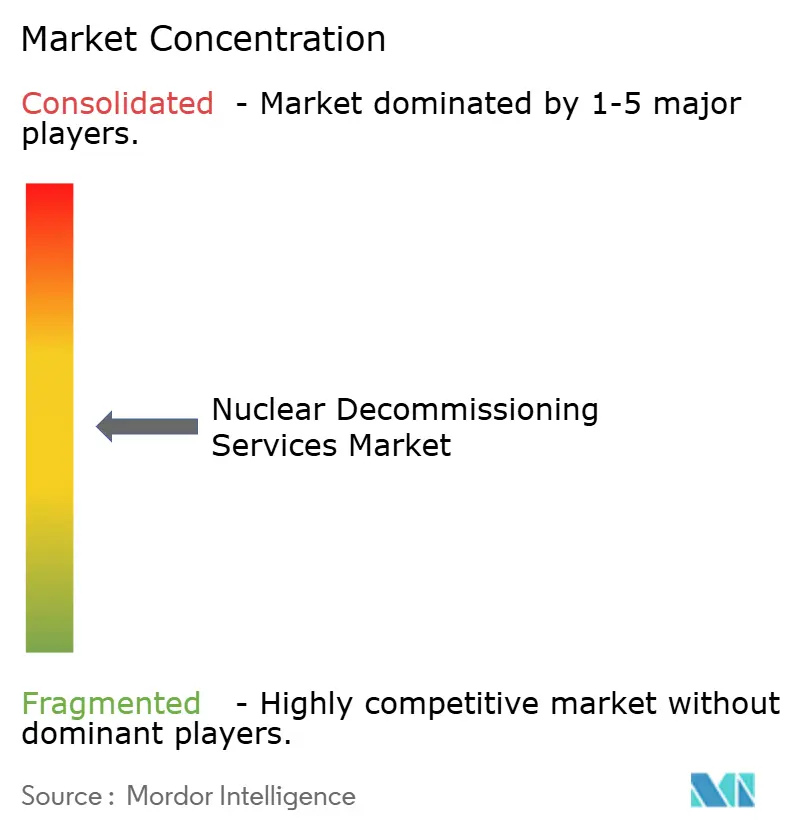
| Market Concentration | Medium |
Major Players *Disclaimer: Major Players sorted in no particular order Image © Mordor Intelligence. Reuse requires attribution under CC BY 4.0. | |
Nuclear Decommissioning Services Market Analysis by Mordor Intelligence
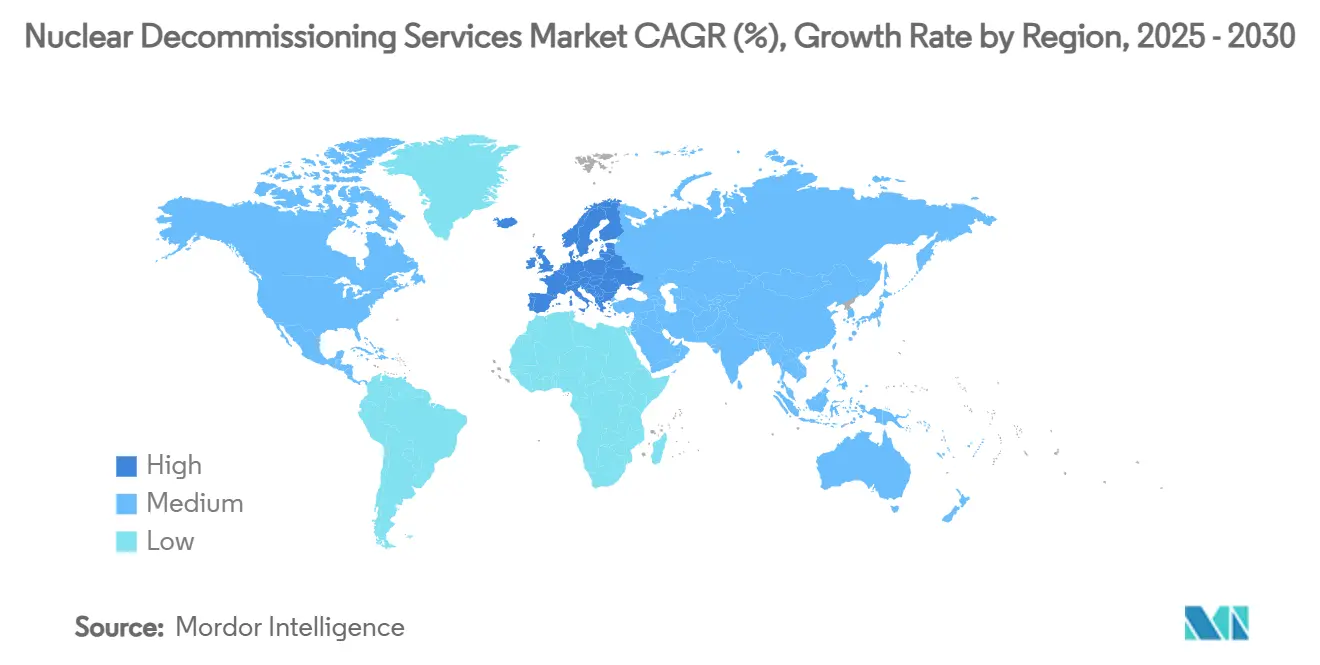
The nuclear decommissioning services market size stands at USD 7.39 billion in 2025 and is projected to reach USD 9.5 billion by 2030, reflecting a 5.15% CAGR. The expansion is fueled by an aging global reactor fleet, tighter post-Fukushima regulations, and the steady accumulation of fully funded decommissioning trusts. Thanks to Germany’s phase-out and the United Kingdom’s Advanced Gas-Cooled Reactor (AGR) retirements, Europe holds the largest share. Asia-Pacific records the fastest growth as Japan, South Korea, and, in time, China address reactor closures. Service demand is shifting from pure dismantling toward advanced waste management and material recovery, while robotics and AI adoption are trimming project timelines and worker dose. Moderate competitive intensity prevails, yet niche specialists focusing solely on dismantling are winning signature contracts traditionally captured by integrated fuel-cycle companies.
Key Report Takeaways
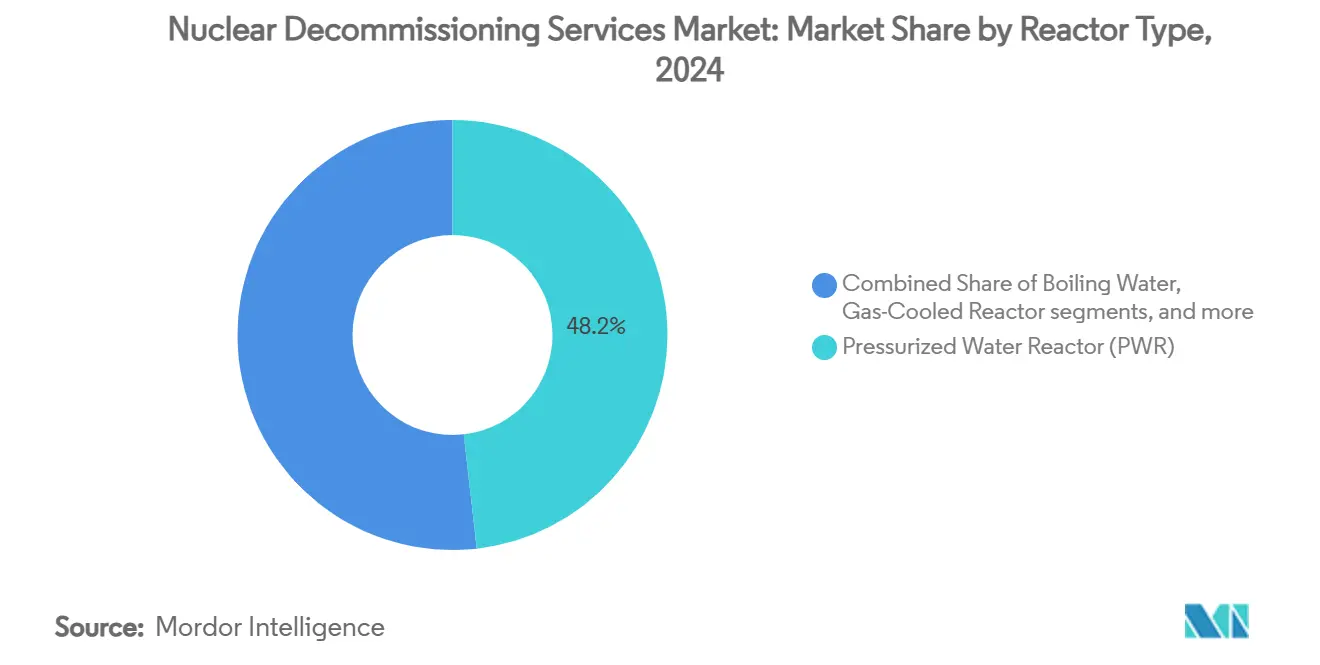
- By reactor type, pressurized water reactors (PWRs) held 48.21% of the nuclear decommissioning services market share in 2024, whereas gas-cooled reactors (GCRs) are advancing at an 8.81% CAGR through 2030.
- By capacity, the 100 to 1,000 MW segment captured 53.41% of the nuclear decommissioning services market size in 2024, while reactors below 100 MW are growing at a 7.2% CAGR to 2030.
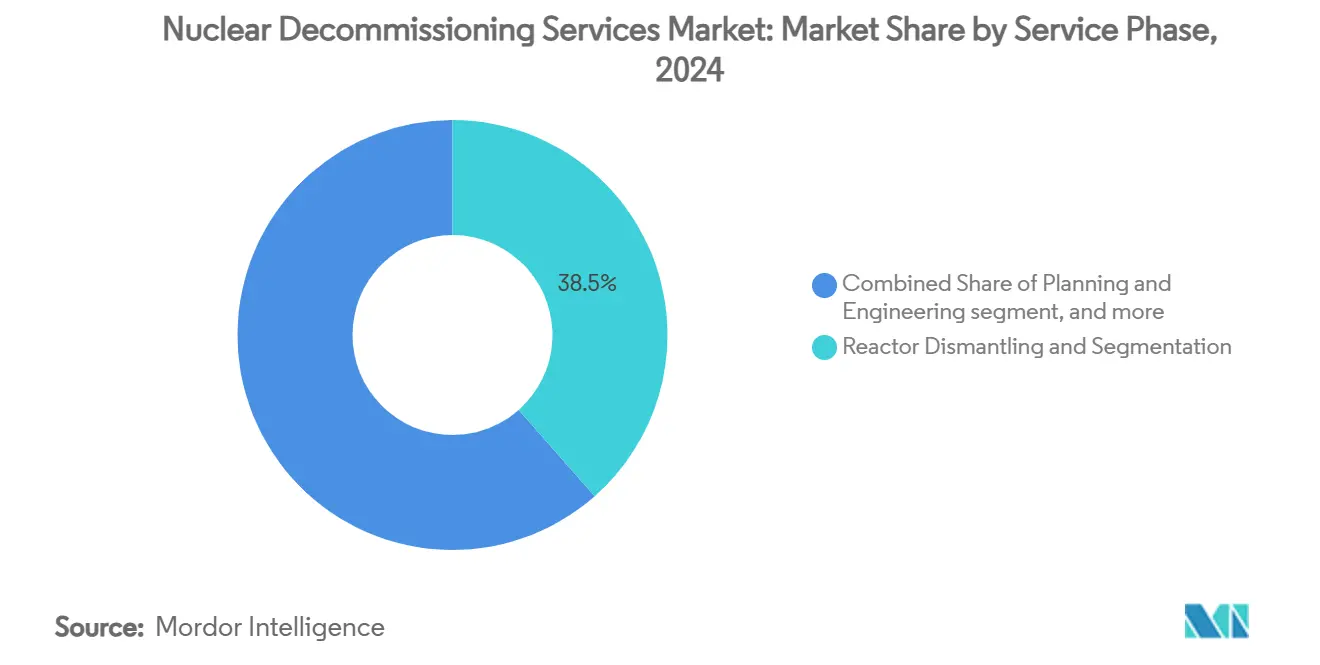
- By service phase, reactor dismantling and segmentation led with a 38.49% share of the nuclear decommissioning services market size in 2024, yet waste management and material handling are accelerating at a 9.54% CAGR.
- By application, commercial power reactors dominated the nuclear decommissioning services market, with 72.32% of the size in 2024, but defense and naval reactors are expanding at a 6.28% CAGR.
- By geography, Europe commanded 41.67% of the nuclear decommissioning services market in 2024, while Asia-Pacific is rising at a 6.76% CAGR through 2030.
Global Nuclear Decommissioning Services Market Trends and Insights
Drivers Impact Analysis*
| Driver | (~) % Impact on CAGR Forecast | Geographic Relevance | Impact Timeline |
|---|---|---|---|
| Ageing global fleet of reactors reaching technical end-of-life | +1.20% | Europe, North America, Asia-Pacific | Long term (≥ 4 years) |
| Stricter post-Fukushima safety and decommissioning regulations | +0.80% | Japan, Germany, EU | Medium term (2-4 years) |
| Mandatory financial provisioning for end-of-life liabilities | +0.60% | North America, EU, Asia-Pacific | Medium term (2-4 years) |
| Growth of national decommissioning funds in Europe and Japan | +0.50% | Europe, Japan, South Korea | Long term (≥ 4 years) |
| Robotics and AI lowering worker-dose and project timelines | +0.40% | United Kingdom, United States, Japan | Short term (≤ 2 years) |
| Circular-economy demand for recycled nuclear-grade metals | +0.30% | France, United States | Long term (≥ 4 years) |
| Source: Mordor Intelligence | |||
Ageing Global Fleet of Reactors Reaching Technical End-of-Life
Over 150 commercial units will retire by 2035 as plants built during the 1970s and 1980s exhaust 40–60-year licenses. Europe feels the squeeze sooner because Germany shuttered its final power reactors in 2023 and the United Kingdom plans to retire its AGR fleet between 2025 and 2030. Finland’s FiR1 research reactor, fully dismantled in 2024, proves that methodical retirement is technically viable and financially manageable, strengthening industry confidence. The predictable queue of closures underpins stable, decade-long order books for suppliers that invest in specialized tooling and project management capacity. This structural demand differentiates nuclear decommissioning from conventional industrial demolition, allowing contractors to secure long-term financing.[1]VTT Research, “Nuclear Decommissioning,” vttresearch.com
Stricter Post-Fukushima Safety and Decommissioning Regulations
After 2011, regulators worldwide introduced sweeping site-specific stress tests, tighter waste-class definitions, and enhanced worker-safety protocols. Japan’s Nuclear Regulation Authority permanently shut 24 units deemed too expensive to upgrade, thereby generating immediate dismantling workloads. The European Union’s coordinated stress-test program drove Belgium, Switzerland, and Germany toward accelerated phase-outs. In 2024, the United States issued interim guidance on discrete radioactive particles, compelling owners to use more sophisticated site-survey techniques.[2]U.S. Nuclear Regulatory Commission, “Draft Interim Staff Guidance on Discrete Radioactive Particles,” federalregister.gov Compliance obligations are transforming decommissioning into a premium, regulation-driven service that only highly qualified vendors can deliver.
Mandatory Financial Provisioning for End-of-Life Liabilities
Regulators require utilities to deposit projected decommissioning costs into fully funded, segregated trusts instead of carrying them as internal book reserves. Germany’s KENFO fund already holds EUR 24.1 billion (USD 28.31 billion) to cover the country’s reactor retirements, creating a transparent mechanism that disburses money only when milestones are met, thereby reducing counter-party risk for contractors. In the United States, the Nuclear Regulatory Commission now performs more frequent adequacy reviews and recently granted PSEG Nuclear targeted exemptions that clarify how trust assets can be applied to spent-fuel management, confirming the agency’s tighter oversight stance. Assured financing eliminates the historic danger of underfunded projects that slip into prolonged SAFSTOR, and it encourages owners to select prompt dismantlement strategies that accelerate cash releases to service providers. The presence of ring-fenced capital also lowers borrowing costs for contractors because banks view disbursements from regulated trusts as low-risk revenue streams.
Growth of National Decommissioning Funds in Europe and Japan
Centralized funds now pool liabilities from multiple operators, spreading risk and benefiting from sovereign credit ratings. Japan adopted this model after Fukushima, and similar structures operate in France, Germany, and the United Kingdom, where the Nuclear Decommissioning Authority receives about GBP 3 billion (USD 4.06 billion) per year from the Treasury and dedicated levies. These public-backed vehicles guarantee payment even if an individual utility becomes insolvent, which shortens receivable cycles for small and midsize contractors and supports a more diverse supplier base. Multi-year budget visibility lets fund managers schedule projects in logical order, smoothing workforce demand and equipment utilization. Predictable disbursements also encourage technology investment, such as remote dismantling tools, because vendors can predict pay-back periods more accurately.
Restraints Impact Analysis*
| Restraint | (~) % Impact on CAGR Forecast | Geographic Relevance | Impact Timeline |
|---|---|---|---|
| Escalating project costs and funding gaps | -0.70% | United Kingdom, United States | Short term (≤ 2 years) |
| Bottlenecks in high-level waste disposal capacity | -0.50% | United States, Europe | Long term (≥ 4 years) |
| Shortage of skilled nuclear-grade dismantling workforce | -0.40% | Europe, North America, Asia-Pacific | Medium term (2-4 years) |
| Political uncertainty delaying reactor retirement decisions | -0.30% | United States, Australia, select EU states | Medium term (2-4 years) |
| Source: Mordor Intelligence | |||
Escalating Project Costs and Funding Gaps
Decommissioning cost forecasts are rising faster than inflation, driven by unexpected technical hurdles, supply-chain constraints, and higher labour premiums for radiation-qualified staff. Sellafield’s lifetime estimate increased to GBP 136 billion (USD 184.14 billion), while Hinkley Point C delays forced EDF to add EUR 12.9 billion (USD 15.15 billion) to its nuclear liabilities. In the United States, the Department of Energy faces USD 675 billion in environmental cleanup obligations, with the Hanford site alone absorbing a USD 45 billion, 10-year contract awarded in 2025.[3]Amentum, “Team Awarded USD 45 Billion Hanford Contract,” amentum.com Such inflation strains even well-capitalised trust funds, creating gaps that can delay project authorizations and dampen near-term market activity. Owners and governments respond by prioritising risk-reduction tasks like fuel removal while deferring complete dismantlement, which stretches overall market timelines and raises total life-cycle expenditure.
Bottlenecks in High-Level Waste Disposal Capacity
Permanent repositories for high-level waste remain scarce, forcing utilities to store spent fuel on site in dry casks or pools long after reactors shut down. The United States now safeguards over 90,000 tons of used fuel across dozens of plants because Yucca Mountain never entered service. Europe relies primarily on Finland’s forthcoming Onkalo facility, which has capacity only for domestic inventory. Extended interim storage lengthens SAFSTOR periods and delays pressure-vessel removal because key components cannot leave the site until a final disposal route exists. Contractors must therefore price projects with large contingency allowances for storage extensions and evolving security requirements, adding complexity to bid evaluations. The uncertainty also hampers workforce planning because project-critical tasks may slip by years if disposal pathways are not resolved on schedule.
*Our forecasts treat driver/restraint impacts as directional, not additive. The impact forecasts reflect baseline growth, mix effects, and variable interactions.
Segment Analysis
By Reactor Type: PWR Dominance Faces AGR Disruption
Pressurized water reactors (PWRs) represented 48.21% of the nuclear decommissioning services market in 2024, reflecting their prevalence within the global fleet. Gas-cooled reactors (predominantly AGRs) are surging at an 8.81% CAGR because the United Kingdom is retiring its entire AGR fleet. The nuclear decommissioning services market size associated with AGR projects will expand as Hunterston B’s defueling completion in 2024 moves the unit into dismantling, followed by Hinkley Point B.
Specialization drives pricing: graphite-core management and CO₂-coolant challenges restrict entry to firms with AGR credentials, such as Magnox Ltd. Fast breeder and VVER units form niche opportunities: Rosatom’s new liquid-sodium treatment unlocks BN-series reactor retirements and commands premium fees.[4]World Nuclear News, “UK Regulator Highlights International Collaboration on SMRs,” world-nuclear-news.org


By Capacity: Mid-Range Reactors Drive Volume Growth
Reactors rated 100 to 1,000 MW captured a 53.41% share of the nuclear decommissioning services market in 2024, benefiting from standardized dismantling work packages that generate economies of scale. The sub-100 MW segment, covering research reactors and naval propulsion units, is growing at a 7.20% CAGR. Finland’s FiR1 completion and the USD 537 million USS Enterprise contract signal steady pipelines for small-unit specialists.
Smaller cores demand bespoke tooling and archival research because design records are often sparse, creating advantages for boutique firms. Conversely, large (greater than 1,000 MW) units offer fewer but longer projects; owners elect life-extension uprates, deferring but not eliminating eventual dismantling.
By Service Phase: Dismantling Leadership Yields to Waste Management
Reactor dismantling and segmentation produced 38.49% of 2024 revenue, as pressure-vessel cutting and large-component lifting remain headline tasks. Yet, the waste management and material handling segment is forecasted to grow 9.54% CAGR to 2030, pushing the nuclear decommissioning services market toward sophisticated volume-reduction, conditioning, and recycling workstreams. The MENDS electrochemical system illustrates how rapid decontamination can reduce total waste volumes and shorten critical-path schedules.
Planning and engineering occur early and command a lower revenue share, while site restoration hinges on final waste-path availability. Until high-level repositories open, the full site's return to unrestricted use will remain protracted.
By Application: Commercial Dominance Challenged by Defense Growth
Commercial power reactors generated 72.32% of 2024 spending, reflecting the civilian fleet’s scale and established decommissioning finance mechanisms. Defense and naval units are expanding at 6.28% CAGR; the US Navy’s aircraft carrier contract is the nuclear decommissioning services industry’s largest single-site agreement, and submarine-compartment disposal continues systematically.
Security requirements and classified systems add cost and complexity, but they also shield margins because only a handful of firms possess the necessary clearances. Research-reactor retirements, often linked to isotope production phase-outs, further enlarge the defense-aligned opportunity pool.
Geography Analysis
Europe held the lion’s share of revenue in 2024 as national policies formalized closure dates, and ring-fenced funds ensured payment certainty. Germany’s KENFO and the United Kingdom’s Nuclear Decommissioning Authority anchor a predictable queue of large contracts that absorb specialized labor and heavy-lift equipment.
Asia-Pacific is the fastest riser because Japan formalized shutdowns for reactors deemed uneconomical to upgrade, while South Korea endorsed its first commercial dismantling project. China’s vast operating fleet is younger, yet long-range procurement plans already specify decommissioning‐ready designs, setting the stage for a robust regional pipeline beginning in the 2040s.
North America’s outlook remains stable thanks to the US Department of Energy’s multi-decade environmental management program and Canada’s life-extension-driven deferrals. Latin America, the Middle East, and Africa contribute marginally today but factor into long-term planning as new reactors under construction will require retirement budgets at license-renewal milestones.

Competitive Landscape
Established nuclear conglomerates such as Orano, EDF Energy, and Westinghouse combine fuel-cycle know-how with dismantling capability to secure tier-one tenders. Engineering majors Jacobs, Fluor, and Bechtel leverage project-management depth and regulatory familiarity to compete aggressively. The field remains moderately concentrated, yet specialist entrants reshape competition: NorthStar triumphed in the Navy’s Enterprise bid by offering a single-purpose dismantling model that undercut vertically integrated rivals.
Innovation separates leaders from followers. Sellafield’s robotic inspections, Amentum’s tank-waste contracts, and Rosatom’s sodium-coolant technology define the next technical frontier. Alliances are common; the Hanford consortium merges BWXT’s fabrication skills, Amentum’s operations experience, and Fluor’s project controls to win a USD 45 billion mandate. Regional firms flourish where domestic licensing rules or language requirements deter foreign entrants, particularly within the Asia-Pacific’s nascent markets.
Success will hinge on digital integration, waste-volume reduction, and trust-fund financing acumen. Firms that excel in these disciplines can win repeat work across the full reactor fleet retirement cycle.
Nuclear Decommissioning Services Industry Leaders
Babcock International Group PLC
Studsvik
Orano Group
EDF Energy Holdings Limited
Westinghouse Electric Company LLC
- *Disclaimer: Major Players sorted in no particular order

Recent Industry Developments
- June 2025: The US Navy awarded NorthStar USD 537 million to dismantle the ex-USS Enterprise, the world’s largest naval decommissioning project.
- March 2025: Amentum won a GBP 2.5 billion (USD 3.38 billion) project-management role for the new-build Sizewell C plant in the United Kingdom, signaling strategic diversification.
- February 2025: Nukem Technologies and Uniper dismantled the second reactor-pressure vessel at Sweden’s Oskarshamn station, ending a four-year program.
- March 2024: Amentum secured a USD 45 billion contract for the Hanford Integrated Tank Disposition project spanning 10–15 years.


Global Nuclear Decommissioning Services Market Report Scope
| Pressurized Water Reactor (PWR) |
| Boiling Water Reactor (BWR) |
| Gas-Cooled Reactor (GCR/AGR) |
| Pressurized Heavy Water Reactor (PHWR/CANDU) |
| Others (FBR, VVER, RBMK) |
| Below 100 MW |
| 100 to 1,000 MW |
| Above 1,000 MW |
| Planning and Engineering |
| Reactor Dismantling and Segmentation |
| Waste Management and Material Handling |
| Site Restoration and Monitoring |
| Commercial Power Reactors |
| Defence and Naval Reactors |
| North America | United States | |
| Canada | ||
| Mexico | ||
| Europe | United Kingdom | |
| France | ||
| Spain | ||
| Russia | ||
| Rest of Europe | ||
| Asia-Pacific | China | |
| India | ||
| Japan | ||
| South Korea | ||
| Rest of Asia-Pacific | ||
| South America | Brazil | |
| Rest of South America | ||
| Middle East and Africa | Middle East | United Arab Emirates |
| Rest of Middle East | ||
| Africa | South Africa | |
| Rest of Africa | ||
| By Reactor Type | Pressurized Water Reactor (PWR) | ||
| Boiling Water Reactor (BWR) | |||
| Gas-Cooled Reactor (GCR/AGR) | |||
| Pressurized Heavy Water Reactor (PHWR/CANDU) | |||
| Others (FBR, VVER, RBMK) | |||
| By Capacity | Below 100 MW | ||
| 100 to 1,000 MW | |||
| Above 1,000 MW | |||
| By Service Phase | Planning and Engineering | ||
| Reactor Dismantling and Segmentation | |||
| Waste Management and Material Handling | |||
| Site Restoration and Monitoring | |||
| By Application | Commercial Power Reactors | ||
| Defence and Naval Reactors | |||
| By Region | North America | United States | |
| Canada | |||
| Mexico | |||
| Europe | United Kingdom | ||
| France | |||
| Spain | |||
| Russia | |||
| Rest of Europe | |||
| Asia-Pacific | China | ||
| India | |||
| Japan | |||
| South Korea | |||
| Rest of Asia-Pacific | |||
| South America | Brazil | ||
| Rest of South America | |||
| Middle East and Africa | Middle East | United Arab Emirates | |
| Rest of Middle East | |||
| Africa | South Africa | ||
| Rest of Africa | |||


Key Questions Answered in the Report
What is the current size of the nuclear decommissioning services market and how fast is it projected to expand?
Spending stands at USD 7.39 billion in 2025 and is forecasted to reach USD 9.50 billion by 2030, reflecting a 5.15% CAGR.
Which region currently accounts for the largest share of nuclear decommissioning spending?
Europe leads with 41.67% of global outlays, driven by Germany’s phase-out and the United Kingdom’s AGR retirements.
Which reactor segment is expected to generate the quickest revenue growth?
Gas-Cooled Reactors, propelled by the UK’s AGR fleet dismantlement, are advancing at an 8.81% CAGR through 2030.
Why is waste management and material handling gaining prominence inside decommissioning projects?
Regulatory pressure to minimise volumes and recover valuable metals is pushing the waste-handling phase to a 9.54% CAGR, outpacing traditional dismantling work.
How do tighter post-Fukushima rules influence decommissioning demand?
Stricter safety and site-release standards accelerate retirement schedules and increase project complexity, pushing owners to engage specialised contractors earlier in the plant closure cycle.
What role do robotics and AI play in nuclear decommissioning today?
Remote manipulators, autonomous inspection systems, and digital twins are cutting worker-dose and compressing schedules, giving early adopters a competitive edge in contract bids.
Page last updated on:


