North America Shale Gas Market Size and Share
Market Overview
| Study Period | 2021 - 2031 |
|---|---|
| Forecast Data Period | 2026 - 2031 |
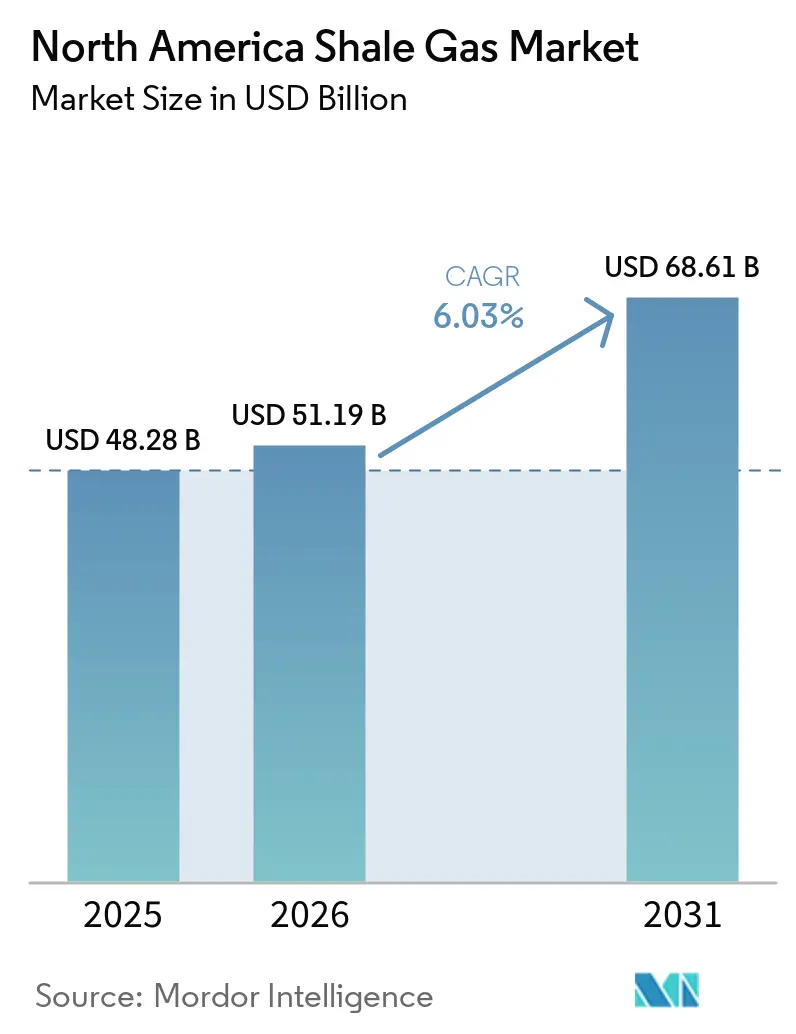
| Base Year Market Size (2025) | USD 48.28 Billion |
| Market Size (2026) | USD 51.19 Billion |
| Market Size (2031) | USD 68.61 Billion |
| Growth Rate (2026 - 2031) | 6.03% CAGR |
| Market Concentration | Medium |
Major Players *Disclaimer: Major Players sorted in no particular order Image © Mordor Intelligence. Reuse requires attribution under CC BY 4.0. | |
North America Shale Gas Market Analysis by Mordor Intelligence
The North America Shale Gas Market size is expected to increase from USD 48.28 billion in 2025 to USD 51.19 billion in 2026 and reach USD 68.61 billion by 2031, growing at a CAGR of 6.03% over 2026-2031. Accelerating scale-up of horizontal drilling and multi-stage hydraulic fracturing, together with real-time digital well surveillance, has lowered breakeven costs and shifted operator focus from acreage accumulation to margin optimization [1]Chevron Corporation, “2025 Permian Basin Investor Update,” chevron.com. Liquids-rich shale plays such as the Permian and Montney are benefiting from robust ethane and propane pull from Gulf Coast and Asian petrochemical complexes. The continued expansion of LNG export capacity at Golden Pass, Plaquemines and LNG Canada reinforces North America’s role as a swing supplier to Atlantic and Pacific basins. In parallel, federal incentives under USC 45I and 45K cushion stripper-well economics and sustain production from mature fields.
Key Report Takeaways
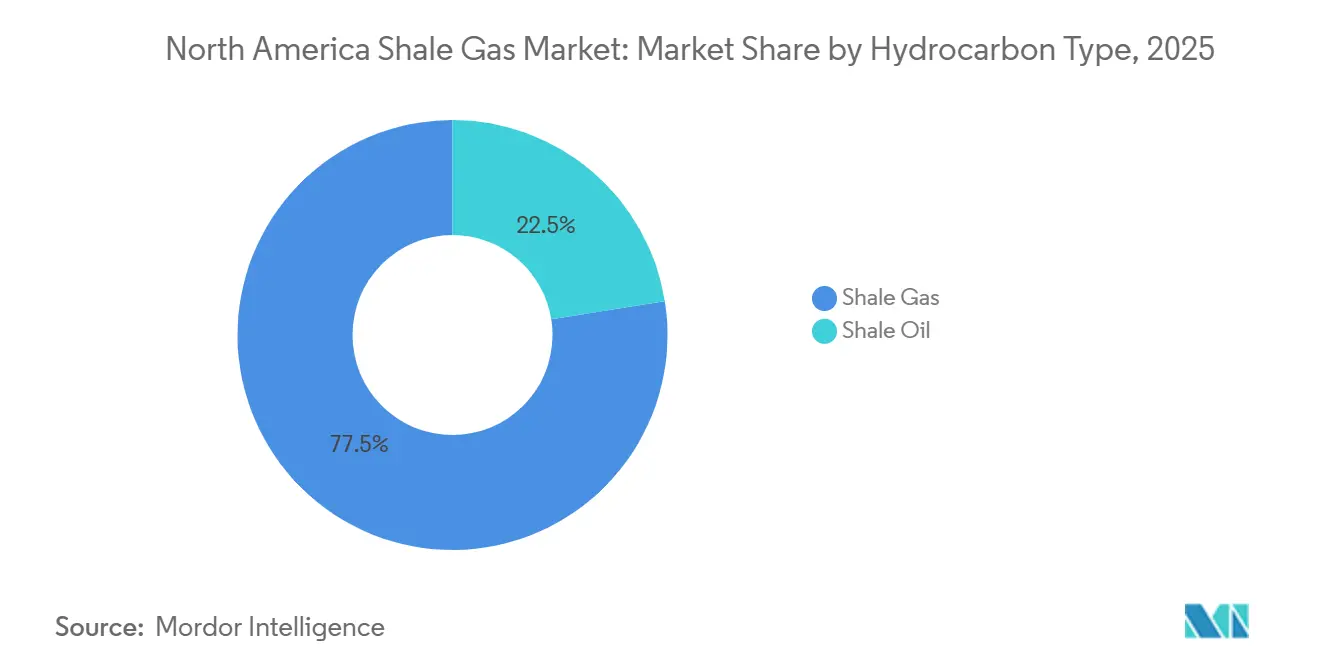
- By hydrocarbon type, shale gas accounted for a 77.5% revenue share in 2025, while shale oil is projected to grow at a CAGR of 6.6% through 2031.
- By extraction technology, Combined horizontal drilling and hydraulic fracturing captured 85.7% of the shale gas production in North America market share in 2025, while the same integrated technique is projected to expand at a 6.2% CAGR to 2031.
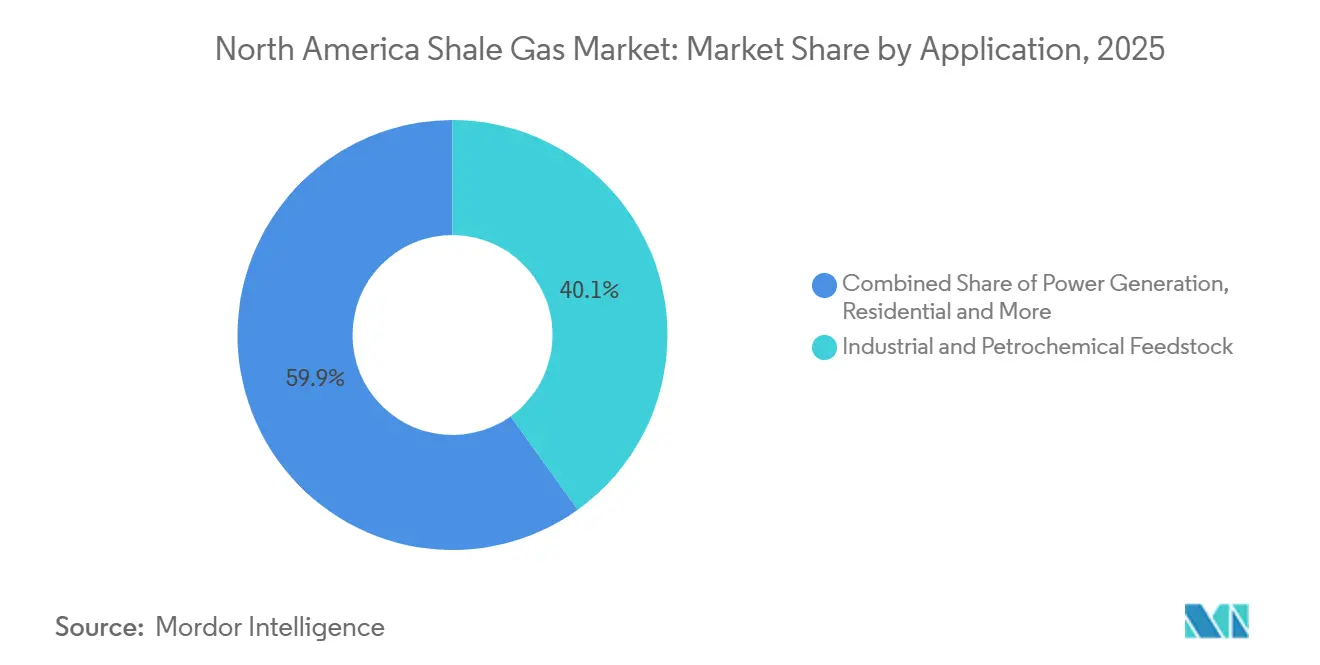
- By application, industrial and petrochemical feedstock applications led with 40.1% revenue share in 2025 and are expected to advance at a 6.4% CAGR through 2031.
- By geography, the United States commanded 90.49% of the shale gas production in North America market size in 2025 and is expected to grow at a 6.32% CAGR through 2031.
Note: Market size and forecast figures in this report are generated using Mordor Intelligence’s proprietary estimation framework, updated with the latest available data and insights as of January 2026.
North America Shale Gas Market Trends and Insights
Drivers Impact Analysis*
| Driver | (~) % Impact on CAGR Forecast | Geographic Relevance | Impact Timeline |
|---|---|---|---|
| Proliferation of horizontal drilling & hydraulic fracturing | +1.8% | United States (Permian, Marcellus, Haynesville), Canada (Montney, Duvernay) | Medium term (2-4 years) |
| Favorable federal and state-level tax incentives | +1.2% | United States (federal USC 45I/45K, Pennsylvania Impact Fee, Texas severance tax exemptions) | Short term (≤ 2 years) |
| Growing domestic demand for low-cost petrochemical feedstock | +1.5% | United States Gulf Coast (Texas, Louisiana ethylene corridor) | Long term (≥ 4 years) |
| Increasing LNG bunkering demand from Great Lakes shipping fleet (post IMO 2030) | +0.6% | United States (Great Lakes ports), Canada (St. Lawrence Seaway) | Long term (≥ 4 years) |
| AI-driven predictive maintenance reducing non-productive time | +0.9% | United States (Permian, Appalachia), Canada (Western Canada Sedimentary Basin) | Medium term (2-4 years) |
| Source: Mordor Intelligence | |||
Proliferation of Horizontal Drilling & Hydraulic Fracturing
Lateral lengths in the Permian and Marcellus now commonly exceed 10,000 feet, while stage counts reach 60-80 per well. Chevron’s triple-frac pad design completed three wells simultaneously in 2025 and cut per-well costs below USD 6 million. Halliburton’s closed-loop pressure-managed fracturing lifts proppant placement efficiency by up to 20% and prolongs fracture half-life. Electric fleets eliminate diesel at the wellsite and have lowered fracturing emissions by 60% in Marcellus field pilots. These advances enlarge technically recoverable resources, keep the shale gas production in North America market on its 6% growth track, and allow operators to re-stimulate legacy wells for incremental recovery.
Favorable Federal and State-Level Tax Incentives
USC 45I grants USD 3 per barrel-of-oil-equivalent for marginal-well output, benefiting roughly 300,000 stripper wells across the United States [2]U.S. Government Publishing Office, “Internal Revenue Code Sections 45I and 45K,” gpo.gov. The USC 45K nonconventional fuels credit pays USD 6.40 per barrel-equivalent and supports Devonian shale redevelopment in Appalachia. Pennsylvania’s Impact Fee returned USD 262 million to local governments in 2024 and nurtured community backing for continued drilling. Texas’ high-cost gas exemption removes severance taxes for deep horizontal wells, shrinking the effective levy from 7.5% to near zero during the first decade of production. These incentives accelerate short-cycle drilling and insulate independents from near-term price swings, supporting expansion of the shale gas production in North America market.
Growing Domestic Demand for Low-Cost Petrochemical Feedstock
U.S. steam crackers enjoy a 40-50% cash-cost advantage over naphtha crackers in Northeast Asia due to abundant ethane supply. ExxonMobil’s Baytown expansion and Chevron Phillips Chemical’s Cedar Bayou project, both online by 2025, collectively consume 115,000 bpd of ethane. Propane exports reached 1.2 million bpd in 2025, tightening NGL balances and lifting ethane prices to USD 0.45 per gallon. Gulf Coast crackers anchor long-term offtake for wet-gas producers, ensuring stable revenue streams for operators in the shale gas production in North America market.
Increasing LNG Bunkering Demand from Great Lakes Fleet (Post IMO 2030)
The IMO 2030 sulfur cap pushes Great Lakes bulk carriers to transition to LNG, cutting SOx by 99% and NOx by 85% compared with heavy fuel oil. The Port of Galveston started North America’s first dedicated LNG bunker terminal in 2024 with 8,000 m³ per-call capacity. Planned facilities in Duluth and Toledo aim to serve roughly 60 vessels that could collectively demand 1.2 million tons of LNG annually by 2030. Proximity to Marcellus and Utica supply grants a delivered-cost edge and unlocks a new outlet for the shale gas production in North America market over the long term.
Restraints Impact Analysis*
| Restraint | (~) % Impact on CAGR Forecast | Geographic Relevance | Impact Timeline |
|---|---|---|---|
| Volatile natural gas prices impacting investment decisions | -1.1% | United States (Permian, Haynesville, Marcellus), Canada (Montney) | Short term (≤ 2 years) |
| Stringent methane emission regulations | -0.8% | United States (EPA jurisdiction), Canada (federal OBPS) | Medium term (2-4 years) |
| Municipal ground-water conservation opposition | -0.4% | United States (Pennsylvania, New York, Colorado) | Long term (≥ 4 years) |
| Limited availability of specialized proppants | -0.3% | United States (Permian, Eagle Ford), Canada (Montney) | Short term (≤ 2 years) |
| Source: Mordor Intelligence | |||
Volatile Natural Gas Prices Impacting Investment Decisions
Henry Hub futures ranged from USD 1.57 per MMBtu in February 2024 to USD 6.80 during Winter Storm Fern in January 2025, a 333% swing that undercut capital budgeting confidence. Forward curves for 2027-2028 average near USD 3.20, barely above the USD 3.00 threshold needed for positive cash flow in the Haynesville. Waha hub discounts widened to USD 2.00 below Henry Hub as pipeline congestion intensified in West Texas. Correlation with TTF and JKM exposes North American producers to geopolitical shocks, prompting a 15-20% deferral of 2026 gas-directed drilling budgets. Price volatility therefore subtracts over one percentage point from forecast growth in the shale gas production in North America market.
Stringent Methane Emission Regulations
EPA’s 2024 methane rule imposes quarterly leak detection and a USD 900 per-ton Waste Emissions Charge on facilities emitting above 25,000 tCO₂-e, adding USD 50,000-100,000 in retrofit costs per well [3]U.S. Environmental Protection Agency, “Final Rule on Oil and Natural Gas Operations,” epa.gov. Canada’s carbon price rises to CAD 170 (USD 125) by 2030 under the federal OBPS, driving electrification of compressor stations. Smaller operators face disproportionate compliance burdens, accelerating consolidation within the shale gas production in North America market.
*Our forecasts treat driver/restraint impacts as directional, not additive. The impact forecasts reflect baseline growth, mix effects, and variable interactions.
Segment Analysis
By Hydrocarbon Type: Associated Gas Economics Drive Oil Bias
Shale gas held 77.5% share of the shale gas production in North America market size in 2025, yet shale oil grew faster at a 6.6% CAGR. Permian output delivered 6.6 million bpd of crude with a 22.2 Bcf/d gas stream, enabling operators to cross-subsidize gas economics.
Liquids-heavy acreage such as the Delaware sub-basin posts gas-to-oil ratios near 3,500 cf/bbl, supporting cash flows even when Henry Hub prices linger below USD 3 per MMBtu. Consequently, large independents continue reallocating rigs from dry-gas Appalachia to oil-weighted basins, a trend that tilts growth toward shale oil yet leaves the shale gas production in North America market resilient on the back of associated volumes.


By Extraction Technology: Integrated Techniques Dominate Efficiency Gains
Combined horizontal drilling and hydraulic fracturing controlled 85.7% of activity and will maintain a 6.2% CAGR through 2031. Stand-alone horizontal drilling is largely confined to naturally fractured reservoirs in the Anadarko Basin.
Chevron’s triple-frac approach lowered completion days by 30% in 2025 and set a new cost benchmark below USD 6 million per well. ProFrac and Seismos validated real-time pressure management that lifted fracture conductivity by 20%, cementing the combined technique as the productivity anchor for the shale gas production in North America market.
By Application: Feedstock Demand Outpaces Power Generation Growth
Industrial and petrochemical uses represented 40.1% of the shale gas production in North America market share in 2025 and will expand at 6.4% CAGR. Gulf Coast crackers alone added eight million tpy of ethylene capacity between 2024 and 2026, absorbing 300,000 bpd of ethane [4]ExxonMobil, “Baytown Olefins Plant Expansion Factsheet,” exxonmobil.com.
Power generation is the primary driver of shale gas demand in North America, driven by the retirement of coal plants and the increasing use of high-efficiency combined-cycle gas turbines with efficiencies nearing 60%. Residential and commercial heating is growing steadily, though this growth is tempered by building electrification mandates in states like New York and California. Additionally, transportation applications, such as LNG bunkering, represent the fastest-growing segment, supported by the acceleration of vessel retrofits to meet International Maritime Organization 2030 compliance targets.
Geography Analysis
The United States delivered 90.49% of overall output in 2025 and is projected to grow at 6.32% through 2031, anchored by the Marcellus’ 35-36 Bcf/d and the Haynesville’s 17 Bcf/d production. Permian associated gas reached 22.2 Bcf/d in December 2025 as operators optimized gas capture to avoid flaring limits under Texas Railroad Commission rules. LNG terminals at Golden Pass and Plaquemines supply Atlantic demand, while Corpus Christi Stage 3 due in 2027 will unlock incremental Gulf Coast offtake.
Canada growth is propelled by the Montney’s ramp-up to feed LNG Canada’s 14 mtpa Kitimat terminal, which absorbed 1.9 Bcf/d of gas in 2025. Tourmaline, ARC Resources and Ovintiv collectively supply over 650,000 boe/d, while Duvernay condensate fetches premium pricing as diluent for oil-sands bitumen.
Mexico continues to import 5.8 Bcf/d from the United States to meet power and industrial demand. Absent regulatory clarity and midstream build-out, Burgos and Sabinas shale potential remains untapped, capping Mexico’s contribution below 3% through 2031.
Competitive Landscape
The North America Shale Gas Market is semi fragmented. ExxonMobil’s USD 59.5 billion purchase of Pioneer in 2024 created a 1.3 million boe/d Permian powerhouse. Chesapeake’s merger with Southwestern forged Expand Energy, now the nation’s largest pure-play gas producer at 8.5 Bcf/d.
Technology is the principal differentiator. Chevron’s triple-frac and ConocoPhillips’ AI-driven geophysics each raise productivity by more than 25% over peers. Independents backed by private equity, such as Verdun Oil & Gas, are acquiring non-core acreage and running lean operations that break even at USD 3.00 gas, compressing margins for legacy producers.
Strategic whitespace includes re-fracturing, where recovery can double at one-third the cost of a new well, and carbon storage, where depleted shale reservoirs offer long-term cash flows via USD 85/t IRC 45Q credits. Operators unable to fund methane compliance upgrades or secure LNG offtake will face mounting consolidation pressure.
North America Shale Gas Industry Leaders
Exxon Mobil Corporation
Chevron Corporation
ConocoPhillips
EOG Resources Inc.
Pioneer Natural Resources Co.
- *Disclaimer: Major Players sorted in no particular order

Recent Industry Developments
- April 2026: Mexico announced a renewed focus on domestic shale gas production (fracking) to decrease dependence on U.S. imports.
- January 2026: Mitsubishi entered the U.S. shale market through a USD 7.5 billion acquisition of Aethon Energy’s Haynesville shale assets. The Haynesville Basin is a significant dry gas and tight gas resource, supporting LNG export demand from the Gulf Coast.


North America Shale Gas Market Report Scope
Shale gas is a type of natural gas trapped in shale rock formations, extracted through methods such as horizontal drilling and hydraulic fracturing. It plays a significant role in the modern energy supply due to its abundance and relatively cleaner combustion.
The North America shale gas market is segmented by hydrocarbon type, extraction technology, application, and geography. By hydrocarbon type, the market is segmented into shale gas and shale oil. By extraction technology, the market is segmented into horizontal drilling only, hydraulic fracturing only, and combined horizontal drilling and hydraulic fracturing. By application, the market is segmented into power generation, industrial and petrochemical feedstock, residential and commercial heating, and transportation. By geography, the market is segmented into the United States, Canada, and Mexico. The report also covers the market sizes and forecasts for the North America shale gas market across these key countries. For each segment, the market sizing and forecasts have been done on the basis of value (USD).
| Shale Gas |
| Shale Oil |
| Horizontal Drilling Only |
| Hydraulic Fracturing Only |
| Combined Horizontal and Hydraulic Fracturing |
| Power Generation |
| Industrial and Petrochemical Feedstock |
| Residential and Commercial Heating |
| Transportation (LNG and CNG) |
| United States |
| Canada |
| Mexico |
| By Hydrocarbon Type | Shale Gas |
| Shale Oil | |
| By Extraction Technology | Horizontal Drilling Only |
| Hydraulic Fracturing Only | |
| Combined Horizontal and Hydraulic Fracturing | |
| By Application | Power Generation |
| Industrial and Petrochemical Feedstock | |
| Residential and Commercial Heating | |
| Transportation (LNG and CNG) | |
| By Geography | United States |
| Canada | |
| Mexico |


Key Questions Answered in the Report
How large will North American shale gas production be in 2031?
The value is projected to reach USD 68.61 billion by 2031, expanding at a 6.03% CAGR from 2026.
Which country supplies most of the region’s shale gas?
The United States provided 90.49% of regional output in 2025 and is on track to retain dominance through 2031.
What technology drives the bulk of current extraction?
Integrated horizontal drilling with multi-stage hydraulic fracturing accounts for 85.7% of activity and continues to grow.
Why is petrochemical demand important to producers?
Gulf Coast ethane crackers secure long-term offtake, giving wet-gas plays a steady revenue stream and supporting 6.4% CAGR in feedstock demand.
How are methane regulations affecting operators?
EPA rules add USD 50,000-100,000 per well for leak-detection retrofits and could shave 0.8 percentage points from forecast growth.
Page last updated on:


