North America NMC Battery Pack Market Size and Share
Market Overview
| Study Period | 2017 - 2029 |
|---|---|
| Forecast Data Period | 2025 - 2029 |
| Historical Data Period | 2017 - 2023 |
| Market Size (2025) | USD 8.41 Billion |
| Market Size (2029) | USD 14.78 Billion |
| Growth Rate (2025 - 2029) | 15.15% CAGR |
| Market Concentration | Low |
Major Players*Disclaimer: Major Players sorted in no particular order Image © Mordor Intelligence. Reuse requires attribution under CC BY 4.0. | |

North America NMC Battery Pack Market Analysis by Mordor Intelligence
The North America NMC Battery Pack Market size is estimated at 8.41 billion USD in 2025, and is expected to reach 14.78 billion USD by 2029, growing at a CAGR of 15.15% during the forecast period (2025-2029).
The North American NMC battery pack industry is experiencing transformative technological advancements that are reshaping its landscape. Battery energy density has shown remarkable improvement, advancing from 250 Wh/kg in 2020 with projections indicating it will reach 350 Wh/kg by 2025, enabling longer driving ranges and improved performance. This technological progression has been accompanied by significant cost reductions, with battery pack prices expected to decrease to USD 100/kWh by 2025. These improvements are driving the industry toward greater efficiency and accessibility, while simultaneously encouraging further innovation in NMC lithium battery chemistry and design. The evolution of battery technology has also led to enhanced thermal management systems and improved safety features, making NMC batteries increasingly reliable for various applications.
Major manufacturers are making substantial investments in domestic production capabilities across North America. In December 2022, Toyota announced a significant investment of USD 1.29 billion for constructing a battery manufacturing facility in North Carolina, with plans to establish four production lines capable of producing 800,000 batteries annually. This trend of localized production is reshaping the industry's supply chain dynamics, reducing dependency on international suppliers, and creating new employment opportunities. These investments are also fostering the development of advanced manufacturing processes and automation technologies, contributing to improved production efficiency and quality control.
The industry is witnessing a strategic shift in battery chemistry composition and material optimization. NMC 811 chemistry is positioned to become the dominant formulation by 2026, representing a significant advancement in battery technology. The average manganese content in NMC battery pack stands at approximately 20%, contributing to their overall performance and stability. This evolution in battery chemistry is driving improvements in energy density while reducing reliance on costly materials. Manufacturers are also investing in research and development to optimize electrode designs and enhance the efficiency of battery module assembly processes.
The market is characterized by increasing collaboration between automotive manufacturers, battery producers, and technology companies. These partnerships are facilitating knowledge sharing, resource optimization, and accelerated innovation in battery technology. Companies are establishing joint ventures and strategic alliances to strengthen their market position and enhance their technological capabilities. The industry is also witnessing the emergence of specialized battery research centers and testing facilities, contributing to continuous improvement in battery performance and safety standards. These collaborative efforts are essential for addressing challenges related to raw material sourcing, manufacturing scalability, and technological advancement. The integration of battery management system technologies is becoming increasingly vital in optimizing the performance and lifespan of lithium ion battery pack solutions.
North America NMC Battery Pack Market Trends and Insights
The major players in the North American electric vehicle market include Tesla, Toyota, Ford, Hyundai, and Honda
- The North American electric vehicle market is majorly driven by the five major players, accounting for more than 70% of the market in 2023. These prominent players include Tesla, Toyota Group, Ford Group, Hyundai, and Honda. Tesla is the highest seller of electric vehicles in the various North American countries, accounting for around 33% of the market. The company focuses on strong innovation technologies and has strong strategic partnerships with various EV components (such as a battery) manufacturers. Being a US-based company, it has a strong customer base with great product and service offerings in major countries like the United States and Canada across North America.
- Toyota Group is the second largest seller of electric vehicles, accounting for around 30.8% market share across North America. The company has a strong supply chain and distribution network. Toyota has a reliable brand image among its customers. It ranks third in EV sales across various countries in North America. Ford Group acquired it with around 9.9% of the market share. The company has a large customer base in North American countries due to its strong brand image and diverse offerings.
- Hyundai is the fourth largest player, acquiring around 5.48% of the market share in EV sales across North America. The company has a strong production and supply chain network, with wide innovative and diverse products offered for various types of customers looking from reasonable to premium pricing. The fifth-largest player operating in the EV market is Honda, maintaining its market share at around 5.22%. Some of the other players selling EVS in North America include Jeep, Chevrolet, BMW, and Volvo.


The United States was the largest market with huge EV demand and captured more than 60% of the battery pack market across the region in 2023
- In 2023, the demand for batteries surged as the number of electric vehicles steadily climbed across several North American countries. Many other brands and models are sold in the region, but the top five models in 2023, the Tesla Model Y, Tesla Model 3, Toyota Rav 4, Toyota Sienna, and Honda CRV, acquired a significant portion of the market. With 247,344 units sold in the United States in 2023, the Tesla Model Y maintained its top spot. The Model Y is very well-liked because of its long range, strong seating capacity, and huge luggage capacity.
- The Tesla Model 3 took second place with 215,500 sales in the United States in 2023. The rear-wheel drive and performance versions of the vehicle are available. Due to its strong performance characteristics, Model 3 is drawing customers. The Toyota Rav4 took third position in electric car sales, with sales of 149,938 in the United States and throughout North America. The vehicle has plug-in hybrid technology and several ADAS features, including Toyota Safety Sense.
- The Toyota Sienna has acquired fourth place in the electric vehicle models’ sales, with 69,720 in the United States. The car comes with the option of a 2.5 l engine with a hybrid powertrain. Consumers with big families looking for seven-seater cars have positively responded to the Toyota Sienna. The fifth place was acquired by the Honda CRV, selling 69,720 units in 2023 in the United States. Other top-selling models include Toyota Highlander, Jeep Wrangler, Toyota Camry, Honda Accord, and Ford Mustang Mach-E.

OTHER KEY INDUSTRY TRENDS COVERED IN THE REPORT
- Surging demand for electric vehicles in North America is driven by government support and growing environmental concerns
- Declining prices of lithium-ion batteries drive the demand for electric vehicles in North America
- Battery prices in North America may continue to decline through 2029, driven by advancements in technology, increasing production efficiency, and rising demand for electric vehicles and renewable energy
- Rising demand for electric vehicles spurs new product launches and market entry in North America, driving battery pack demand
- The dominance of NMC batteries, along with the growing adoption of NCA, LFP, and NCM chemistries in the EV battery market in North America
- Rising electric vehicle sales drive increased demand for battery materials in North America
- Increasing demand and advancements in battery technology drive the growth of electric vehicles in North America
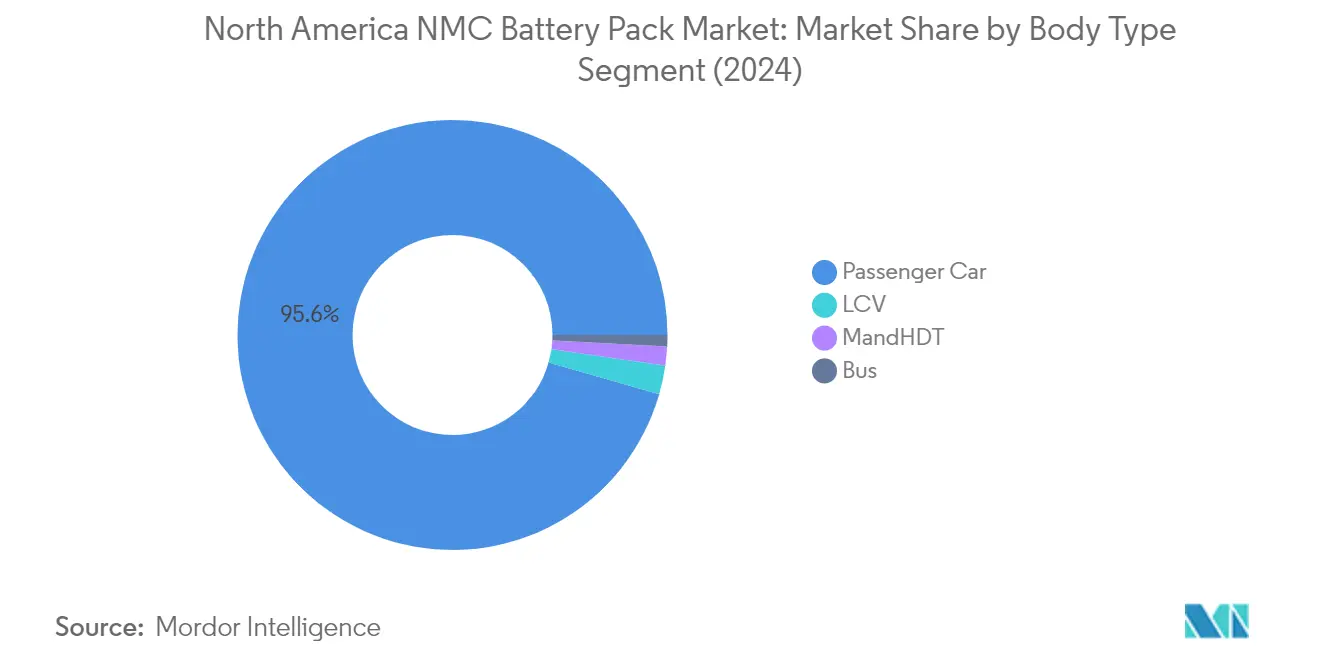
Segment Analysis: Body Type
Passenger Car Segment in North America NMC Battery Pack Market
The passenger car segment dominates the North American NMC battery pack market, commanding approximately 96% market share in 2024. This substantial market position is primarily driven by increasing consumer adoption of electric vehicles and supportive government policies promoting clean transportation. Major automotive manufacturers are expanding their electric vehicle portfolios, with companies like Tesla, General Motors, and Ford introducing new models equipped with NMC cathode material. The segment's growth is further supported by advancements in battery technology, resulting in improved energy density and longer driving ranges. Additionally, the expanding charging infrastructure network across North America and decreasing battery costs have made electric passenger vehicles more attractive to consumers.

Bus Segment in North America NMC Battery Pack Market
The bus segment is emerging as the fastest-growing segment in the North American NMC battery pack market, projected to expand at approximately 45% CAGR from 2024 to 2029. This remarkable growth is driven by increasing initiatives from public transportation authorities to electrify their fleets and reduce carbon emissions. Transit agencies across major North American cities are implementing ambitious electrification programs, supported by federal and state-level funding for zero-emission buses. The segment is witnessing significant technological advancements in battery performance, with improved energy density and faster charging capabilities making electric buses more operationally viable. Manufacturers are developing specialized NMC battery pack configurations optimized for the unique requirements of electric buses, including enhanced thermal management systems and longer operational lifespans.
Remaining Segments in Body Type
The Light Commercial Vehicle (LCV) and Medium & Heavy-Duty Truck (M&HDT) segments represent emerging opportunities in the North American NMC battery pack market. The LCV segment is gaining traction due to increasing adoption by logistics companies and last-mile delivery services looking to reduce operational costs and meet sustainability goals. Meanwhile, the M&HDT segment is experiencing growth driven by the development of electric trucks for regional and long-haul transportation. Both segments are benefiting from technological improvements in battery performance, government incentives for commercial electric vehicles, and the expanding charging infrastructure network designed specifically for commercial applications.
Segment Analysis: Propulsion Type
BEV Segment in North America NMC Battery Pack Market
Battery Electric Vehicles (BEVs) dominate the North American NMC battery pack market, commanding approximately 92% market share in 2024. This substantial market presence is attributed to several factors, including the increasing consumer preference for zero-emission vehicles, supportive government policies, and significant investments in charging infrastructure development. Major automotive manufacturers like Tesla, General Motors, and Ford have expanded their BEV product portfolios, driving the demand for lithium battery cell and NMC cathode material. The segment's growth is further supported by technological advancements in battery chemistry, resulting in improved energy density and longer driving ranges. Additionally, the decreasing costs of NMC battery packs, coupled with enhanced performance characteristics, have made BEVs more attractive to consumers across various vehicle segments, from passenger cars to commercial vehicles.
PHEV Segment in North America NMC Battery Pack Market
The Plug-in Hybrid Electric Vehicle (PHEV) segment is experiencing rapid growth in the North American NMC battery pack market, with a projected growth rate of approximately 29% during 2024-2029. This accelerated growth is driven by increasing consumer demand for vehicles that offer both electric and conventional driving capabilities, providing flexibility in usage patterns. The segment's expansion is supported by continuous improvements in PHEV battery technology, enabling longer electric-only driving ranges and better overall vehicle performance. Automotive manufacturers are investing heavily in PHEV development, introducing new models across various vehicle categories to meet diverse consumer needs. The segment also benefits from government incentives and regulations promoting hybrid vehicle adoption, particularly in regions with developing charging infrastructure.
Segment Analysis: Capacity
40 kWh to 80 kWh Segment in North America NMC Battery Pack Market
The 40 kWh to 80 kWh segment dominates the North American NMC battery pack market, commanding approximately 72% market share in 2024. This segment's prominence can be attributed to its optimal balance between range and cost-effectiveness for electric vehicles. The segment has gained significant traction due to advancements in NCM battery technology, including improvements in energy density and charging capabilities. Major automotive manufacturers are increasingly adopting this capacity range for their mainstream electric vehicle models, as it provides sufficient range for daily commuting while maintaining competitive pricing. The segment's growth is further supported by government incentives and the expanding charging infrastructure across North America. Additionally, the continuous improvements in battery management systems and thermal control technologies have enhanced the overall performance and reliability of battery module in this capacity range.
Above 80 kWh Segment in North America NMC Battery Pack Market
The above 80 kWh segment is emerging as the fastest-growing segment in the North American NMC battery pack market, projected to expand at a robust rate from 2024 to 2029. This remarkable growth is driven by increasing demand for long-range electric vehicles and high-performance applications. The segment is benefiting from technological advancements in battery chemistry and manufacturing processes, enabling higher energy densities and improved charging capabilities. Major automotive manufacturers are investing heavily in developing premium electric vehicles with extended range capabilities, fueling the demand for high-capacity lithium battery cell. The segment's growth is further supported by declining battery costs and improving energy density of NCM batteries. Additionally, the increasing consumer preference for luxury electric vehicles and the growing adoption of electric vehicles in the commercial sector are contributing to the segment's rapid expansion.
Remaining Segments in Capacity Segmentation
The remaining segments in the market include the 15 kWh to 40 kWh and less than 15 kWh categories, each serving specific market niches and applications. The 15 kWh to 40 kWh segment caters primarily to urban electric vehicles and shorter-range applications, offering a balance between cost and functionality for city driving needs. This segment is particularly popular in the compact car segment and for urban delivery vehicles. The less than 15 kWh segment, while smaller in terms of market share, plays a crucial role in hybrid electric vehicles and specific urban mobility solutions. These segments continue to evolve with technological advancements and changing consumer preferences, contributing to the overall diversity and flexibility of the North American NMC battery pack market.
Segment Analysis: Method
Laser Segment in North America NMC Battery Pack Market
The laser method has emerged as the dominant segment in the North American NMC battery pack market, commanding approximately 58% of the market share in 2024. This method has gained significant traction due to its superior precision and efficiency in battery cell assembly, enhanced safety features, and improved thermal management capabilities. The laser welding technique offers several advantages, including the creation of stronger and more reliable connections between battery cells, contributing to the overall durability and performance of NMC battery packs. The segment is experiencing robust growth, projected to expand at around 36% annually from 2024 to 2029, driven by increasing adoption of electric vehicles and advancements in laser technology. The superior energy density and performance achieved through laser welding make it a preferred choice for electric vehicle manufacturers and consumers. Additionally, ongoing technological improvements in laser manufacturing processes are expected to further optimize the performance and energy storage capacity of NMC battery packs, enhancing their appeal in the market.
Wire Segment in North America NMC Battery Pack Market
The wire method represents a significant portion of the North American NMC battery pack market, offering a cost-effective and reliable alternative for battery pack manufacturing. This traditional approach utilizes welding wires to establish connections between battery cells, providing a proven and established methodology for battery assembly. The wire method continues to maintain its relevance due to its simplicity, established manufacturing processes, and lower implementation costs compared to laser technology. The segment benefits from its widespread adoption across various manufacturing facilities and the extensive expertise developed over years of implementation. Manufacturers appreciate the wire method's flexibility in accommodating different battery cell configurations and its ability to meet diverse production requirements. The method's established supply chain and readily available equipment contribute to its continued presence in the market, particularly among manufacturers prioritizing cost-effectiveness while maintaining acceptable quality standards.
Segment Analysis: Component
Cathode Segment in North America NMC Battery Pack Market
The cathode segment dominates the North American NMC battery pack market, holding approximately 69% market share in 2024. This significant market position is attributed to the cathode's crucial role in determining battery performance, energy density, and overall efficiency. The segment's dominance is further strengthened by continuous technological advancements in cathode materials, particularly in nickel-rich compositions that enhance energy density and reduce cobalt content. Major automotive manufacturers across North America are increasingly partnering with cathode material suppliers to secure their supply chains and ensure consistent quality for their electric vehicle battery production. The growing emphasis on sustainable and high-performance cathode materials, coupled with investments in domestic production capabilities, continues to reinforce the segment's market leadership.
Separator Segment in North America NMC Battery Pack Market
The separator segment is emerging as the fastest-growing component in the North American NMC battery pack market, with a projected growth rate of approximately 16% during 2024-2029. This accelerated growth is driven by increasing demand for advanced separator materials that enhance battery safety and performance. Manufacturers are investing in research and development to create thinner, stronger, and more thermally stable separator materials, contributing to improved battery efficiency and safety features. The segment's growth is further supported by innovations in ceramic-coated and composite separators that offer superior thermal stability and mechanical strength. The expansion of electric vehicle production and energy storage applications across North America is creating sustained demand for high-performance separator materials, while advancements in manufacturing processes are helping to optimize production costs and improve material properties.
Remaining Segments in Component
The anode and electrolyte segments play vital roles in the North American NMC battery pack market, each contributing unique properties to battery performance and functionality. The anode segment focuses on developing advanced materials for improved energy storage capacity and faster charging capabilities, with graphite remaining the predominant material choice while silicon-based alternatives gain traction. The electrolyte segment concentrates on enhancing ionic conductivity and thermal stability, with ongoing research into new electrolyte formulations that can operate across wider temperature ranges and provide better safety characteristics. Both segments are experiencing continuous innovation driven by the need for improved battery performance, longer lifespan, and enhanced safety features in electric vehicle applications.
Segment Analysis: Material Type
Other Materials Segment in North America NMC Battery Pack Market
The Other Materials segment, which includes aluminum and copper components, dominates the North American NMC battery pack market, holding approximately 51% market share in 2024. This significant market position is attributed to the essential role these materials play in battery pack construction and performance. Aluminum's lightweight properties contribute to enhanced vehicle efficiency and extended driving range, while copper's superior electrical conductivity ensures efficient power transmission within NMC battery systems. The segment's dominance is further strengthened by the automotive sector's increasing emphasis on energy efficiency and environmental sustainability, which drives the demand for aluminum-based NMC battery packs. Major manufacturers are continuously optimizing their material selection and design processes to improve battery performance while maintaining cost-effectiveness.
Manganese Segment in North America NMC Battery Pack Market
The Manganese segment is projected to exhibit the highest growth rate in the North American NMC battery pack market during 2024-2029, with an expected growth rate of approximately 28%. This remarkable growth is driven by manganese's crucial role in enhancing battery stability and performance while offering a more cost-effective alternative to other materials. The segment's growth is supported by ongoing research and development efforts by leading OEMs to enhance the performance and efficiency of manganese-based cathode materials. Advancements in manufacturing processes and economies of scale are expected to reduce the manufacturing cost of manganese materials per kWh, making it an increasingly economically viable choice. The material's ability to improve energy density and overall battery pack reliability continues to attract investment and innovation in the sector.
Remaining Segments in Material Type
The other significant segments in the North American NMC battery pack market include Cobalt, Lithium, Natural Graphite, and Nickel, each playing vital roles in battery performance and functionality. Cobalt contributes to the stability of battery cathode structures and improves cycling performance, while Lithium serves as the primary charge carrier in these advanced battery systems. Natural Graphite is essential for anode construction, offering high energy density and improved battery life. Nickel enhances energy density and helps reduce overall battery costs. These materials work in synergy to create high-performance battery packs, with manufacturers continuously optimizing their proportions to achieve the best balance of performance, cost, and sustainability.
North America NMC Battery Pack Market Geography Segment Analysis
North America NMC Battery Pack Market in United States
The United States dominates the North American NMC battery pack market, holding approximately 95% market share in 2024. The country's leadership position is underpinned by its robust automotive manufacturing infrastructure and strong government support for electric vehicle adoption. The presence of major electric vehicle manufacturers and NMC battery manufacturers has created a comprehensive ecosystem that drives innovation and market growth. The United States has also made significant strides in developing domestic battery manufacturing capabilities, with several gigafactories either operational or under construction across different states. These facilities are crucial in reducing dependency on international supply chains and ensuring a steady supply of high-quality NMC battery packs. The country's commitment to reducing carbon emissions and promoting sustainable transportation has led to various incentives and policies that encourage the adoption of electric vehicles, subsequently driving the demand for NMC battery packs. Additionally, substantial investments in research and development have enabled technological advancements in battery chemistry and manufacturing processes, further strengthening the United States' position in the market.
North America NMC Battery Pack Market in Canada
Canada has emerged as the fastest-growing market for NMC battery packs in North America, with a projected CAGR of approximately 101% from 2024 to 2029. The country's rich mineral resources, particularly nickel and cobalt, provide a strong foundation for developing a robust battery supply chain. Canada's strategic focus on becoming a global leader in battery manufacturing has attracted significant investments from both domestic and international players. The country's commitment to clean energy transition is reflected in its comprehensive strategy to develop an end-to-end battery supply chain, from mineral extraction to battery production and recycling. Canadian authorities have implemented various initiatives to support the growth of the electric vehicle industry, including investments in charging infrastructure and incentives for electric vehicle adoption. The country's strong emphasis on research and development, supported by collaborations between academia and industry, has fostered innovations in battery technology. Furthermore, Canada's proximity to the United States market and its participation in various trade agreements provide manufacturers with strategic advantages in terms of market access and supply chain integration. This strategic positioning is particularly beneficial for industrial battery pack and commercial battery pack manufacturers looking to expand their market reach.
North America NMC Battery Pack Market in Other Countries
The NMC battery pack market in other North American countries, particularly Mexico, demonstrates significant potential for growth. These markets are characterized by increasing awareness of sustainable transportation solutions and growing investments in electric vehicle infrastructure. The automotive manufacturing expertise present in these regions provides a strong foundation for the development of battery production capabilities. Government initiatives aimed at reducing carbon emissions and promoting clean energy solutions are creating favorable conditions for market expansion. The presence of skilled labor forces and competitive manufacturing costs makes these countries attractive destinations for battery manufacturers looking to establish production facilities. Additionally, these markets benefit from their strategic geographic location, which facilitates trade and integration with major automotive manufacturing hubs in North America. The growing emphasis on developing local supply chains and reducing dependency on imports is expected to drive investments in battery manufacturing capabilities across these regions. Furthermore, increasing collaboration between international technology providers and local manufacturers is fostering knowledge transfer and technological advancement in the battery sector. The development of grid storage battery and energy storage battery pack solutions is also anticipated to contribute significantly to the market's growth trajectory.

Competitive Landscape
Top Companies in North America NMC Battery Pack Market
The North American NMC battery pack market is characterized by intense competition driven by continuous product innovation and technological advancement. Leading companies are heavily investing in research and development to enhance battery performance, energy density, and charging capabilities while reducing costs. Strategic partnerships with automotive manufacturers and the expansion of production facilities across the region have become crucial competitive differentiators. Companies are focusing on vertical integration strategies to secure raw material supply chains and maintain cost competitiveness. Additionally, manufacturers are emphasizing sustainable production practices and developing recycling programs to address environmental concerns. The industry has also witnessed significant investments in automated manufacturing processes and quality control systems to ensure consistent product quality and meet growing demand.
Consolidated Market with Strong Global Players
The North American NMC battery pack market exhibits a highly consolidated structure dominated by established global players with significant technological and financial resources. These market leaders, primarily from Asia and North America, have built strong relationships with major automotive manufacturers and possess extensive experience in battery technology development. The market has witnessed several strategic acquisitions and joint ventures aimed at expanding production capacity and gaining access to advanced technologies. Local players face significant barriers to entry due to high capital requirements and the need for sophisticated technical expertise.
The competitive landscape is further shaped by the presence of diversified conglomerates that leverage their extensive resources and cross-industry expertise to maintain market positions. These companies benefit from established distribution networks and strong brand recognition in the automotive sector. The market has seen increased collaboration between battery manufacturers and automotive OEMs, leading to vertical integration initiatives and exclusive supply agreements. This trend has resulted in a more concentrated market structure where key players control significant portions of the supply chain.
Innovation and Integration Drive Future Success
Success in the North American NMC market increasingly depends on companies' ability to innovate while maintaining cost competitiveness. Market leaders must focus on developing next-generation battery technologies while optimizing production processes to achieve economies of scale. Establishing strong partnerships with raw material suppliers and investing in recycling infrastructure will become crucial for maintaining competitive advantages. Companies need to adapt to evolving regulatory requirements regarding battery safety and environmental standards while maintaining flexibility in their manufacturing operations to meet changing market demands.
For new entrants and smaller players, success lies in identifying and serving specific market niches or developing breakthrough technologies that offer significant advantages over existing solutions. Building strategic partnerships with emerging electric vehicle manufacturers and focusing on specialized applications can provide opportunities for market entry. Companies must also consider potential disruptions from alternative battery technologies and changing consumer preferences while maintaining strong relationships with end-users. The ability to navigate complex regulatory environments and adapt to regional market requirements will be essential for long-term success in this evolving market. Incorporating a robust battery management system can further enhance operational efficiency and product reliability.
North America NMC Battery Pack Industry Leaders
Contemporary Amperex Technology Co. Ltd. (CATL)
Envision AESC Japan Co. Ltd.
Farasis Energy (Ganzhou) Co. Ltd.
LG Energy Solution Ltd.
Samsung SDI Co. Ltd.
- *Disclaimer: Major Players sorted in no particular order


North America NMC Battery Pack Market Report Scope
Bus, LCV, M&HDT, Passenger Car are covered as segments by Body Type. BEV, PHEV are covered as segments by Propulsion Type. 15 kWh to 40 kWh, 40 kWh to 80 kWh, Above 80 kWh, Less than 15 kWh are covered as segments by Capacity. Cylindrical, Pouch, Prismatic are covered as segments by Battery Form. Laser, Wire are covered as segments by Method. Anode, Cathode, Electrolyte, Separator are covered as segments by Component. Cobalt, Lithium, Manganese, Natural Graphite, Nickel are covered as segments by Material Type. Canada, US are covered as segments by Country.| Bus |
| LCV |
| M&HDT |
| Passenger Car |
| BEV |
| PHEV |
| 15 kWh to 40 kWh |
| 40 kWh to 80 kWh |
| Above 80 kWh |
| Less than 15 kWh |
| Cylindrical |
| Pouch |
| Prismatic |
| Laser |
| Wire |
| Anode |
| Cathode |
| Electrolyte |
| Separator |
| Cobalt |
| Lithium |
| Manganese |
| Natural Graphite |
| Nickel |
| Other Materials |
| Canada |
| US |
| Body Type | Bus |
| LCV | |
| M&HDT | |
| Passenger Car | |
| Propulsion Type | BEV |
| PHEV | |
| Capacity | 15 kWh to 40 kWh |
| 40 kWh to 80 kWh | |
| Above 80 kWh | |
| Less than 15 kWh | |
| Battery Form | Cylindrical |
| Pouch | |
| Prismatic | |
| Method | Laser |
| Wire | |
| Component | Anode |
| Cathode | |
| Electrolyte | |
| Separator | |
| Material Type | Cobalt |
| Lithium | |
| Manganese | |
| Natural Graphite | |
| Nickel | |
| Other Materials | |
| Country | Canada |
| US |


Market Definition
- Battery Chemistry - NCM battery type is considred under the scope of battery chemistry.
- Battery Form - The types of battery forms offered under this segment include Cylindrical, Pouch and Prismatic.
- Body Type - Body types considered under this segment include, passenger cars, LCV (light commercial vehicle), M&HDT (medium & heavy duty trucks)and buses.
- Capacity - Various types of battery capacities inldude under theis segment are 15 kWH to 40 kWH, 40 kWh to 80 kWh, Above 80 kWh and Less than 15 kWh.
- Component - Various components covered under this segment include anode, cathode, electrolyte, separator.
- Material Type - Various material covered under this segment include cobalt, lithium, manganese, natural graphite, nickel, other material.
- Method - The types of method covered under this segment include laser and wire.
- Propulsion Type - Propulsion types considered under this segment include BEV (Battery electric vehicles), PHEV (plug-in hybrid electric vehicle).
- ToC Type - ToC 4
- Vehicle Type - Vehicle type considered under this segment include passenger vehicles, and commercial vehicles with various EV powertrains.
| Keyword | Definition |
|---|---|
| Electric vehicle (EV) | A vehicle which uses one or more electric motors for propulsion. Includes cars, buses, and trucks. This term includes all-electric vehicles or battery electric vehicles and plug-in hybrid electric vehicles. |
| PEV | A plug-in electric vehicle is an electric vehicle that can be externally charged and generally includes all electric vehicles as well as plug-electric vehicles as well as plug-in hybrids. |
| Battery-as-a-Service | A business model in which the battery of an EV can be rented from a service provider or swapped with another battery when it runs out of charge |
| Battery Cell | The basic unit of an electric vehicle's battery pack, typically a lithium-ion cell, that stores electrical energy. |
| Module | A subsection of an EV battery pack, consisting of several cells grouped together, often used to facilitate manufacturing and maintenance. |
| Battery Management System (BMS) | An electronic system that manages a rechargeable battery by protecting the battery from operating outside its safe operating area, monitoring its state, calculating secondary data, reporting data, controlling its environment, and balancing it. |
| Energy Density | A measure of how much energy a battery cell can store in a given volume, usually expressed in watt-hours per liter (Wh/L). |
| Power Density | The rate at which energy can be delivered by the battery, often measured in watts per kilogram (W/kg). |
| Cycle Life | The number of complete charge-discharge cycles a battery can perform before its capacity falls under a specified percentage of its original capacity. |
| State of Charge (SOC) | A measurement, expressed as a percentage, that represents the current level of charge in a battery compared to its capacity. |
| State of Health (SOH) | An indicator of the overall condition of a battery, reflecting its current performance compared to when it was new. |
| Thermal Management System | A system designed to maintain optimal operating temperatures for an EV's battery pack, often using cooling or heating methods. |
| Fast Charging | A method of charging an EV battery at a much faster rate than standard charging, typically requiring specialized charging equipment. |
| Regenerative Braking | A system in electric and hybrid vehicles that recovers energy normally lost during braking and stores it in the battery. |


Research Methodology
Mordor Intelligence follows a four-step methodology in all its reports.
- Step-1: Identify Key Variables: To build a robust forecasting methodology, the variables and factors identified in Step-1 are tested against available historical market numbers. Through an iterative process, the variables required for market forecast are set and the model is built based on these variables.
- Step-2: Build a Market Model: Market-size estimations for the historical and forecast years have been provided in revenue and volume terms. Market revenue is calculated by multiplying the volume demand with volume-weighted average battery pack price (per kWh). Battery pack price estimation and forecast takes into account various factors affecting ASP, such as inflation rates, market demand shifts, production costs, technological developments, and consumer preferences, providing estimations for both historical data and future trends.
- Step-3: Validate and Finalize: In this important step, all market numbers, variables, and analyst calls are validated through an extensive network of primary research experts from the market studied. The respondents are selected across levels and functions to generate a holistic picture of the market studied.
- Step-4: Research Outputs: Syndicated Reports, Custom Consulting Assignments, Databases & Subscription Platforms


