Market Overview
| Study Period | 2017 - 2030 |
| Base Year For Estimation | 2024 |
| Forecast Data Period | 2025 - 2030 |
| Market Size (2025) | USD 10.95 Billion |
| Market Size (2030) | USD 15.05 Billion |
| Growth Rate (2025 - 2030) | 6.57% CAGR |
| Market Concentration | Low |
Major Players*Disclaimer: Major Players sorted in no particular order Image © Mordor Intelligence. Reuse requires attribution under CC BY 4.0. |
|

Nigeria Freight and Logistics Market Analysis
The Nigeria Freight and Logistics Market size is estimated at 10.95 billion USD in 2025, and is expected to reach 15.05 billion USD by 2030, growing at a CAGR of 6.57% during the forecast period (2025-2030).
Nigeria's freight and logistics sector is undergoing significant transformation through substantial infrastructure investments and modernization initiatives. The country's infrastructure development requires an estimated USD 35 billion annually from 2023 to 2028 to sustain robust economic growth, highlighting the scale of development needed across the transportation network. In March 2024, the government secured a USD 1.3 billion financing package to complete the railway project connecting Kano with Maradi in Niger, demonstrating its commitment to enhancing regional connectivity. The Nigerian National Petroleum Company's investment of USD 4.1 billion in reconstructing 44 highways, covering 4,500 km of federal highways, further exemplifies the push toward infrastructure enhancement. These developments are crucial for improving the efficiency and reliability of freight movement across the country.
The maritime sector is experiencing substantial modernization efforts to enhance port efficiency and reduce congestion. In April 2024, A.P. Moller-Maersk committed USD 600 million to Nigeria's port expansion and enhancement initiative, complementing the government's USD 1 billion contribution aimed at reconstructing the nation's seaports. The Ministry of Marine and Blue Economy's announcement in March 2024 regarding plans to invest over USD 1 billion in rehabilitating the country's seaports demonstrates the government's focus on maritime infrastructure development. This comprehensive approach to port modernization includes automation initiatives and efficiency improvements, particularly at key ports like Tincan and Apapa, which handle approximately 70% of the country's imports.
The air cargo sector is undergoing strategic developments to enhance competitiveness and infrastructure quality. The government has identified a requirement of NGN 1.5 trillion (USD 5 billion) to upgrade the country's air infrastructure, with specialized committees established to oversee the construction and operation of airports equipped with modern cargo facilities. The implementation of the US-Nigeria Air Transport Bilateral Agreement in May 2024 marks a significant milestone, establishing a modern civil aviation partnership that promises to enhance aviation safety and security standards while expanding international trade opportunities. These developments are particularly crucial as Nigeria positions itself within the African Continental Free Trade Area (AfCFTA).
Nigeria possesses the largest road network in West Africa and the second-largest south of the Sahara, totaling approximately 194,200 kilometers, with federal roads comprising 17.6%, state roads 15.7%, and local and rural roads accounting for 66.7%. The Federal Executive Council's approval of 25-year concessions on nine corridors connecting major population and economic centers represents a significant step toward improving the country's logistics infrastructure. The government's focus on sustainable transportation is evident in its 2050 Policy Agenda, which aims to increase electric vehicle adoption from less than 1% to 7.50% by 2025, demonstrating a long-term commitment to modernizing the logistics sector while reducing environmental impact.
Nigeria Freight and Logistics Market Trends
The transportation sector contribution to nominal GDP dropped to 1.35% in Q2 2023 due to petrol subsidy removal
- In 2024, the government predicted that converting 1 million vehicles to run on CNG could save about USD 2.5 billion annually. This initiative could also help lower the country's inflation rate. CNG vehicles can save 40-50% compared to petrol and are 18 times safer. In Nigeria, especially in Lagos with over 15 million city residents, the transportation sector is struggling with major problems like traffic jams and dirty air. Many of the vehicles on the roads are old and run on petrol, which adds to the pollution. To make things better, in May 2024, Nigeria announced plans to switch 5,500 vehicles to run on CNG. This change is important for cutting down on carbon emissions and making the air cleaner in big cities like Abuja.
- The Nigerian logistics industry has grown slowly due to persistent infrastructure challenges. In 2023, the Nigerian e-commerce market generated USD 6.7 billion in revenue. Its revenue is expected to register a 10.79% CAGR between 2023 and 2027, resulting in a market volume of around USD 10.1 billion by 2027 due to infrastructure improvements in railways and roads and enhanced relations with other nations.
,-Share---Of-GDP,-Nigeria,-2017---2022.svg)
Understand The Key Trends Shaping This Market
Download PDF
Fuel prices have witnessed a steep rise as fuel subsidies have been terminated, citing budgetary concerns
- In April 2024, Nigeria continued to experience gasoline shortages leading to a significant surge in prices and worsening the nation's cost-of-living challenges. In Lagos and Abuja, petrol prices surpassed USD 1.89 per liter, while in places like Kano, they exceeded USD 2.23 per liter. Despite NNPC Ltd. importing petrol at an average of USD 1.37, pump prices remained high. In 2023, the government eliminated subsidies and permitted private firms to import petrol. However, due to foreign currency shortages and a price cap on petrol, NNPC remains the exclusive importer.
- Nigeria's crude oil production has increased, and the country's oil reserves are estimated to be 36.89 billion barrels, consisting of 31.418 billion barrels of crude oil and 5.476 billion barrels of condensate. Nigeria aims to have a reserve of around 40 billion barrels by 2025. The country's national gas reserve is 203.16 trillion cubic feet (TCF), with a target of 210 TCF by 2025 and 220 TCF by 2030.

OTHER KEY INDUSTRY TRENDS COVERED IN THE REPORT
- Nigeria's population is expected to double to more than 400 million by 2050
- GDP contribution driven by a growing economy, construction projects, and domestic manufacturing volumes
- The number of online shoppers is expected to reach 122.5 million by 2025 from 76.7 million in 2021
- Nigeria launched Export774 campaign in 2023 to boost non-oil exports to diversify economy
- The cost of moving containers in Lagos increased by an average of 100% in 2023
- Nigeria ranks 88th in LPI, investing more than USD 1.3 trillion in infrastructure and energy for economic boost
- Declining oil production and exports significantly impacting capacity in the country
- Nigeria’s first deep seaport, Lekki, started operations in 2023 and is expected to become a major cargo hub
- Under the National Development Plan (2021-2025), USD 18.7 billion is budgeted for maritime industry development in Nigeria
- Nigeria aims to strengthen the agriculture sector under the National Agricultural Technology and Innovation Policy (NATIP), 2022-2027
- Supply chain disruptions, high customs tariffs, high foreign exchange rates and removal of electricity and petrol subsidy drove inflation
- Around 767 Nigerian manufacturing companies shut down operations in 2023, affected by exchange rate volatility and rising inflation
- Nigeria strives to reduce import reliance under the 100-for-100 Policy on Production and Productivity
- Nigeria is promoting local production of electric vehicles, with a target of at least 30% local production
- Nigeria is developing its freight transportation network with a USD 845.8 billion budget under the National Development Plan (2021-25)
- Nigeria seaport needs major connectivity enhancements as bilateral trade between Nigeria and China has been at an all-time high
- With rising price of imported petrol, the freight pricing for all modes of transport witnessed since 2022
- Rising focus on development of federal roads and sea port leading to rising freight trade volumes
Segment Analysis: End User Industry
Manufacturing Segment in Nigeria Freight and Logistics Market
The manufacturing segment dominates the Nigeria logistics market, accounting for approximately 39% market share in 2024. This segment's prominence is driven by significant foreign direct investment, which increased to USD 1.59 billion in 2023. The manufacturing sector's expansion is supported by various government initiatives aimed at improving the business environment, attracting additional capital, and strengthening value chain linkages. The government's commitment to boosting the industrial sector through streamlined processes and infrastructure development has further solidified this segment's market leadership. Additionally, the government's target to increase manufacturing's share in total exports to 20% by 2025 has created increased demand for logistics services in this sector.
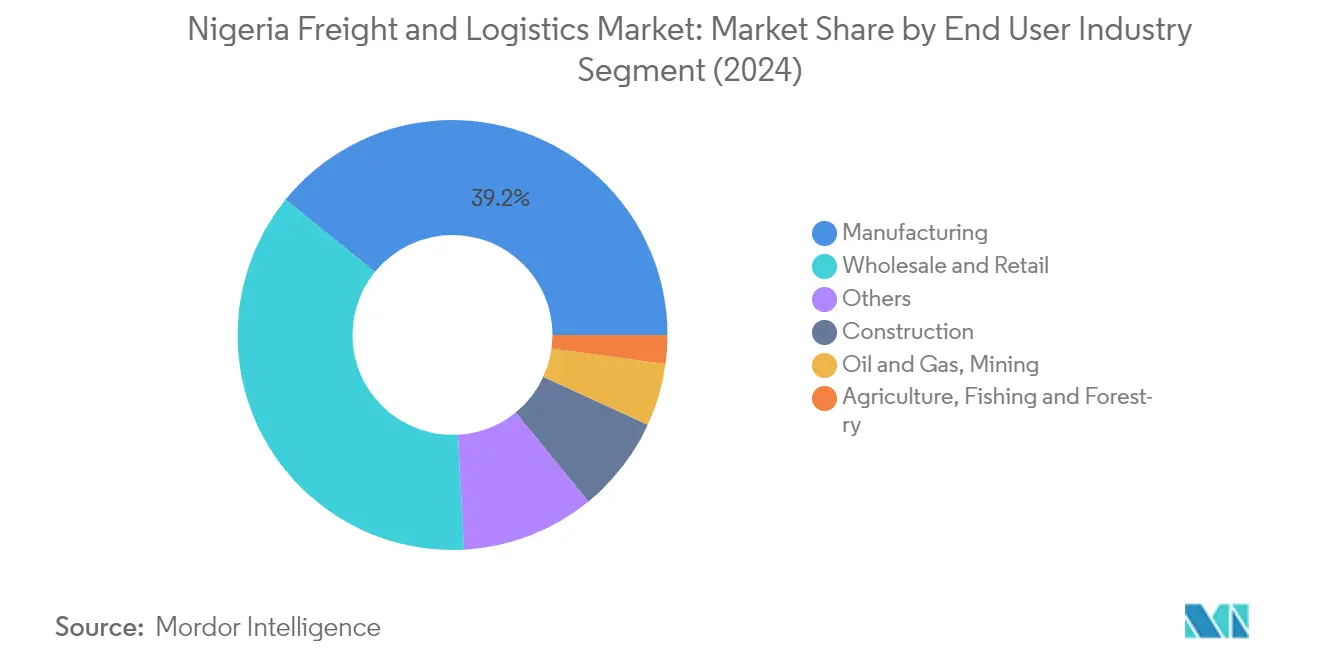
Construction Segment in Nigeria Freight and Logistics Market
The construction segment has emerged as a significant growth driver in the Nigeria logistics market, with a projected growth rate of around 7% from 2024 to 2029. This robust growth is fueled by the Nigerian government's ambitious infrastructure development plans, including the allocation of USD 123.10 billion for capital expenditure projects. The segment's growth is further supported by the establishment of special economic zones across the country's six geo-political zones and the government's focus on affordable housing initiatives. The construction industry's expansion is also driven by significant private sector participation, with an expected contribution of USD 738.60 billion towards infrastructure development, creating substantial opportunities for logistics services.
Remaining Segments in End User Industry
The other segments in the Nigeria freight and logistics market include wholesale and retail trade, oil and gas, mining and quarrying, and agriculture, fishing, and forestry. The wholesale and retail trade segment has been particularly influenced by the rapid growth of e-commerce and digital retail platforms. The oil and gas sector continues to be a crucial component, benefiting from Nigeria's position as a leading oil producer in Africa. The agriculture, fishing, and forestry sector's logistics requirements are driven by the government's focus on agricultural modernization and export promotion. Each of these segments contributes uniquely to the market's dynamics, with varying requirements for specialized logistics services and infrastructure support.
Segment Analysis: Logistics Function
Freight Transport Segment in Nigeria Freight and Logistics Market
The freight transport segment has emerged as both the largest and fastest-growing segment in Nigeria's freight and logistics market. In 2024, this segment accounts for approximately 37% of the total market value, driven by significant investments in transportation infrastructure and growing trade volumes. The segment's dominance is supported by the Nigerian government's USD 4.1 billion investment in reconstructing 44 highways covering 4,500 km of federal highways, along with the Federal Executive Council's approval of 25-year concessions on nine corridors connecting vital population and economic centers. The segment is projected to maintain its leadership position with the highest growth rate of around 7% during 2024-2029, supported by developments like the USD 1.3 billion railway project connecting Kano with Maradi and the ongoing modernization of Nigeria's ports, including the USD 1.5 billion Lekki Deep Sea Port project.
Remaining Segments in Logistics Function
The Nigerian freight and logistics market encompasses several other significant segments including freight forwarding companies in Nigeria, courier, express and parcel (CEP), warehousing and storage, and other logistics services. The freight forwarding segment has been strengthened by the implementation of various trade facilitation measures and the growth of e-commerce activities. The CEP segment has witnessed substantial growth due to the rise of e-commerce and last-mile delivery services, supported by technological advancements and improved delivery networks. The warehousing and storage segment has been transformed by investments in modern facilities and cold chain infrastructure, particularly benefiting from the growth in retail and e-commerce sectors. Warehouse companies in Nigeria are increasingly focusing on modernizing their facilities to meet the growing demand. Other logistics services, including value-added services and specialized logistics solutions, continue to play a crucial role in supporting the overall supply chain ecosystem in Nigeria.
Nigeria Freight and Logistics Industry Overview
Top Companies in Nigeria Freight and Logistics Market
The Nigerian freight and logistics market features prominent players like Maersk, JOF Nigeria, Bolloré Group, Red Star Express, and Africa Access 3PL Limited leading the industry. Companies are increasingly focusing on digital transformation through the implementation of advanced tracking systems, automated warehousing solutions, and integrated logistics platforms to enhance operational efficiency. Strategic partnerships and collaborations, particularly in the e-commerce sector, have become a key trend as companies aim to expand their service offerings and geographical reach. Infrastructure development initiatives, including investments in cold storage facilities, transportation fleets, and warehousing capabilities, demonstrate the industry's commitment to building robust logistics networks. Companies are also emphasizing sustainability through the adoption of electric vehicles and eco-friendly practices, while simultaneously expanding their presence in specialized segments like temperature-controlled logistics and project cargo handling.
Market Structure Shows Mix of Players
The Nigerian freight and logistics market exhibits a fragmented structure with a mix of global logistics giants and local specialists operating across various segments. International players like Maersk and CMA CGM leverage their global networks and technological capabilities to maintain strong positions in the market, particularly in ocean freight and container handling services. Local players such as Red Star Express and JOF Nigeria have carved out significant market share through their deep understanding of regional dynamics and extensive local distribution networks. The market has witnessed increased participation from technology-driven logistics startups, particularly in last-mile delivery and e-commerce fulfillment services, challenging traditional operators to innovate and adapt.
The industry is characterized by strategic partnerships between global and local players to enhance service offerings and market coverage. Merger and acquisition activities have been primarily focused on expanding capabilities in specialized segments such as cold chain logistics and project cargo handling. The market structure is evolving with the entry of e-commerce-focused logistics providers and the expansion of traditional players into value-added services. Companies are increasingly pursuing vertical integration strategies to offer end-to-end logistics solutions, while also maintaining flexibility through strategic partnerships with specialized service providers.
Innovation and Integration Drive Future Success
Success in the Nigerian freight and logistics market increasingly depends on companies' ability to integrate digital solutions while maintaining robust physical infrastructure. Incumbent players must focus on developing comprehensive digital platforms that offer real-time tracking, automated documentation, and seamless customer interfaces while simultaneously expanding their physical presence through strategic infrastructure investments. The ability to offer specialized services in high-growth segments such as cold chain logistics and e-commerce fulfillment will be crucial for maintaining market position. Companies must also strengthen their last-mile delivery capabilities and develop sustainable practices to meet evolving customer expectations and regulatory requirements.
For new entrants and emerging players, success lies in identifying and serving underserved market segments while building strategic partnerships to overcome infrastructure limitations. Companies must focus on developing innovative solutions for specific industry verticals, such as healthcare logistics or agricultural supply chains, while maintaining operational flexibility through asset-light models. The ability to adapt to changing regulatory requirements, particularly in areas such as customs clearance and environmental compliance, will be crucial for long-term success. Players must also invest in building strong relationships with key stakeholders, including government agencies and industry associations, while maintaining operational efficiency through technology adoption and process optimization.
Nigeria Freight and Logistics Market Leaders
-
A.P. Moller - Maersk
-
CMA CGM Group (including CEVA Logistics)
-
DP World (including Imperial Logistics (Pty) Ltd.)
-
Gulf Agency Company (GAC)
-
Red Star Express PLC
- *Disclaimer: Major Players sorted in no particular order

Need More Details on Market Players and Competitors?
Download PDF
Nigeria Freight and Logistics Market News
- August 2024: CEVA Logistics and Bolloré Logistics started to operate under one unified brand, CEVA Logistics, to offer air, ocean, ground, and rail transport, contract logistics, finished vehicle logistics, project logistics, and customs solutions. Already underway, CEVA is expected to complete the rebranding process by the end of 2024. CEVA Logistics gained significant scale and industry experience, particularly in air and ocean freight management, due to the addition of Bolloré Logistics. In addition, CEVA combined its Air and Ocean operations in order to capitalize on best practices and technology investments, notably in finalizing its implementation of CargoWise.
- July 2024: Red Star Express had secured a dedicated space close to its head office, bolstering its e-commerce logistics operations. This facility not only consolidated the company's operations and sales activities but also underscored its dedication to enhancing its e-commerce logistics prowess. Beyond this investment, Red Star Express amplified its brand positioning by erecting a sizable, eye-catching signage at its head office, a strategic move to boost visibility and solidify its market presence.
- April 2024: CMA CGM Group launched SEA REWARD, a loyalty program powered by SpotOn, aimed at enhancing customer experiences in the shipping sector. Customers earned rewards for each booking made through SpotOn. The program operated in Europe and the Levant region (covering Lebanon and Jordan) and extended across the Middle East, reaching countries like Saudi Arabia, East Africa, and India. Plans were in place for a phased global rollout.
Free With This Report
We provide a complimentary and exhaustive set of data points on global and regional metrics that present the fundamental structure of the industry. Presented in the form of 60+ free charts, the section covers difficult to find data on various regions pertaining to e-commerce industry trends, economic contribution of the transportation & storage sector, export and import trends, maritime connectivity Indices, port calls and performance among other key indicators.


List of Tables & Figures
- Figure 1:
- POPULATION DISTRIBUTION BY GENDER, COUNT, NIGERIA, 2017 - 2030
- Figure 2:
- POPULATION DISTRIBUTION BY DEVELOPMENT AREA, COUNT, NIGERIA, 2017 - 2030
- Figure 3:
- POPULATION DENSITY, POPULATION/SQ. KM, NIGERIA, 2017 - 2030
- Figure 4:
- GROSS DOMESTIC PRODUCT (GDP) SHARE OF FINAL CONSUMPTION EXPENDITURE (IN CURRENT PRICES), SHARE % OF GDP, NIGERIA, 2017 - 2023
- Figure 5:
- FINAL CONSUMPTION EXPENDITURE, ANNUAL GROWTH (%), NIGERIA, 2017 - 2023
- Figure 6:
- POPULATION DISTRIBUTION BY MAJOR CITY, COUNT, NIGERIA, 2023
- Figure 7:
- DISTRIBUTION OF GROSS DOMESTIC PRODUCT (GDP) BY ECONOMIC ACTIVITY, SHARE %, NIGERIA, 2022
- Figure 8:
- GROWTH OF GROSS DOMESTIC PRODUCT (GDP) BY ECONOMIC ACTIVITY, CAGR %, NIGERIA, 2017-2022
- Figure 9:
- CONSUMER PRICE INFLATION RATE, %, NIGERIA, 2017 - 2022
- Figure 10:
- GROSS MERCHANDISE VALUE (GMV) OF E-COMMERCE INDUSTRY, USD, NIGERIA, 2017 - 2027
- Figure 11:
- SECTORAL SHARE IN E-COMMERCE INDUSTRY GROSS MERCHANDISE VALUE (GMV), SHARE %, NIGERIA, 2022
- Figure 12:
- GROSS VALUE ADDED (GVA) OF MANUFACTURING INDUSTRY (IN CURRENT PRICES), USD, NIGERIA, 2017 - 2022
- Figure 13:
- SECTORAL SHARE IN GROSS VALUE ADDED (GVA) OF MANUFACTURING INDUSTRY, SHARE %, NIGERIA, 2022
- Figure 14:
- VALUE OF TRANSPORT AND STORAGE SECTOR GROSS DOMESTIC PRODUCT (GDP), USD, NIGERIA, 2017 - 2022
- Figure 15:
- TRANSPORT AND STORAGE SECTOR GROSS DOMESTIC PRODUCT (GDP), SHARE % OF GDP, NIGERIA, 2017 - 2022
- Figure 16:
- VALUE OF EXPORTS, USD, NIGERIA, 2017 - 2023
- Figure 17:
- VALUE OF IMPORTS, USD, NIGERIA, 2017 - 2023
- Figure 18:
- FUEL PRICE BY TYPE OF FUEL, USD/LITER, NIGERIA, 2017 - 2023
- Figure 19:
- OPERATIONAL COSTS OF TRUCKING - BREAKDOWN BY OPERATING COST ELEMENT, %, NIGERIA, 2023
- Figure 20:
- TRUCKING FLEET SIZE BY TYPE, SHARE %, NIGERIA, 2023
- Figure 21:
- RANK OF LOGISTICS PERFORMANCE, RANK, NIGERIA, 2010 - 2023
- Figure 22:
- MODAL SHARE OF FREIGHT TRANSPORTATION SECTOR, SHARE % BY TON-KM, NIGERIA, 2023
- Figure 23:
- MODAL SHARE OF FREIGHT TRANSPORT SECTOR, SHARE % BY TONS, NIGERIA, 2023
- Figure 24:
- MARITIME FLEET LOAD CARRYING CAPACITY OF COUNTRY FLAGGED VESSELS, DEAD WEIGHT TONNAGE (DWT) BY SHIP TYPE, NIGERIA, 2017 - 2022
- Figure 25:
- LINER SHIPPING CONNECTIVITY INDEX, BASE=100 FOR Q1 2006, 2016 - 2022
- Figure 26:
- LINER SHIPPING BILATERAL CONNECTIVITY INDEX, NIGERIA, 2021
- Figure 27:
- PORT LINER SHIP CONNECTIVITY INDEX, BASE=100 FOR Q1 2006, NIGERIA, 2022
- Figure 28:
- MEDIAN TIME SPENT BY VESSELS WITHIN PORT LIMITS OF THE COUNTRY, DAYS, NIGERIA, 2018 - 2021
- Figure 29:
- AVERAGE AGE OF VESSELS THAT HAVE CALLED IN THE COUNTRY'S PORTS, YEARS, NIGERIA, 2018 - 2021
- Figure 30:
- AVERAGE GROSS TONNAGE OF VESSELS ENTERING THE COUNTRY'S PORTS, GROSS TONNAGE (GT), NIGERIA, 2018 - 2021
- Figure 31:
- AVERAGE CARGO CARRYING CAPACITY OF VESSELS THAT HAVE CALLED IN THE COUNTRY'S PORTS, DEAD WEIGHT TONNAGE (DWT) PER VESSEL, NIGERIA, 2018 - 2021
- Figure 32:
- AVERAGE CONTAINER CARRYING CAPACITY PER CONTAINER SHIP FOR VESSELS ENTERING THE PORTS, TWENTY-FOOT EQUIVALENT UNITS (TEUS), NIGERIA, 2018 - 2021
- Figure 33:
- CONTAINER PORT THROUGHPUT, TWENTY-FOOT EQUIVALENT UNITS (TEUS), NIGERIA, 2016 - 2021
- Figure 34:
- TOTAL NUMBER OF SHIP ARRIVALS IN THE COUNTRY'S PORTS, NUMBER OF PORT CALLS, NIGERIA, 2018 - 2021
- Figure 35:
- PRICING TREND OF ROAD FREIGHT TRANSPORT SERVICE, USD/TON-KM, NIGERIA, 2017 - 2023
- Figure 36:
- PRICING TREND OF RAIL FREIGHT TRANSPORT SERVICE, USD/TON-KM, NIGERIA, 2017 - 2023
- Figure 37:
- PRICING TREND OF AIR FREIGHT TRANSPORT SERVICE, USD/TON-KM, NIGERIA, 2017 - 2023
- Figure 38:
- PRICING TREND OF SEA AND INLAND WATERWAYS FREIGHT TRANSPORT SERVICE, USD/TON-KM, NIGERIA, 2017 - 2023
- Figure 39:
- PRICING TREND OF PIPELINES FREIGHT TRANSPORT SERVICE, USD/TON-KM, NIGERIA, 2017 - 2023
- Figure 40:
- FREIGHT HANDLED BY ROAD TRANSPORT, TONS, NIGERIA, 2017 - 2030
- Figure 41:
- FREIGHT HANDLED BY RAIL TRANSPORT, TONS, NIGERIA, 2017 - 2030
- Figure 42:
- FREIGHT HANDLED BY AIR TRANSPORT, TONS, NIGERIA, 2017 - 2030
- Figure 43:
- FREIGHT HANDLED BY SEA AND INLAND WATERWAYS TRANSPORT, TONS, NIGERIA, 2017 - 2030
- Figure 44:
- FREIGHT HANDLED BY PIPELINES TRANSPORT, TONS, NIGERIA, 2017 - 2030
- Figure 45:
- LENGTH OF ROADS, KM, NIGERIA, 2017 - 2022
- Figure 46:
- SHARE OF ROAD LENGTH BY SURFACE CATEGORY, %, NIGERIA, 2022
- Figure 47:
- SHARE OF ROAD LENGTH BY ROAD CLASSIFICATION, %, NIGERIA, 2022
- Figure 48:
- RAIL LENGTH, KM, NIGERIA, 2017 - 2022
- Figure 49:
- CONTAINERS HANDLED AT MAJOR PORTS, TWENTY-FOOT EQUIVALENT UNITS (TEUS), NIGERIA, 2022
- Figure 50:
- CARGO WEIGHT HANDLED AT MAJOR AIRPORTS, TONS, NIGERIA, 2022
- Figure 51:
- VALUE OF FREIGHT AND LOGISTICS MARKET, USD, NIGERIA, 2017 - 2030
- Figure 52:
- VALUE OF FREIGHT AND LOGISTICS MARKET BY END USER INDUSTRY, USD, NIGERIA, 2017 - 2030
- Figure 53:
- VALUE SHARE OF FREIGHT AND LOGISTICS MARKET BY END USER INDUSTRY, %, NIGERIA, 2017 - 2030
- Figure 54:
- VALUE OF AFF INDUSTRY (AGRICULTURE, FISHING AND FORESTRY) LOGISTICS MARKET, USD, NIGERIA, 2017 - 2030
- Figure 55:
- CAGR OF AFF INDUSTRY (AGRICULTURE, FISHING AND FORESTRY) LOGISTICS MARKET, %, NIGERIA, 2017 - 2030
- Figure 56:
- VALUE OF CONSTRUCTION LOGISTICS MARKET, USD, NIGERIA, 2017 - 2030
- Figure 57:
- CAGR OF CONSTRUCTION LOGISTICS MARKET, %, NIGERIA, 2017 - 2030
- Figure 58:
- VALUE OF MANUFACTURING LOGISTICS MARKET, USD, NIGERIA, 2017 - 2030
- Figure 59:
- CAGR OF MANUFACTURING LOGISTICS MARKET, %, NIGERIA, 2017 - 2030
- Figure 60:
- VALUE OF EXTRACTIVE INDUSTRY (OIL AND GAS, MINING AND QUARRYING) LOGISTICS MARKET, USD, NIGERIA, 2017 - 2030
- Figure 61:
- CAGR OF EXTRACTIVE INDUSTRY (OIL AND GAS, MINING AND QUARRYING) LOGISTICS MARKET, %, NIGERIA, 2017 - 2030
- Figure 62:
- VALUE OF DISTRIBUTIVE TRADE (WHOLESALE AND RETAIL TRADE) LOGISTICS MARKET, USD, NIGERIA, 2017 - 2030
- Figure 63:
- CAGR OF DISTRIBUTIVE TRADE (WHOLESALE AND RETAIL TRADE) LOGISTICS MARKET, %, NIGERIA, 2017 - 2030
- Figure 64:
- VALUE OF OTHER END USERS LOGISTICS MARKET, USD, NIGERIA, 2017 - 2030
- Figure 65:
- CAGR OF OTHER END USER LOGISTICS MARKET, %, NIGERIA, 2017 - 2030
- Figure 66:
- VALUE OF FREIGHT AND LOGISTICS MARKET BY LOGISTICS FUNCTION, USD, NIGERIA, 2017 - 2030
- Figure 67:
- VALUE SHARE OF FREIGHT AND LOGISTICS MARKET BY LOGISTICS FUNCTION, %, NIGERIA, 2017 - 2030
- Figure 68:
- VALUE OF COURIER, EXPRESS, AND PARCEL (CEP) MARKET BY DESTINATION TYPE, USD, NIGERIA, 2017 - 2030
- Figure 69:
- VALUE SHARE OF COURIER, EXPRESS, AND PARCEL (CEP) MARKET BY DESTINATION TYPE, %, NIGERIA, 2017 - 2030
- Figure 70:
- VALUE OF DOMESTIC COURIER, EXPRESS, AND PARCEL (CEP) MARKET, USD, NIGERIA, 2017 - 2030
- Figure 71:
- VOLUME OF DOMESTIC COURIER, EXPRESS, AND PARCEL (CEP) MARKET, NUMBER OF PARCELS, NIGERIA, 2017 - 2030
- Figure 72:
- VALUE SHARE OF DOMESTIC COURIER, EXPRESS, AND PARCEL (CEP) MARKET BY END USER INDUSTRY, %, NIGERIA, 2022 VS 2030
- Figure 73:
- VALUE OF INTERNATIONAL COURIER, EXPRESS, AND PARCEL (CEP) MARKET, USD, NIGERIA, 2017 - 2030
- Figure 74:
- VOLUME OF INTERNATIONAL COURIER, EXPRESS, AND PARCEL (CEP) MARKET, NUMBER OF PARCELS, NIGERIA, 2017 - 2030
- Figure 75:
- VALUE SHARE OF INTERNATIONAL COURIER, EXPRESS, AND PARCEL (CEP) MARKET BY END USER INDUSTRY, %, NIGERIA, 2022 VS 2030
- Figure 76:
- VALUE OF FREIGHT FORWARDING MARKET BY MODE OF TRANSPORT, USD, NIGERIA, 2017 - 2030
- Figure 77:
- VALUE SHARE OF FREIGHT FORWARDING MARKET BY MODE OF TRANSPORT, %, NIGERIA, 2017 - 2030
- Figure 78:
- VALUE OF AIR FREIGHT FORWARDING MARKET, USD, NIGERIA, 2017 - 2030
- Figure 79:
- VALUE SHARE OF AIR FREIGHT FORWARDING MARKET BY END USER INDUSTRY, %, NIGERIA, 2022 VS 2030
- Figure 80:
- VALUE OF SEA AND INLAND WATERWAYS FREIGHT FORWARDING MARKET, USD, NIGERIA, 2017 - 2030
- Figure 81:
- VALUE SHARE OF SEA AND INLAND WATERWAYS FREIGHT FORWARDING MARKET BY END USER INDUSTRY, %, NIGERIA, 2022 VS 2030
- Figure 82:
- VALUE OF OTHERS FREIGHT FORWARDING MARKET, USD, NIGERIA, 2017 - 2030
- Figure 83:
- VALUE SHARE OF FREIGHT FORWARDING MARKET'S OTHERS SEGMENT BY END USER INDUSTRY, %, NIGERIA, 2022 VS 2030
- Figure 84:
- VOLUME OF FREIGHT TRANSPORT MARKET BY MODE OF TRANSPORT, TON-KM, NIGERIA, 2017 - 2030
- Figure 85:
- VALUE OF FREIGHT TRANSPORT MARKET BY MODE OF TRANSPORT, USD, NIGERIA, 2017 - 2030
- Figure 86:
- VALUE SHARE OF FREIGHT TRANSPORT MARKET BY MODE OF TRANSPORT, %, NIGERIA, 2017 - 2030
- Figure 87:
- VALUE OF AIR FREIGHT TRANSPORT MARKET, USD, NIGERIA, 2017 - 2030
- Figure 88:
- VOLUME OF AIR FREIGHT TRANSPORT MARKET, TON-KM, NIGERIA, 2017 - 2030
- Figure 89:
- VALUE SHARE OF AIR FREIGHT TRANSPORT MARKET BY END USER INDUSTRY, %, NIGERIA, 2022 VS 2030
- Figure 90:
- VALUE OF PIPELINES FREIGHT TRANSPORT MARKET, USD, NIGERIA, 2017 - 2030
- Figure 91:
- VOLUME OF PIPELINES FREIGHT TRANSPORT MARKET, TON-KM, NIGERIA, 2017 - 2030
- Figure 92:
- VALUE SHARE OF PIPELINES FREIGHT TRANSPORT MARKET BY END USER INDUSTRY, %, NIGERIA, 2022 VS 2030
- Figure 93:
- VALUE OF RAIL FREIGHT TRANSPORT MARKET, USD, NIGERIA, 2017 - 2030
- Figure 94:
- VOLUME OF RAIL FREIGHT TRANSPORT MARKET, TON-KM, NIGERIA, 2017 - 2030
- Figure 95:
- VALUE SHARE OF RAIL FREIGHT TRANSPORT MARKET BY END USER INDUSTRY, %, NIGERIA, 2022 VS 2030
- Figure 96:
- VALUE OF ROAD FREIGHT TRANSPORT MARKET, USD, NIGERIA, 2017 - 2030
- Figure 97:
- VOLUME OF ROAD FREIGHT TRANSPORT MARKET, TON-KM, NIGERIA, 2017 - 2030
- Figure 98:
- VALUE SHARE OF ROAD FREIGHT TRANSPORT MARKET BY END USER INDUSTRY, %, NIGERIA, 2022 VS 2030
- Figure 99:
- VALUE OF SEA AND INLAND WATERWAYS FREIGHT TRANSPORT MARKET, USD, NIGERIA, 2017 - 2030
- Figure 100:
- VOLUME OF SEA AND INLAND WATERWAYS FREIGHT TRANSPORT MARKET, TON-KM, NIGERIA, 2017 - 2030
- Figure 101:
- VALUE SHARE OF SEA AND INLAND WATERWAYS FREIGHT TRANSPORT MARKET BY END USER INDUSTRY, %, NIGERIA, 2022 VS 2030
- Figure 102:
- VALUE OF WAREHOUSING AND STORAGE MARKET BY TEMPERATURE CONTROL, USD, NIGERIA, 2017 - 2030
- Figure 103:
- VALUE SHARE OF WAREHOUSING AND STORAGE MARKET BY TEMPERATURE CONTROL, %, NIGERIA, 2017 - 2030
- Figure 104:
- VALUE OF NON-TEMPERATURE CONTROLLED WAREHOUSING AND STORAGE MARKET, USD, NIGERIA, 2017 - 2030
- Figure 105:
- VOLUME OF NON-TEMPERATURE CONTROLLED WAREHOUSING AND STORAGE MARKET, SQUARE FEET, NIGERIA, 2017 - 2030
- Figure 106:
- VALUE SHARE OF NON-TEMPERATURE CONTROLLED WAREHOUSING AND STORAGE MARKET BY END USER INDUSTRY, %, NIGERIA, 2022 VS 2030
- Figure 107:
- VALUE OF TEMPERATURE CONTROLLED WAREHOUSING AND STORAGE MARKET, USD, NIGERIA, 2017 - 2030
- Figure 108:
- VOLUME OF TEMPERATURE CONTROLLED WAREHOUSING AND STORAGE MARKET, SQUARE FEET, NIGERIA, 2017 - 2030
- Figure 109:
- VALUE SHARE OF TEMPERATURE CONTROLLED WAREHOUSING AND STORAGE MARKET BY END USER INDUSTRY, %, NIGERIA, 2022 VS 2030
- Figure 110:
- VALUE OF OTHER SERVICES SEGMENT OF FREIGHT AND LOGISTICS MARKET, USD, NIGERIA, 2017 - 2030
- Figure 111:
- CAGR OF OTHER SERVICES (VALUE ADDED SERVICES) LOGISTICS MARKET, %, NIGERIA, 2017 - 2030
- Figure 112:
- MOST ACTIVE COMPANIES BY NUMBER OF STRATEGIC MOVES, COUNT, NIGERIA, 2017 - 2023
- Figure 113:
- MOST ADOPTED STRATEGIES, COUNT, NIGERIA, 2017 - 2023
- Figure 114:
- VALUE SHARE OF MAJOR PLAYERS, %, NIGERIA
Nigeria Freight and Logistics Industry Segmentation
Agriculture, Fishing, and Forestry, Construction, Manufacturing, Oil and Gas, Mining and Quarrying, Wholesale and Retail Trade, Others are covered as segments by End User Industry. Courier, Express, and Parcel (CEP), Freight Forwarding, Freight Transport, Warehousing and Storage are covered as segments by Logistics Function.| End User Industry | Agriculture, Fishing, and Forestry | |||
| Construction | ||||
| Manufacturing | ||||
| Oil and Gas, Mining and Quarrying | ||||
| Wholesale and Retail Trade | ||||
| Others | ||||
| Logistics Function | Courier, Express, and Parcel (CEP) | By Destination Type | Domestic | |
| International | ||||
| Freight Forwarding | By Mode Of Transport | Air | ||
| Sea and Inland Waterways | ||||
| Others | ||||
| Freight Transport | By Mode Of Transport | Air | ||
| Pipelines | ||||
| Rail | ||||
| Road | ||||
| Sea and Inland Waterways | ||||
| Warehousing and Storage | By Temperature Control | Non-Temperature Controlled | ||
| Temperature Controlled | ||||
| Other Services | ||||
End User Industry
| Agriculture, Fishing, and Forestry |
| Construction |
| Manufacturing |
| Oil and Gas, Mining and Quarrying |
| Wholesale and Retail Trade |
| Others |
Logistics Function
| Courier, Express, and Parcel (CEP) | By Destination Type | Domestic | |
| International | |||
| Freight Forwarding | By Mode Of Transport | Air | |
| Sea and Inland Waterways | |||
| Others | |||
| Freight Transport | By Mode Of Transport | Air | |
| Pipelines | |||
| Rail | |||
| Road | |||
| Sea and Inland Waterways | |||
| Warehousing and Storage | By Temperature Control | Non-Temperature Controlled | |
| Temperature Controlled | |||
| Other Services | |||
Need A Different Region or Segment?
Customize Now
Market Definition
- Agriculture, Fishing, and Forestry (AFF) - This end user industry segment captures the external (outsourced) logistics expenditure incurred by the AFF industry players. The end user players considered are the establishments primarily engaged in growing crops, raising animals, harvesting timber, harvesting fish & other animals from their natural habitats and providing related support activities. Herein, Logistics Service Providers (LSPs) play a crucial role in acquisition, storage, handling, transportation, and distribution activities for the optimal & continuous flow of inputs (seeds, pesticides, fertilizers, equipment, and water) from manufacturers or suppliers to the producers and smooth flow of output (produce, agro-goods) to distributors/ consumers. This includes both termperature controlled and non-temperature controlled logistics, as and when required according to the shelf life of goods being transported or stored.
- Construction - This end user industry segment captures the external (outsourced) logistics expenditure incurred by the construction industry players. The end user players considered are the establishments primarily engaged in constructing, repairing and renovating residential & commercial buildings, infrastructure, engineering works, subdividing and developing land. Logistics Service Providers (LSPs) play a crucial role in increasing profitability of construction projects by maintaing the inventory of raw materials & equipment, time-critical supplies and by providing other value added services for effective project management.
- Courier, Express, and Parcel - The Courier, Express, and Parcel services, often called as CEP Market, refers to the logistics and postal service providers which specialize in moving small goods (parcels/packages). It captures the overall market size (USD) and market volume (number of parcels) of (1) the shipments/parcels/packages which are under 70kgs/ 154lbs weight, (2) Business Customer packages viz. Business-to-Business (B2B) & Business-to-Consumer (B2C) as well as private customer packages (C2C), (3) non-express parcel delivery services (Standard and Deferred) as well as express parcel delivery services (Day-Definite-Express and Time-Definite-Express), (4) domestic as well as international parcels.
- Demographics - To analyse total addressable market demand, population growth & forecasts have been studied and presented in this industry trend. It represents population distribution across categories like gender (male/female), development area (urban/rural), major cities among other key parameters like population density and final consumption expenditure (growth and share % of GDP). This data has been used for assessing the fluctations in demand & consumption expenditure, and the major hotspots (cities) of potential demand.
- Export Trends and Import Trends - Overall logistics performance of an economy is positively and significantly (statistically) correlated to its trade performance (exports and imports). Hence, in this industry trend, total value of trade, major commodities/ commodity groups and the major trade partners, for the studied geography (country or region as per the scope of report) have been analysed alongside the impact of major trade/logistics infrastructure investments & regulatory environment.
- Freight Forwarding - Freight forwarding which herein refers to the freight transportation arrangement (FTA) industry includes establishments primarily engaged in arranging & tracking transportation of freight between shippers and carriers. Logistics Service Providers (LSPs) considered are freight forwarders, NVOCCs, custom brokers and marine shipping agents. Others segment under Freight Forwarding captures the revenue earned through value added services of FTA like custom brokerage/clearance activities, preparation of freight related documentation, consolidation-deconsolidation of goods, cargo insurance & compliance, arrangement of warehousing & storage, liasing with shippers, and freight forwarding through other modes of transport viz. road and rail.
- Freight Pricing Trends - Freight pricing by mode of transport (USD/tonkm), over the review period, has been presented in this industry trend. The data has been used in assessing the inflationary environment, impact on trade, freight turnover (tonkm), freight and logistics market demand by mode of transport segments and hence the overall freight and logistics market size.
- Freight Tonnage Trends - Freight tonnage (weight of goods in tons) handled by mode of transport, over the review period, has been presented in this industry trend. The data has been used as one of the parameters apart from average distance per shipment (km), freight volume (tonkm), and freight pricing (USD/tonkm) to assess the freight transport market size.
- Freight Transport - Freight Transport refers to the hiring of a logistics service provider (outsourced logistics) for the transport of commodities (raw materials/final/intermediate/finished goods including both solids and fluids) from the origin to a destination within the country (domestic) or cross-border (international).
- Freight and Logistics - External expenditure on (or outsourced) facilitation of freight transport (freight transportation), arrangement of freight transport through an agent (freight forwarding), warehousing and storage (temperature controlled or non-temperature controlled), CEP (domestic or international courier, express and parcel) and other value-added logistics services involved in the transportation of commodities (raw materials or finished goods including both solids and fluids) from the origin to a destination within the country (domestic) or cross-border (international), through one or more modes of transportation viz. road, rail, sea, air and pipelines constitute freight and logistics market.
- Fuel Price - Fuel price spikes can cause delays and diruption for logistics service providers (LSPs), while drops in the same can result in higher short-term profitability and increased market rivalry to offer consumers with the best deals. Hence, the fuel price variations have been studied over the review period and presented along with the causes as well as market impacts.
- GDP Distribution by Economic Activity - Nominal Gross Domestic Product and distribution of the same, across major economic sectors in the geography studied (country or region as per scope of the report) have been studied and presented in this industry trend. As GDP is positively related to the profitability and growth of logistics industry, this data has been used in adjunction to the input-output tables/ supply-use tables for analyzing the potential major contributing sectors towards the logistics demand.
- GDP Growth by Economic Activity - Growth of Nominal Gross Domestic Product across major economic sectors, for the geography studied (country or region as per scope of the report) have been presented in this industry trend. This data has been utilized for assessing the growth of logistics demand from all the market end users (economic sectors considered here).
- Inflation - Variations in both Wholesale Price Inflation (YoY change in producer price index) and Consumer Price Inflation have been presented in this industry trend. This data has been used to assess the inflationary environment as it plays a vital role in smooth functioning of the supply chain, directly impacting the logistics operational cost components e.g., pricing of tyres, driver wages & benefits, energy/fuel prices, maintenace costs, toll charges, warehousing rents, custom brokerage, forwarding rates, courier rates etc. hence impacting the overall freight and logistics market.
- Infrastructure - As infrastructure plays a vital role in an economy's logistics performance, variables like length of roads, distribution of road length by surface category (paved v/s unpaved), distribution of road length by road classification (expressways v/s highways v/s other roads), rail length, volume of containers handled by major ports and tonnage handled by major airports have been analysed and presented in this industry trend.
- Key Industry Trends - The report section named "Key Industry Trends" include all the key variables/parameters studied to better analyze the market size estimates and forecasts. All the trends have been presented in the form of data points (time series or latest available data points) along with analysis of the paramter in the form of concise market relevant commentary, for the geography studied (country or region as per the scope of report).
- Key Strategic Moves - The action taken by a company to differentiate from its competitor or used as a general strategy is referred to as a key strategic move (KSM). This includes (1) Agreements (2) Expansions (3) Financial Restructuring (4) Mergers and Acquisitions (5) Partnerships, and (6) Product Innovations. Key players (Logistics Service Providers, LSPs) in the market have been shortlisted, their KSM have been studied and presented in this section.
- Liner Shipping Bilateral Connectivity Index - It indicates a country pair's integration level into global liner shipping networks and plays a crucial role in determining bilateral trade, which in turn potentially contributes toward the prosperity of a country and its surrounding region. Hence the major economies connected to the country/ region as per scope of the report, have been analyzed and presented in "Liner Shipping Connectivity" industry trend.
- Liner Shipping Connectivity - This industry trend analyses the state of connectivity to the global shipping networks based on the status of maritime transport sector. It includes the analysis of liner shipping connectivity, bilateral shipping connectivity, and port liner shipping connectivity indices for the geography (country/ region as per scope of the report) over the review period.
- Liner Shipping Connectivity Index - It indicates how well countries are connected to global shipping networks based on the status of their maritime transport sector. It is based on five components of the maritime transport sector: (1) The number of shipping lines servicing a country, (2) The size of the largest vessel used on these services (in TEUs), (3) The number of services connecting a country to the other countries, (4) The total number of vessels deployed in a country, (5) The total capacity of those vessels (in TEUs).
- Logistics Performance - Logistics Performance and Logistics Costs are the backbone of trade, and influences trade costs, making countries compete globally. Logistics performance is influenced by market wide adopted supply chain management strategies, government services, investments & policies, fuel/ energy costs, inflationary environment etc. Hence, in this industry trend, the logistics performance of the geography studied (country/ region as per the scope of report) has been analysed and presented over the review period.
- Major Truck Suppliers - Market share of truck brands is influenced by factors like geographical preferences, portfolio of truck types, truck prices, local production, truck repair & maintenance service peneteration, customer support, technological innovations (like electric vehicles, digitalization, autonomous trucks), fuel efficiency, financing options, annual maintenance costs, availability of substitutes, marketing startegies etc. Hence, the distribution (share % for base year of the study) of truck sales volume for leading truck brands and commentary on current market scenario & market anticipation over the forecast period have been presented in this industry trend.
- Manufacturing - This end user industry segment captures the external (outsourced) logistics expenditure incurred by the Manufacturing industry players. The end user players considered are the establishments primarily engaged in the chemical, mechanical or physical transformation of materials or substances into new products. Logistics Service Providers (LSPs) play a crucial role in maintaining a smooth flow of raw materials across the supply chain, enabling timely delivery of finished goods to distributors or end customers and storing & supplying the raw materials to clients for just-in-time manufacturing.
- Maritime Fleet Load Carrying Capacity - Maritime fleet load carrying capacity depicts the development state of an economy's maritime infrastructure & trade. It is influenced by factors like volume of production, international trade, major end user industries, maritime connectivity, environmental regulations, investments in port infrastructure development, port container cargo handling capacity etc. This industry trend represents the maritime fleet load carrying capacity by type of ship viz. container ships, oil tankers, bulk carriers, general cargo, among other types alongwith the influencing factors for the geography studied (country/ region as per scope of the report), over the review period.
- Modal Share - Freight Modal Share is influenced by factors like modal productivity, government regulations, containerization, distance of shipment, temperature control requirements, type of goods, international trade, terrain, speed of delivery, shipment weight, bulk shipments, etc. Also, modal share by tonnage (tons) and modal share by freight turnover (ton-km) differ as per average distance of shipments, weight of major commodity groups transported in the economy and number of trips. This industry trend represents the distribution of freight transported by mode of transport (tons as well as ton-km), for the study base year.
- Oil and Gas, Mining and Quarrying - This end user industry segment captures the external (outsourced) logistics expenditure incurred by the extraction industry players. The end user players considered are the establishments that extract naturally occurring mineral solids, such as coal and ores; liquid minerals, such as crude petroleum; and gases, such as natural gas. Logistics Service Providers (LSPs) covers entire phases from upstream to downstream and plays a crucial role in the transportation of machinery, drilling equipments, extracted minerals, crude oil & natural gas and refined/ processed products from one place to another.
- Other End Users - Other end user segment captures the external (outsourced) logistics expenditure incurred by the financial services (BFSI), real estate, educational services, healthcare, and professional services (administrative, waste management, legal, architectural, engineering, design, consulting, scientific R&D). Logistics Service Providers (LSPs) plays a crucial role in the reliable movement of supplies and documents to/from these industries such as transporting any equipment or resources required, shipping confidential documents and files, movement of medical goods & supplies (surgical supplies and instruments, including gloves, masks, syringes, equipment) to name a few.
- Other Services - Other Services segment captures revenue earned through (1) Value added services (VAS) for freight transportation by road, rail, air and sea & inland waterways, (2) VAS for marine cargo transportation (operation of terminal facilities such as harbours and piers, operation of waterway locks, navigation, pilotage and berthing activities, lighterage, salvage activities, lighthouse activities, among other miscellaneous support activities), (3) VAS for land freight transportation (operation of terminal facilities such as railway stations, stations for the handling of goods, operation of railroad infrastructure, switching and shunting, towing and road side assistance, liquefaction of gas for transportation purposes, among other miscellaneous support activities), (4) VAS for air cargo transportation (operation of terminal facilities such as airway terminals, airport and air-traffic-control activities, ground service activities on airfields, runway maintenance, inspection/ ferrying/ maintenance/ testing of aircrafts, aircraft fuelling services, among other miscellaneous support activities), (5) VAS for warehousing and storage service (operation of grain silos, general merchandise warehouses, refrigerated warehouses, storage tanks etc., storage of goods in foreign trade zones, blast freezing, crating goods for shipping, packing and preparing goods for shipping, labelling and/or imprinting the package, kit assembling and packaging services, among other miscellaneous support activities), and (6) VAS for courier, express and parcel service (pickup, sorting).
- Port Calls and Performance - The performance of ports is key to an economy's freight movement, trade, global connectivity, successful growth strategies, investment attractiveness for production & distribution systems, and thus affects GDP, employment, per capita income and industrial growth. Hence, the port perfomance parameters like median time spent by vessels in the ports; average age, size, cargo carrying capacity, container carrying capacity, of vessels entering the ports, port calls, and container port throughput have been analysed and presented in this industry trend.
- Port Liner Shipping Connectivity Index - It reflects a port's position in the global liner shipping network, wherein a higher value of index is associated with better connectivity. Efficient and well-connected ports (1) contribute towards minimizing transport costs, linking supply chains and supporting international trade, (2) pave the way for economies of scale and development of expertise by permitting producers to better exploit possibilities in domestic as well as foreign markets. Hence the major ports of strategic importance, in the country/ region as per scope of the report, have been analyzed and presented in "Liner Shipping Connectivity" industry trend.
- Port Throughput - It reflects the amount of cargo or number of vessels a port handles annually. It can be related to (1) cargo tonnage, (2) container TEU, and (3) vessel calls. Port throughput in terms of total containers handled (TEU's), has been presented in the "Port Calls and Performance" industry trend.
- Producer Price Inflation - It indicates inflation from viewpoint of the producers viz. the average selling price received for their output over a period of time. Annual change (YoY) of producer price index is reported as wholesale price inflation in the "Inflation" industry trend. As WPI captures dynamic price movements in most comprehensive way, it is widely used by governments, banks, industry, business circles and is deemed important in formulation of trade, fiscal and other economic policies. The data has been used in adjunction to consumer price inflation for better understanding the inflationary environment.
- Segmental Revenue - Segmental Revenue has been triangulated or computed and presented for all the major players in the market. It refers to the freight and logistics market specific revenue earned by the company, over the base year of study, in the geography studied (country or region as per the scope of report). It is computed through the study and analysis of major parameters like financials, service portfolio, employee strength, fleet size, investments, number of countries present in, major economies of concern, etc. that have been reported by the company in its annual reports, webpage. For companies having scarce financial disclosures, paid databases like D&B Hoovers, Dow Jones Factiva have been resorted to and verified through industry/expert interactions.
- Transport and Storage Sector GDP - Value and growth of Transport and Storage Sector GDP has a direct relation to the freight and logistics market size. Hence, this variable has been studied and presented over the review period, in value terms (USD) and as share % of total GDP, in this industry trend. The data has been supported by concise and relevant commentary around the investments, developments, and current market scenario.
- Trends in E-Commerce Industry - Enhanced internet connectivity and boom in smartphone penetration, coupled with increasing disposable incomes, has led to a phenomenal growth in the e-commerce market globally. Online shoppers require fast and efficient delivery of their orders leading to an increase in the demand for logistics services especially e-commerce fulfilment services. Hence, the Gross Merchandise Value (GMV), historial and projected growth, breakup of major commodity groups in e-commerce industry for the studied geography (country or region as per scope of the report) have been analysed and presented in this industry trend.
- Trends in Manufacturing Industry - Manufacturing industry involves the transformation of raw materials into finished products, while logistics industry ensures the efficient flow of raw materials to the factory, and the transport of manufactured products to the distributors & consumers. Demand-Supply of both industries are highly cross-linked and critical for a seamless supply chain. Hence, the Gross Value Added (GVA), breakup of GVA into major manufacturing sectors, and growth of manufacturing industry over the review period have been analysed and presented, in this industry trend.
- Trucking Fleet Size By Type - Market share of truck types is influenced by factors like geographical preferences, major end user industries, truck prices, local production, truck repair & maintenance service peneteration, customer support, technological disruptions (like electric vehicles, digitalization, autonomous trucks) etc. Hence, the distribution (share % for base year of study) of truck parc volume by type of truck, market disruptors, truck manufacturing investments, truck specifications, truck use & import regulations, and market anticipation over the forecast period have been presented in this industry trend.
- Trucking Operational Costs - The prime reasons for measuring/ benchmarking logistics performance of any trucking company are to reduce operational costs and increase profitability. On the other hand, measuring operational costs helps to identify whether and where to make operational changes to control expenses and identify areas for improved performance. Hence, in this industry trend, trucking operational costs and the variables involved viz. driver wages & benefits, fuel prices, repairs & maintenance costs, tyre costs etc. have been studied over the base year of study, and presented for the geography studied (country or region as per the scope of report).
- Warehousing and Storage - Warehousing and storage segment captures revenue earned through the operation of general merchandise, refrigerated and other types of warehousing & storage facilities. These establishments take responsibility for storing the goods and keeping them secure in lieu of charges. Value added services (VAS) they may provide are considered to be a part of the "other services" segment. Here VAS refer to a range of services, related to the distribution of a customer's goods and can include labelling, breaking bulk, inventory control & management, light assembly, order entry & fulfillment, packaging, pick & pack, price marking & ticketing and transportation arrangement.
- Wholesale and Retail Trade - This end user industry segment captures the external (outsourced) logistics expenditure incurred by the wholesalers and retailers. The end user players considered are the establishments primarily engaged in wholesaling or retailing merchandise, generally without transformation, and rendering services incidental to the sale of merchandise. Logistics Service Providers (LSPs) plays a crucial role in the reliable movement of supplies to and finished products from production houses to the distributors and finally to the end customer covering activites like material sourcing, transportation, order fulfillment, warehousing & storage, demand forecasting, inventory management etc.
| Keyword | Definition |
|---|---|
| Axle Load | The axle load of a wheeled vehicle is the total weight bearing on the roadway for all wheels connected to a given axle. |
| Back Haul | Backhaul is the return movement of a transport vehicle from its original destination to its original point of departure. |
| Bill of Lading | A bill of lading is a legal document issued by a carrier to a shipper that details the type, quantity, and destination of the goods being carried. |
| Bunkering | Bunkering is the process of supplying fuel and/or gasoil to be used to power the propulsion system of a ship (such fuel is referred to as bunker). It includes the logistics of loading and distributing the fuel among available shipboard tanks. A person dealing in trade of bunker (fuel) is called a bunker trader. |
| Bunkering Service | Bunkering service is the supply of a requested quality and quantity of bunkers to a ship. |
| C-commerce | C-commerce (Collaborative commerce) describes electronically enabled business interactions among an enterprise’s internal personnel, business partners and customers throughout a trading community. The trading community could be an industry, industry segment, supply chain or supply chain segment. |
| Cabotage | Transport by a vehicle registered in a country performed on the national territory of another country. |
| Cartage Agent | A ground transportation service that provides pickup and delivery of freight in locations not served directly by an air or ocean carrier. |
| Contract logistics | Contract logistics refers to the outsourcing of resource management tasks by one company to a third-party company specializing in logistical matters, such as transportation, warehousing, and order fulfillment. |
| Courier | A business that is used to send messages, packages, etc. Courier service refers to the fast or quick, door to door pickup and delivery service for goods or documents. It can be local or international. A company that provides such delivery services is called a courier company. A courier company hires people to provide their services. Such a person hired by the courier service company is called a courier. |
| Cross docking | Cross docking is a practice in logistics management that includes unloading incoming delivery vehicles and loading the materials directly into outbound delivery vehicles, omitting traditional warehouse logistical practices and saving time and money. |
| Cross Trade | International transport between two different countries performed by a vehicle registered in a third country. A third country is a country other than the country of loading/embarkation and than the country of unloading/disembarkation. |
| Customs Clearance | The procedures involved in getting cargo released by Customs through designated formalities such as presenting import license/permit, payment of import duties and other required documentations by the nature of the cargo such as FCC or FDA approval. |
| Customs seal | Customs seal means a seal, stamp or any other preventive means affixed by customs officials to ensure the inviolability of goods, commercial means of transport or warehouses. |
| Dangerous Goods | Dangerous goods (or hazardous materials or HAZMAT) include flammable liquids/solids, gases, compressed, liquified, dissolved under pressure, corrosives, oxidising substances, explosive substances and articles, substances, which on contact with water, emit flammable gasses, organic peroxides, toxic substances, infectious substances, radioactive materials, miscellaneous dangerous goods and articles. |
| Direct Shipment | Direct shipment is a method of delivering goods from the supplier or the product owner to the customer directly. In most cases, the customer orders the goods from the product owner. This delivery scheme reduces transportation and storage costs, but requires additional planning and administration. |
| Drayage | A drayage is a form of trucking service that connects the different modes of shipping (intermodal), such as ocean freight or air freight. It’s a short-haul trip that transports goods from one place to another, usually before or after its long-haul shipping process. Drayage trucks move cargo to and from various destinations, such as container ships, storage lots, order fulfillment warehouses, and rail yards. Typically, drayage only transports goods in short distances and operates only in one metropolitan area. It also requires only one trucker in a single shift. |
| Dry Docking | Dry docking is a term used for repairs or when a ship is taken to the service yard. During dry docking, the whole ship is brought to a dry land so that the submerged portions of the hull can be cleaned or inspected. |
| Dry van | A dry van is a type of semi-trailer that's fully enclosed to protect shipments from outside elements. Designed to carry palletized, boxed or loose freight, dry vans aren't temperature-controlled (unlike refrigerated “reefer” units) and can't carry oversized shipments (unlike flatbed trailers). |
| Feedering | Transport service whereby loaded or empty containers in a regional are transferred to a “mother ship” for a long-haul ocean voyage. |
| Final Demand | Final demand includes all types of commodities (goods as well as services) consumed as final use and might include personal consumption, or consumption by government, by businesses as capital investment, and as exports. includes all types of commodities (goods as well as services) consumed as final use and might include personal consumption, or consumption by government, by businesses as capital investment, and as exports. |
| First mile Delivery | First mile delivery refers to the first stage of the transportation. This is when the parcel leaves the seller’s warehouse and is taken by the courier pick up agent to process it or take it to the warehouse. Once the package reaches the post office or the courier’s hub, it is then sorted and transported further until it reaches the customer’s doorstep. |
| Fiscal storage services | It means a facility, clearly separated from other premises, where the excise goods are produced, processed, held, received or dispatched under a duty suspension arrangement by an authorized depositor, in the course of his business, under conditions laid down by the customs authorities. |
| Flat Bed | It has a back body that is flatly shaped for easy loading and unloading of goods. The flatbed truck is mostly used to transport heavy, oversized, wide and indelicate goods. |
| Flatbed Truck | A flatbed truck is a type of truck with rigid design. It has a back body that is flatly shaped for easy loading and unloading of goods. The flatbed truck is mostly used to transport heavy, oversized, wide and indelicate goods such as machinery, building supplies or equipment. Due to the truck open body, the goods transported with it must not be vulnerable to rain. By functionality, the flatbed truck is comparable to a flatbed trailer. |
| Freight Transit Time | Transit time is how long it takes for a shipment to be delivered to its final destination after being picked up from a designated pick up point. |
| Halal Logistics | It refers to the process of managing the logistics operations such as fleet management, storage/warehousing, and materials handling according to the principles of Shariah law in ensuring the integrity of the halal products at the point of consumption. |
| Haulage | The commercial transport of goods. |
| Inbound Logistics | Inbound logistics is the way materials and other goods are brought into a company. This process includes the steps to order, receive, store, transport and manage incoming supplies. Inbound logistics focuses on the supply part of the supply-demand equation. |
| Intermediate Demand | Intermediate demand includes goods, services, and maintenance and repair construction sold to businesses, excluding capital investment. |
| International Loaded | Place of loading of goods in reporting country (i.e., country in which the vehicle performing the transport is registered) and place of unloading in a different country. |
| International Unloaded | Place of unloading of goods in reporting country (i.e., country in which the vehicle performing the transport is registered) and place of loading in a different country. |
| Last Mile Delivery | Last mile delivery refers to the very last step of the delivery process when a parcel is moved from a transportation hub to its final destination—which, usually, is a personal residence or retail store. |
| Less than-Truck-Load (LTL) | Less-than-truckload, also known as less-than-load (LTL), is a shipping service for relatively small loads or quantities of freight. An LTL provider combines the loads and shipping requirements of several different companies on their trucks, using a hub-and-spoke system to get goods to their destinations. |
| Locomotives Haluage | The transport of coal, ore, workers, and materials underground by means of locomotive-hauled mine cars. The locomotive may be powered by battery, diesel, compressed air, trolley, or some combination such as battery-trolley or trolley-cable reel. |
| Milkrun | A Milk Run is a delivery method used to transport mixed loads from various suppliers to one customer. Instead of each supplier sending a truck every week to meet the needs of one customer, one truck (or vehicle) visits the suppliers to pick up the loads for that customer. This method of transport got its name from the dairy industry practice, where one tanker used to collect milk from several dairy farms for delivery to a milk processing company. |
| Multi country consolidation | Multi-Country Consolidation (MCC) is a cost-effective solution that consolidates ones cargo from different countries of origin to build Full Container Loads (FCL). MCC is most suitable for companies that import light volumes of goods from multiple countries but want to take advantage of the more economic FCL freight rates. |
| Multi-Modal Logistics | Multimodal transportation or multimodal shipping refers to logistics and freight processes that require multiple modes of transportation. |
| Omni Channel Logistics | Omnichannel distribution is a multichannel approach taken by companies to give customers a way to purchase and receive orders from several sales channels with one-touch seamless integration. Some of the ways include- 1. Buy online, then pick-up at the brick and mortar store; 2. Buy online, then have it delivered to the home or another location; 3.In store purchase, with the delivery either to the home or another location; 4. Drop ship from a warehouse or manufacturing center to store, home or other location; 5.Buy online, then return at store or online; 6. Buy online, then return online. |
| OOG cargo | Out of Gauge (OOG) cargo is any cargo that can not be loaded into six-sided shipping containers simply because it is too large. The term is a very loose classification of all cargo with dimensions beyond the maximum 40HC container dimensions. That is a length beyond 12.05 meters – a width beyond 2.33 meters – or a height beyond 2.59 meters. |
| Other ships | Other ships include: Liquefied petroleum gas carriers, liquefied natural gas carriers, parcel (chemical) tankers, specialized tankers, reefers, offshore supply vessels, tugboats, dredgers, cruise, ferries, other non-cargo ships |
| Other Specialised Cargo | Other specialised goods include pre-slung goods (Goods, one or more items, supplied with a sling or slings), mobile units (Mobile Self Propelled Units, Non Self Propelled Units, unrolled vehicles), oversized equipment load (light and heavy machinery that is often too big or too heavy), high value freight that needs extra protection like electronics, financial services road freight. |
| Outsourced Freight Transport | Transport for hire or reward; The carriage for remuneration of goods. |
| Pallets | Raised platform, intended to facilitate the lifting and stacking of goods. |
| Part load | A part load describes goods which only fills a truck partially. In essence, the quantity of the shipment is bigger than the Less Than Truckload (LTL) shipment. Also, the shipment cannot fully occupy a truck i.e. its capacity is much lower than a Full Truckload (FTL) shipment. |
| Paved Road | Road surfaced with crushed stone (macadam) with hydrocarbon binder or bituminized agents, with concrete or with cobblestone. |
| Q-commerce | Q-commerce, also referred to as quick commerce, is a type of e-commerce where emphasis is on quick deliveries, typically in less than an hour. |
| Quay | A stone or metal platform lying alongside or projecting into water for loading and unloading ships. |
| Recommerce | Recommerce is the selling of previously owned items through online marketplaces to buyers who reuse, recycle or resell them. |
| ReverseLogistics | Reverse logistics is a type of supply chain management that moves goods from customers back to the sellers or manufacturers. |
| Road Freight Transport Service | Hiring a trucking agency for transport of commodities (raw materials or manufactured goods including both solids and liquids) form the origin to a destination within the country (domestic) or cross-border (international) constitutes road freight transport market. The service might be Full-Truck-Load or Less than-Truck-Load, containerized or non-containerized, temperature controlled or non temperature controlled, short haul or long haul. |
| Roll-on/roll-off cargo | Roll-on/roll-off (RORO or ro-ro) ships are cargo ships designed to carry wheeled cargo, such as cars, motorcycles, trucks, semi-trailer trucks, buses, trailers, and railroad cars, that are driven on and off the ship on their own wheels or using a platform vehicle, such as a self-propelled modular transporter. |
| Swap bodies | A swap body, swop body, exchangeable container or interchangeable unit, is one of the types of standard freight containers for road and rail transport. |
| Tank Barge | A non-self-propelled vessel constructed or adapted primarily to carry liquid, solid or gaseous commodities or cargos in bulk in cargo spaces (or tanks) through rivers and inland waterways, and may occasionally carry commodities or cargos through oceans and seas when in transit from one inland waterway to another. The commodities or cargos transported are in direct contact with the tank interior. |
| Tautliner vehicle | Tautliner and curtainsider are used as generic names for curtain sided trucks/trailers. The curtains are permanently fixed to a runner at the top and detachable rails/poles at front and rear, allowing the curtains to be drawn open and forklifts used all along the sides for easy and efficient loading and unloading. When closed for travel, vertical load restraint straps are attached to a rope rail beneath the truck bed, connecting the truck bed and curtain along both sides. Winches at either end of the curtain tension it, hence the 'Tautliner' name. This stops the curtain from flapping or drumming in the wind and can also help retain light loads from slipping sideways. |
| Transloading | Transloading is a shipping term that refers to the transfer of goods from one mode of transportation to another en route to their ultimate destination. |
| Tsubo | A Japanese unit of area equal to 35.58 square feet. |
| Unpaved Road | Road with a stabilized base not surfaced with crushed stone, hydrocarbon binder or bituminized agents, concrete or cobblestone. |
| Vessel Husbandry Services | It includes ship maintenance, repairs, cleaning, upkeep of the hull and rigging and equipment. |
Need More Details on Market Definition?
Ask a Question
Research Methodology
Mordor Intelligence follows a four-step methodology in all our reports.
- Step-1: Identify Key Variables: In order to build a robust forecasting methodology, the variables and factors identified in Step-1 are tested against available historical market numbers. Through an iterative process, the variables required for market forecast are set and the model is built on the basis of these variables.
- Step-2: Build a Market Model: Market-size estimations for the forecast years are in nominal terms. Inflation is not a part of the pricing, and the average selling price (ASP) is kept constant throughout the forecast period for each country.
- Step-3: Validate and Finalize: In this important step, all market numbers, variables and analyst calls are validated through an extensive network of primary research experts from the market studied. The respondents are selected across levels and functions to generate a holistic picture of the market studied.
- Step-4: Research Outputs: Syndicated Reports, Custom Consulting Assignments, Databases & Subscription Platforms

Get More Details On Research Methodology
Download PDF


