Nigeria Data Center Market Size and Share
Market Overview
| Study Period | 2020 - 2031 |
|---|---|
| Forecast Data Period | 2026 - 2031 |
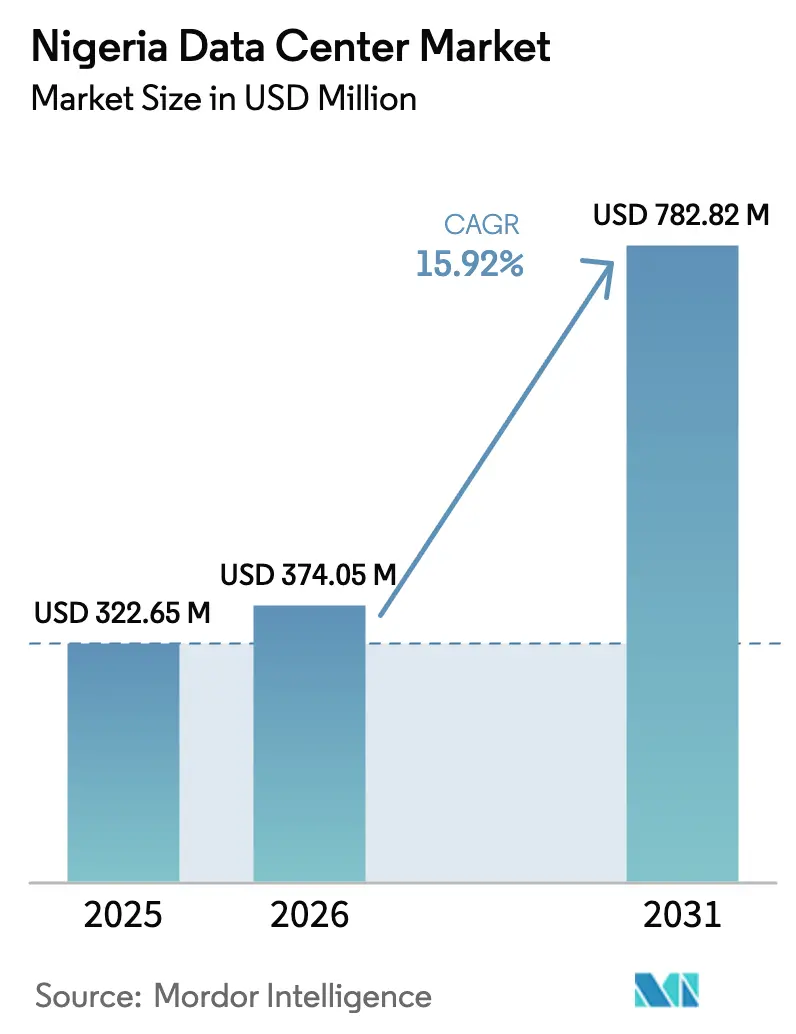
| Base Year Market Size (2025) | USD 322.65 Million |
| Market Size (2026) | USD 374.05 Million |
| Market Size (2031) | USD 782.82 Million |
| Growth Rate (2026 - 2031) | 15.92% CAGR |
| Market Concentration | Medium |
Major Players *Disclaimer: Major Players sorted in no particular order Image © Mordor Intelligence. Reuse requires attribution under CC BY 4.0. | |
Nigeria Data Center Market Analysis by Mordor Intelligence
The Nigeria data center market size is expected to grow from USD 322.65 million in 2025 to USD 374.05 million in 2026 and is forecast to reach USD 782.82 million by 2031 at 15.92% CAGR over 2026-2031. In terms of IT load capacity, the market is expected to grow from 209.10 MW in 2025 to 317.40 MW by 2030, at a CAGR of 8.69% during the forecast period (2025-2030). The market segment shares and estimates are calculated and reported in terms of MW. This expansion is underpinned by accelerating cloud adoption, new international cable capacity, and regulatory data-residency mandates, which together position the Nigerian data center market at the heart of West Africa’s digital economy. Continuing smartphone proliferation, rising 5G coverage, and the launch of Google’s Equiano and Meta’s 2Africa submarine cables have sharply lowered latency and bandwidth costs, tilting hosting economics in favor of local facilities. Colocation demand is on the rise as enterprises seek shared infrastructure that addresses Nigeria’s persistent 41% grid availability challenge. Meanwhile, hyperscalers and telecom operators are rolling out Tier III and Tier IV sites to capture enterprise cloud migration and government e-governance spending, signaling the evolution of the Nigeria data center market toward large-scale cloud services.
Key Report Takeaways
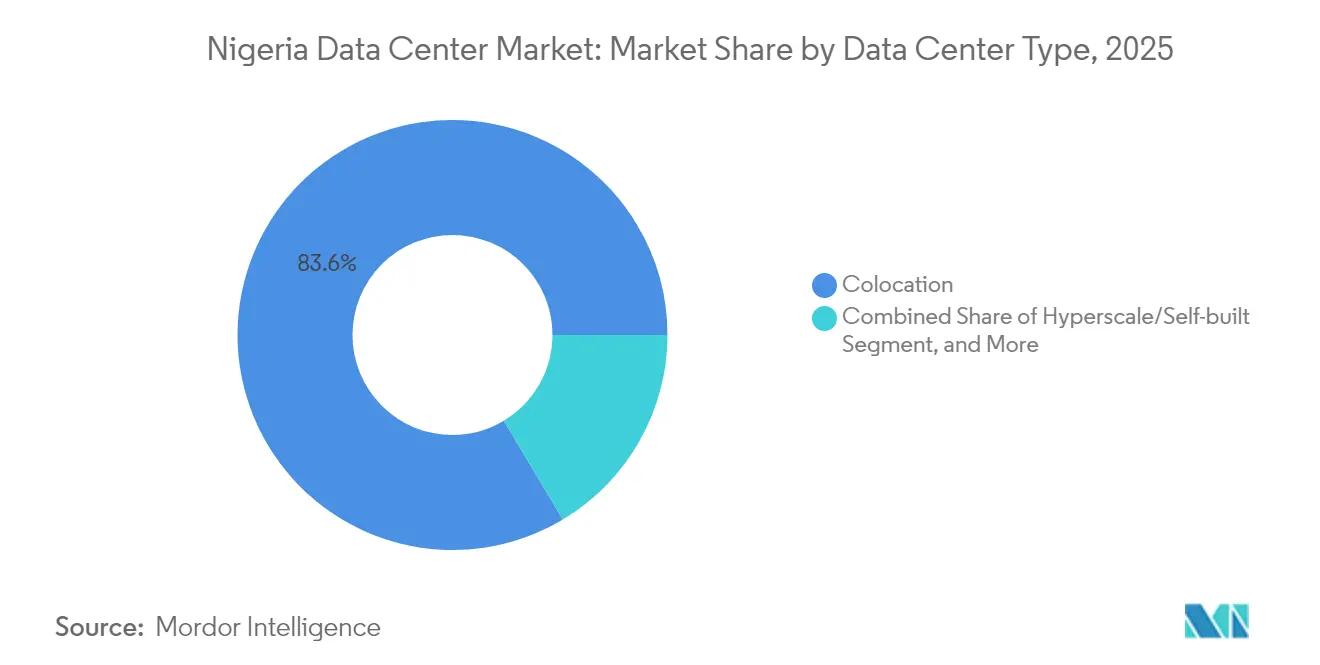
- By data center type, colocation facilities led the Nigeria data center market with an 83.58% share in 2025, while hyperscale and self-built sites are poised for the fastest growth, with a 25.41% CAGR through 2031.
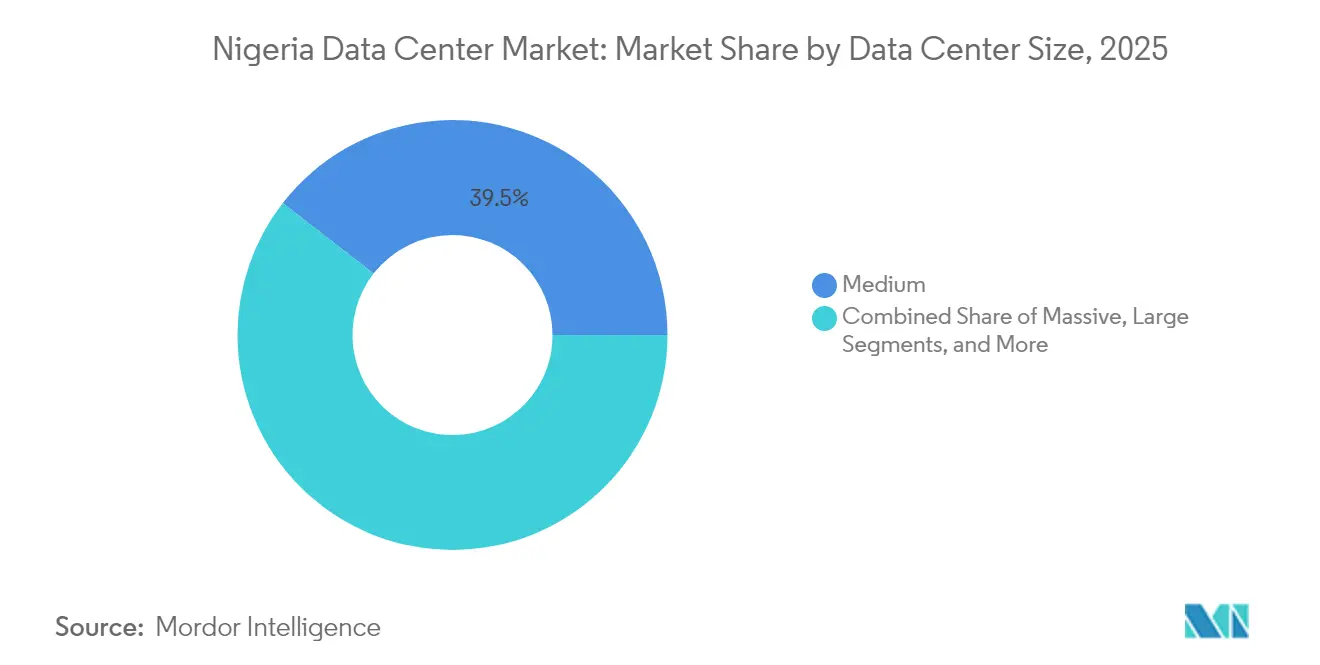
- By data center size, medium facilities captured 39.48% of Nigeria's data center market share in 2025; large facilities are projected to advance at a 31.93% CAGR to 2031.
- By tier, Tier III sites accounted for 98.20% of the Nigerian data center market size in 2025, whereas Tier IV is the fastest-growing tier, with a 97.01% CAGR through 2031.
- By end user, the IT and telecom segment contributed 18.22% of market revenue in 2025, while BFSI is set to record the highest 8.83% CAGR to 2031.
- By hotspot, Lagos held 29.72% of Nigeria's data center market share in 2025; the city is forecast to expand at a 11.34% CAGR through 2031.
Note: Market size and forecast figures in this report are generated using Mordor Intelligence’s proprietary estimation framework, updated with the latest available data and insights as of 2026.
Nigeria Data Center Market Trends and Insights
Drivers Impact Analysis*
| Driver | (~) % Impact on CAGR Forecast | Geographic Relevance | Impact Timeline |
|---|---|---|---|
| Smartphone penetration and data usage boom | +3.2% | National, concentrated in Lagos and Abuja | Medium term (2-4 years) |
| New Equiano and 2Africa subsea cable capacity | +2.8% | Lagos primary, spillover to the national backbone | Short term (≤ 2 years) |
| Accelerating enterprise cloud adoption | +2.5% | Lagos and Abuja core, expanding to secondary cities | Medium term (2-4 years) |
| Data localisation directives (NITDA guidelines) | +2.1% | National, with an enforcement focus on major enterprises | Long term (≥ 4 years) |
| Nollywood streaming exports driving edge demand | +1.8% | Lagos primary, Port Harcourt, and Abuja secondary | Medium term (2-4 years) |
| Renewable-energy incentives for on-site power | +1.4% | National, with pilot programs in Lagos and Abuja | Long term (≥ 4 years) |
| Source: Mordor Intelligence | |||


Smartphone Penetration and Data Usage Boom
Nigeria counted 217.5 million mobile subscribers in 2025, and median mobile download speeds reached 95.62 Mbps as 5G coverage grew from 17.2% in early 2023 to 35.7% by mid-2024.[1]Karim Yaici, “5G is Contributing to Improving MTN’s Network Performance in West and Central Africa,” Ookla, ookla.com MTN Nigeria’s pledge to invest USD 3.5 billion over five years affirms sustained traffic growth and a strengthening addressable base for edge workloads. High-bandwidth applications such as video streaming, mobile gaming, and social media are shaping user expectations for low-latency experiences, compelling operators to deploy distributed nodes in proximity to key demand centers. These dynamics intensify utilization rates at existing facilities and spur greenfield builds, keeping the Nigeria data center market firmly on a double-digit growth path. The pervasive mobile paradigm also draws content platforms and CDNs toward Lagos and Abuja, reinforcing the virtuous cycle of capacity demand and infrastructure investment.
Equiano and 2Africa Subsea Cable Capacity
Google’s Equiano cable landing in Lagos and Meta’s 2Africa dual landings in Lagos and Akwa Ibom collectively add multi-terabit capacity, delivering roughly 20 times the throughput of earlier systems. Flexible fiber-pair switching enables dynamic bandwidth allocation, resulting in reduced backhaul costs and latency compared to offshore hosting. The March 2024 West Africa subsea outage, which cost Nigeria more than USD 590 million in four days, underscored the value of cable redundancy. Immediate benefits include cheaper transit for cloud providers, stronger economics for local content caching, and greater appeal to multinational enterprises evaluating in-country hosting. As additional branches light up, secondary cities gain higher-quality connectivity, seeding future regional data center nodes and diversifying the Nigerian data center market footprint.
Accelerating Enterprise Cloud Adoption
Nigerian enterprises are shifting core workloads off aging on-premises stacks to SaaS, PaaS, and IaaS models to optimize costs and speed innovation. United Bank for Africa’s USD 3 million contract with Huawei to modernize its cloud environment exemplifies a widening adoption curve in BFSI. The technology sector’s share of national GDP increased to 19.78% in Q2 2024, up from 17.89% in Q1 2024, indicating a rise in digitalization across various verticals. Hybrid architectures that pair public cloud with in-country colocation for latency-sensitive or regulated workloads drive incremental rack demand, while disaster-recovery mandates necessitate redundant sites. The Nigeria data center market thereby harnesses both native cloud growth and adjacent colocation services, widening revenue streams for operators with compliant, carrier-neutral footprints.
Data Localisation Directives
The Nigeria Data Protection Act 2023 and NITDA guidelines obligate organizations processing personal data of residents to retain sensitive information within national borders. Non-compliance fines such as the USD 358,580 penalty levied on Fidelity Bank in August 2024 signal strict enforcement. Regulated sectors, such as banking, telecom, and public administration, are consequently expanding their onshore server estates and demanding attested Tier III and Tier IV sites. Hyperscalers are responding with local cloud regions that integrate sovereign landing zones, while domestic players differentiate themselves through certifications that align with ISO 27001 and PCI-DSS. Over the long term, data-sovereignty stipulations lock in captive demand, underpinning sustained expansion of the Nigeria data center market.
Restraints Impact Analysis*
| Restraint | (~) % Impact on CAGR Forecast | Geographic Relevance | Impact Timeline |
|---|---|---|---|
| Grid unreliability and diesel dependency | -2.8% | National, acute in secondary cities | Long term (≥ 4 years) |
| Naira volatility and import tariffs | -1.9% | National, affecting equipment procurement | Short term (≤ 2 years) |
| Shortage of certified DC engineers | -1.5% | National, concentrated skills gap in Lagos | Medium term (2-4 years) |
| Patchy fibre in secondary cities | -1.2% | The rest of Nigeria, limiting regional expansion | Long term (≥ 4 years) |
| Source: Mordor Intelligence | |||
Grid Unreliability and Diesel Dependency
Nigeria’s grid delivered only 5,639 MW, compared to the 13,625 MW installed in 2025, which pulled reliability down to 41% and forced facilities to rely on costly diesel generation.[2]Aderemi Ogunbanjo, “2025 Power Sector Mid-Year Report,” Mondaq, mondaq.com Self-generated power averages USD 0.28-0.33 per kWh, roughly double the potential rates for compressed natural gas. Operators engineer N+1 to N+2 generator redundancy and maintain large on-site fuel reserves, raising both capex and opex. Frequency instability—recorded between 49.39 Hz and 50.91 Hz—threatens sensitive IT equipment, adding UPS oversizing expenses. Although hybrid solar-battery-diesel pilot plants are emerging, full-scale renewable transitions remain hampered by financing constraints. The combined burden trims investment appetites outside Lagos, weighing on the Nigeria data center market’s regional expansion potential.
Naira Volatility and Import Tariffs
Because precision HVAC, switchgear, and server hardware are predominantly imported, currency swings translate directly into higher capex. The removal of federal fuel subsidies in May 2023 sparked a 60% rise in diesel prices, compounding opex pressures. Exchange-rate uncertainty complicates long-horizon cash-flow models, deterring hyperscale builds that demand predictable input costs. Tariffs on power systems and construction materials further inflate budgets, prompting operators to stage capacity in modular increments rather than undertaking single mega-builds. Until macroeconomic stability improves, investment pacing will remain cautious, moderating short-term acceleration in the Nigerian data center market.
*Our forecasts treat driver/restraint impacts as directional, not additive. The impact forecasts reflect baseline growth, mix effects, and variable interactions.
Segment Analysis
By Data Center Size – Medium Facilities Lead Market Adaptation
Medium data centers captured 39.48% of Nigeria's data center market share in 2025, reflecting the operational sweet spot between cost efficiency and practicality in power sourcing. Facilities in the 1-10 MW band utilize modular UPS blocks and containerized gensets that align with the patchy grid profile, thereby reducing the risk of stranded capacity. Meanwhile, large facilities are expected to post a 31.93% CAGR through 2031 as hyperscalers, such as MTN’s 150 MW Dabengwa site and Airtel’s 38 MW Nxtra build, come online. The Nigerian data center market size, attributable to large-footprint projects, is forecast to expand once incremental submarine capacity stabilizes latency and once through-cooling economics improve along the coast.
Demand for mega and massive campuses remains nascent, given limited grid headroom and stringent resilience regulations, although early design-build permits are emerging in Lagos's free-trade zones. Small-edge facilities continue to emerge near university clusters and emerging industrial parks, where IoT telemetry throughput is increasing. Overall, size-mix evolution underscores Nigeria’s dual-track trajectory, balancing the rapid rise of hyperscale cloud nodes with pragmatic medium-scale deployments that hedge against infrastructure volatility.


By Tier Type – Tier III Dominance Reflects Reliability Priorities
Tier III sites commanded 98.20% of Nigeria's data center market size in 2025, as concurrent maintainability is non-negotiable amid regular grid outages. Operators deploy N+1 on power and cooling, ring-protected fiber, and dual-road access to safeguard SLAs. Tier IV, although representing a small base, is projected to register a 97.01% CAGR as BFSI and sovereign-cloud customers seek fault tolerance measured in minutes of annual downtime. Upgrades often entail adding a second independent power pathway and extra chillers rather than ground-up rebuilds, helping operators amortize capex.
Tier II and Tier I sites still host secondary workloads—such as testing, disaster-recovery replicas, and archival storage, especially for SMEs whose budget priorities often outweigh uptime mandates. However, new government IT procurement frameworks increasingly specify Tier III minimum, eroding legacy demand. Hence, the Nigerian data center market is steadily converging toward a Tier III baseline, with selective adoption of Tier IV where regulatory or brand-risk profiles demand near-zero downtime.
By Data Center Type – Colocation Dominates Shared-Infrastructure Strategy
Colocation facilities accounted for 83.58% of 2025 revenue, indicating enterprises’ preference for opex-friendly, carrier-neutral environments that distribute capital-intensive power and cooling assets. Wholesale suites outpace retail racks because corporations demand secure cages, as well as high cross-connect density, for hybrid-cloud links. Hyperscale and self-built data centers, however, are forecast to rise at a 25.41% CAGR through 2031, propelled by cloud-service providers embedding regional availability zones. The Nigerian data center market size allocated to self-built assets is thus increasing, but the procurement model remains a mix-and-match approach; many hyperscalers pre-lease entire halls within third-party campuses as a risk-averse market-entry strategy.
Enterprise and edge segments trail but gain relevance in agro-processing belts and oil-and-gas corridors, where low-latency data consolidation is required. Operators respond with modular, prefabricated pods mounted near cell towers or industrial estates. The differing economics of colocation, self-build, and edge deployments illustrate the nuanced investment calculus that defines Nigeria’s maturing digital infrastructure landscape.
By End User – IT and Telecom Sectors Anchor Digital Infrastructure Investment
IT and telecom firms accounted for 18.22% of 2025 spend, driven by network core upgrades, CDN caching, and value-added managed services. BFSI is forecast to expand at a 8.83% CAGR through 2031 as mobile payments scale and cybersecurity regulations tighten. Financial institutions deploy primary and secondary data centers to satisfy mandatory data sovereignty and disaster recovery controls while optimizing latency for real-time payments. Meanwhile, government agencies are accelerating their migration to cloud-first infrastructure to underpin citizen-service portals mandated under prospective e-governance legislation.
Media and entertainment companies, notably Nollywood studios, are adopting edge nodes to transcode and distribute high-definition content to diaspora viewers, reinforcing bandwidth utilization. Manufacturing and e-commerce verticals register smaller absolute demand but post brisk percentage growth as Industry 4.0 use cases emerge. This multifaceted end-user matrix sustains a broad revenue pipeline, ensuring the Nigeria data center market avoids over-reliance on any single vertical.
Geography Analysis
Lagos retained 29.72% of the national revenue in 2025, bolstered by the Equiano and 2Africa cable landings, a dense ISP presence, and the presence of financial sector headquarters. Rack Centre’s 13 MW LGS1 facility, MainOne’s MDXi campus, and MTN’s Dabengwa flagship collectively create a critical-mass ecosystem that attracts hyperscalers seeking low-latency peering. The Lagos Internet Exchange now carries peak traffic exceeding 450 Gbps, reducing the need for expensive international backhaul and leveraging network effects. With an 11.34% CAGR forecast, the city remains the launchpad for new entrants into the Nigeria data center market.
Abuja serves as the secondary hub due to its role as the administrative capital. IHS Towers’ government-focused site and multiple Tier III projects under construction are aligning with federal cloud-first policies. However, the costs of the Lagos-Abuja backbone still outstrip those of the Lagos-London equivalents, illustrating price inefficiencies that hinder rapid expansion in Abuja. Port Harcourt, Kano, and Enugu host nascent internet-exchange nodes and small edge facilities serving oil and gas telemetry and agro-logistics data. Their collective contribution to Nigeria's data center market size remains modest but rising as Project 774 and the 120,000 km National Communications Backbone extend fiber into underserved districts.
Regional growth depends on parallel investments in reliable power. Distributed gas plants and mini-grids are being evaluated to mitigate the risks associated with off-grid operations. State governments offer land concessions and tax holidays to lure operators, yet skilled-labor shortages outside Lagos remain acute. Over the forecast horizon, geography diversity will improve, but market gravity will still center on Lagos, mirroring global precedents where coastal cable landings create indelible digital economy hubs.
Competitive Landscape
Nigeria’s data center market exhibits moderate concentration, with regional stalwarts such as Rack Centre, MDXi (MainOne-Equinix), and Africa Data Centres sharing space with telecom-led hyperscalers MTN and Airtel. Equinix’s USD 320 million acquisition of MainOne in 2022 signaled a multinational appetite for local assets, fast-tracking the diffusion of global best practices.[4]Equinix, Inc., “Equinix to Expand into Africa with Acquisition of MainOne,” equinix.com MTN’s USD 150 million Dabengwa Data Centre launch in July 2025 set a new regional capacity benchmark, while Airtel’s Nxtra 38 MW build underscores shifting revenue models from connectivity to integrated cloud services.
Competitive levers emphasize power resilience, multiple cable on-ramps, and audited compliance with the Nigeria Data Protection Act. Operators deploy solar-diesel-battery hybrids to cap operational costs and brandish green-power credentials that resonate with ESG-conscious hyperscalers. Strategic alliances-such as MTN and Airtel’s March 2025 infrastructure-sharing pact-aim to optimize capex and accelerate edge rollouts, offering customers wider geographic coverage without duplicative spend.
Carrier-neutral campuses differentiate themselves via dense meet-me rooms, offering cross-connect prices that are 30-40% lower than those in enterprise-class office buildings. Meanwhile, global cloud providers are negotiating reserved-capacity deals to secure sovereign cloud zones before local competitors scale. The resulting landscape combines international financing strength with indigenous operational expertise, thereby reinforcing barriers to entry for opportunistic new players.
Nigeria Data Center Industry Leaders
Africa Data Centres
MDXi (MainOne – an Equinix Company)
MTN Nigeria Communications PLC
Rack Centre Limited
Open Access Data Centres Nigeria Ltd
- *Disclaimer: Major Players sorted in no particular order


Recent Industry Developments
- July 2025: MTN Nigeria launched the Dabengwa Data Centre in Lagos, investing USD 150 million to establish West Africa’s largest Tier III facility with multicloud on-ramps.
- July 2025: Temasek, Microsoft, and BlackRock unveiled a USD 30 billion Project MGX plan to build AI-ready campuses across emerging regions, naming Nairobi as an initial site—a signal of rising investor focus on Sub-Saharan Africa.
- June 2025: MainOne (Equinix) opened AB1.2, a carrier-neutral Tier III site in Côte d’Ivoire, enhancing West African interconnectivity paths that feed Nigeria.
- March 2025: MTN and Airtel entered an infrastructure-sharing accord covering Nigeria and Uganda to cut deployment costs and speed service rollouts.


Nigeria Data Center Market Report Scope
Lagos are covered as segments by Hotspot. Massive, Medium, Mega, Small are covered as segments by Data Center Size. Tier 3 are covered as segments by Tier Type. Non-Utilized, Utilized are covered as segments by Absorption.| Large |
| Massive |
| Medium |
| Mega |
| Small |
| Tier 1 and 2 |
| Tier 3 |
| Tier 4 |
| Hyperscale/Self-built | ||
| Enterprise/Edge | ||
| Colocation | Non-Utilised | |
| Utilised | Retail Colocation | |
| Wholesale Colocation | ||
| BFSI |
| IT and ITES |
| E-Commerce |
| Government |
| Manufacturing |
| Media and Entertainment |
| Telecom |
| Other End Users |
| Lagos |
| Rest of Nigeria |
| By Data Center Size | Large | ||
| Massive | |||
| Medium | |||
| Mega | |||
| Small | |||
| By Tier Type | Tier 1 and 2 | ||
| Tier 3 | |||
| Tier 4 | |||
| By Data Center Type | Hyperscale/Self-built | ||
| Enterprise/Edge | |||
| Colocation | Non-Utilised | ||
| Utilised | Retail Colocation | ||
| Wholesale Colocation | |||
| By End User | BFSI | ||
| IT and ITES | |||
| E-Commerce | |||
| Government | |||
| Manufacturing | |||
| Media and Entertainment | |||
| Telecom | |||
| Other End Users | |||
| By Hotspot | Lagos | ||
| Rest of Nigeria | |||


Market Definition
- IT LOAD CAPACITY - The IT load capacity or installed capacity, refers to the amount of energy consumed by servers and network equipments placed in a rack installed. It is measured in megawatt (MW).
- ABSORPTION RATE - It denotes the extend to which the data center capacity has been leased out. For instance, a 100 MW DC has leased out 75 MW, then absorption rate would be 75%. It is also referred as utilization rate and leased-out capacity.
- RAISED FLOOR SPACE - It is an elevated space build over the floor. This gap between the original floor and the elevated floor is used to accommodate wiring, cooling, and other data center equipment. This arrangement assist in having proper wiring and cooling infrastructure. It is measured in square feet (ft^2).
- DATA CENTER SIZE - Data Center Size is segmented based on the raised floor space allocated to the data center facilities. Mega DC - # of Racks must be more than 9000 or RFS (raised floor space) must be more than 225001 Sq. ft; Massive DC - # of Racks must be in between 9000 and 3001 or RFS must be in between 225000 Sq. ft and 75001 Sq. ft; Large DC - # of Racks must be in between 3000 and 801 or RFS must be in between 75000 Sq. ft and 20001 Sq. ft; Medium DC # of Racks must be in between 800 and 201 or RFS must be in between 20000 Sq. ft and 5001 Sq. ft; Small DC - # of Racks must be less than 200 or RFS must be less than 5000 Sq. ft.
- TIER TYPE - According to Uptime Institute the data centers are classified into four tiers based on the proficiencies of redundant equipment of the data center infrastructure. In this segment the data center are segmented as Tier 1,Tier 2, Tier 3 and Tier 4.
- COLOCATION TYPE - The segment is segregated into 3 categories namely Retail, Wholesale and Hyperscale Colocation service. The categorization is done based on the amount of IT load leased out to potential customers. Retail colocation service has leased capacity less than 250 kW; Wholesale colocation services has leased capacity between 251 kW and 4 MW and Hyperscale colocation services has leased capacity more than 4 MW.
- END CONSUMERS - The Data Center Market operates on a B2B basis. BFSI, Government, Cloud Operators, Media and Entertainment, E-Commerce, Telecom and Manufacturing are the major end-consumers in the market studied. The scope only includes colocation service operators catering to the increasing digitalization of the end-user industries.
| Keyword | Definition |
|---|---|
| Rack Unit | Generally referred as U or RU, it is the unit of measurement for the server unit housed in the racks in the data center. 1U is equal to 1.75 inches. |
| Rack Density | It defines the amount of power consumed by the equipment and server housed in a rack. It is measured in kilowatt (kW). This factor plays a critical role in data center design and, cooling and power planning. |
| IT Load Capacity | The IT load capacity or installed capacity, refers to the amount of energy consumed by servers and network equipment placed in a rack installed. It is measured in megawatt (MW). |
| Absorption Rate | It denotes how much of the data center capacity has been leased out. For instance, if a 100 MW DC has leased out 75 MW, then the absorption rate would be 75%. It is also referred to as utilization rate and leased-out capacity. |
| Raised Floor Space | It is an elevated space built over the floor. This gap between the original floor and the elevated floor is used to accommodate wiring, cooling, and other data center equipment. This arrangement assists in having proper wiring and cooling infrastructure. It is measured in square feet/meter. |
| Computer Room Air Conditioner (CRAC) | It is a device used to monitor and maintain the temperature, air circulation, and humidity inside the server room in the data center. |
| Aisle | It is the open space between the rows of racks. This open space is critical for maintaining the optimal temperature (20-25 °C) in the server room. There are primarily two aisles inside the server room, a hot aisle and a cold aisle. |
| Cold Aisle | It is the aisle wherein the front of the rack faces the aisle. Here, chilled air is directed into the aisle so that it can enter the front of the racks and maintain the temperature. |
| Hot Aisle | It is the aisle where the back of the racks faces the aisle. Here, the heat dissipated from the equipment’s in the rack is directed to the outlet vent of the CRAC. |
| Critical Load | It includes the servers and other computer equipment whose uptime is critical for data center operation. |
| Power Usage Effectiveness (PUE) | It is a metric which defines the efficiency of a data center. It is calculated by: (𝑇𝑜𝑡𝑎𝑙 𝐷𝑎𝑡𝑎 𝐶𝑒𝑛𝑡𝑒𝑟 𝐸𝑛𝑒𝑟𝑔𝑦 𝐶𝑜𝑛𝑠𝑢𝑚𝑝𝑡𝑖𝑜𝑛)/(𝑇𝑜𝑡𝑎𝑙 𝐼𝑇 𝐸𝑞𝑢𝑖𝑝𝑚𝑒𝑛𝑡 𝐸𝑛𝑒𝑟𝑔𝑦 𝐶𝑜𝑛𝑠𝑢𝑚𝑝𝑡𝑖𝑜𝑛). Further, a data center with a PUE of 1.2-1.5 is considered highly efficient, whereas, a data center with a PUE >2 is considered highly inefficient. |
| Redundancy | It is defined as a system design wherein additional component (UPS, generators, CRAC) is added so that in case of power outage, equipment failure, the IT equipment should not be affected. |
| Uninterruptible Power Supply (UPS) | It is a device that is connected in series with the utility power supply, storing energy in batteries such that the supply from UPS is continuous to IT equipment even during utility power is snapped. The UPS primarily supports the IT equipment only. |
| Generators | Just like UPS, generators are placed in the data center to ensure an uninterrupted power supply, avoiding downtime. Data center facilities have diesel generators and commonly, 48-hour diesel is stored in the facility to prevent disruption. |
| N | It denotes the tools and equipment required for a data center to function at full load. Only "N" indicates that there is no backup to the equipment in the event of any failure. |
| N+1 | Referred to as 'Need plus one', it denotes the additional equipment setup available to avoid downtime in case of failure. A data center is considered N+1 when there is one additional unit for every 4 components. For instance, if a data center has 4 UPS systems, then for to achieve N+1, an additional UPS system would be required. |
| 2N | It refers to fully redundant design wherein two independent power distribution system is deployed. Therefore, in the event of a complete failure of one distribution system, the other system will still supply power to the data center. |
| In-Row Cooling | It is the cooling design system installed between racks in a row where it draws warm air from the hot aisle and supplies cool air to the cold aisle, thereby maintaining the temperature. |
| Tier 1 | Tier classification determines the preparedness of a data center facility to sustain data center operation. A data center is classified as Tier 1 data center when it has a non-redundant (N) power component (UPS, generators), cooling components, and power distribution system (from utility power grids). The Tier 1 data center has an uptime of 99.67% and an annual downtime of <28.8 hours. |
| Tier 2 | A data center is classified as Tier 2 data center when it has a redundant power and cooling components (N+1) and a single non-redundant distribution system. Redundant components include extra generators, UPS, chillers, heat rejection equipment, and fuel tanks. The Tier 2 data center has an uptime of 99.74% and an annual downtime of <22 hours. |
| Tier 3 | A data center having redundant power and cooling components and multiple power distribution systems is referred to as a Tier 3 data center. The facility is resistant to planned (facility maintenance) and unplanned (power outage, cooling failure) disruption. The Tier 3 data center has an uptime of 99.98% and an annual downtime of <1.6 hours. |
| Tier 4 | It is the most tolerant type of data center. A Tier 4 data center has multiple, independent redundant power and cooling components and multiple power distribution paths. All IT equipment are dual powered, making them fault tolerant in case of any disruption, thereby ensuring interrupted operation. The Tier 4 data center has an uptime of 99.74% and an annual downtime of <26.3 minutes. |
| Small Data Center | Data center that has floor space area of ≤ 5,000 Sq. ft or the number of racks that can be installed is ≤ 200 is classified as a small data center. |
| Medium Data Center | Data center which has floor space area between 5,001-20,000 Sq. ft, or the number of racks that can be installed is between 201-800, is classified as a medium data center. |
| Large Data Center | Data center which has floor space area between 20,001-75,000 Sq. ft, or the number of racks that can be installed is between 801-3,000, is classified as a large data center. |
| Massive Data Center | Data center which has floor space area between 75,001-225,000 Sq. ft, or the number of racks that can be installed is between 3001-9,000, is classified as a massive data center. |
| Mega Data Center | Data center that has a floor space area of ≥ 225,001 Sq. ft or the number of racks that can be installed is ≥ 9001 is classified as a mega data center. |
| Retail Colocation | It refers to those customers who have a capacity requirement of 250 kW or less. These services are majorly opted by small and medium enterprises (SMEs). |
| Wholesale Colocation | It refers to those customers who have a capacity requirement between 250 kW to 4 MW. These services are majorly opted by medium to large enterprises. |
| Hyperscale Colocation | It refers to those customers who have a capacity requirement greater than 4 MW. The hyperscale demand primarily originates from large-scale cloud players, IT companies, BFSI, and OTT players (like Netflix, Hulu, and HBO+). |
| Mobile Data Speed | It is the mobile internet speed a user experiences via their smartphones. This speed is primarily dependent on the carrier technology being used in the smartphone. The carrier technologies available in the market are 2G, 3G, 4G, and 5G, where 2G provides the slowest speed while 5G is the fastest. |
| Fiber Connectivity Network | It is a network of optical fiber cables deployed across the country, connecting rural and urban regions with high-speed internet connection. It is measured in kilometer (km). |
| Data Traffic per Smartphone | It is a measure of average data consumption by a smartphone user in a month. It is measured in gigabyte (GB). |
| Broadband Data Speed | It is the internet speed that is supplied over the fixed cable connection. Commonly, copper cable and optic fiber cable are used in both residential and commercial use. Here, optic cable fiber provides faster internet speed than copper cable. |
| Submarine Cable | A submarine cable is a fiber optic cable laid down at two or more landing points. Through this cable, communication and internet connectivity between countries across the globe is established. These cables can transmit 100-200 terabits per second (Tbps) from one point to another. |
| Carbon Footprint | It is the measure of carbon dioxide generated during the regular operation of a data center. Since, coal, and oil & gas are the primary source of power generation, consumption of this power contributes to carbon emissions. Data center operators are incorporating renewable energy sources to curb the carbon footprint emerging in their facilities. |


Research Methodology
Mordor Intelligence follows a four-step methodology in all our reports.
- Step-1: Identify Key Variables: In order to build a robust forecasting methodology, the variables and factors identified in Step-1 are tested against available historical market numbers. Through an iterative process, the variables required for market forecast are set and the model is built on the basis of these variables.
- Step-2: Build a Market Model: Market-size estimations for the forecast years are in nominal terms. Inflation is not a part of the pricing, and the average selling price (ASP) is kept constant throughout the forecast period for each country.
- Step-3: Validate and Finalize: In this important step, all market numbers, variables and analyst calls are validated through an extensive network of primary research experts from the market studied. The respondents are selected across levels and functions to generate a holistic picture of the market studied.
- Step-4: Research Outputs: Syndicated Reports, Custom Consulting Assignments, Databases & Subscription Platforms


