
New Zealand Sports Tourism Market Size and Share
Market Overview
| Study Period | 2022 - 2031 |
|---|---|
| Forecast Data Period | 2026 - 2031 |
| Base Year Market Size (2025) | USD 2.91 Billion |
| Market Size (2026) | USD 3.24 Billion |
| Market Size (2031) | USD 4.97 Billion |
| Growth Rate (2026 - 2031) | 8.93 % |
| Market Concentration | Low |
Major Players *Disclaimer: Major Players sorted in no particular order Image © Mordor Intelligence. Reuse requires attribution under CC BY 4.0. | |
New Zealand Sports Tourism Market Analysis by Mordor Intelligence
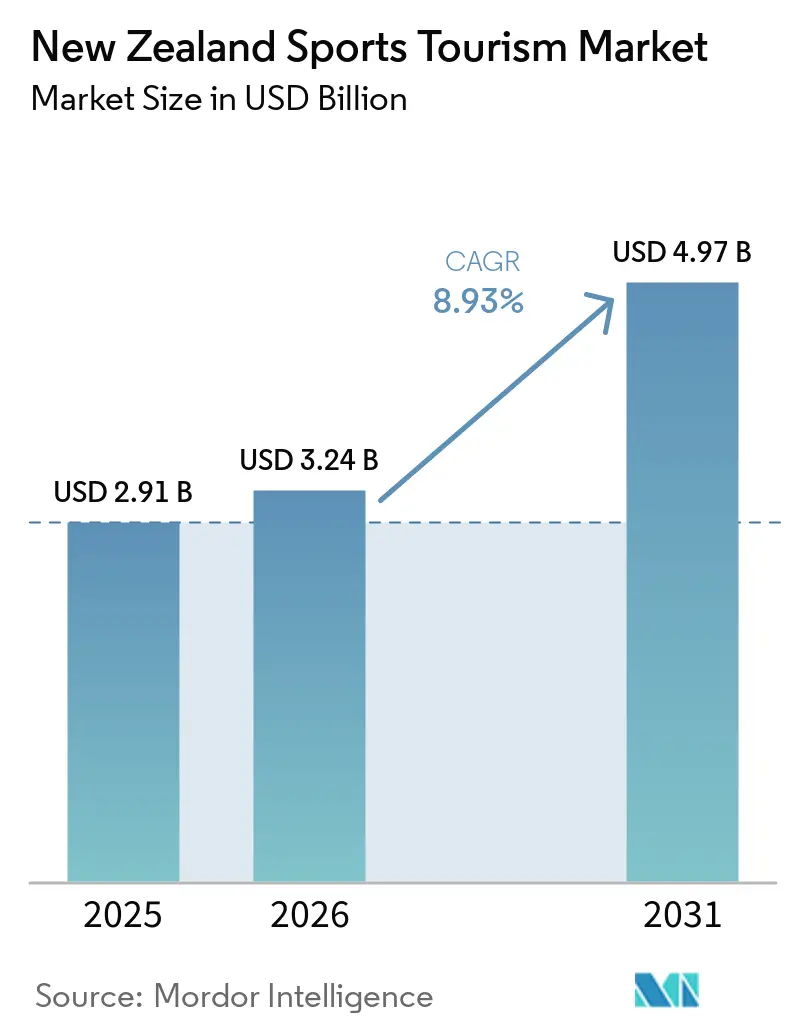
The New Zealand Sports Tourism Market size is expected to increase from USD 2.91 billion in 2025 to USD 3.24 billion in 2026 and reach USD 4.97 billion by 2031, growing at a CAGR of 8.93% over 2026-2031.
Visitor spending on sports-led travel is rising faster than overall tourism expenditure. In contrast, total tourism spending reached NZD 46.6 billion (USD 26.6 billion) in the year ended March 2025, indicating that sports-led trips are taking a larger share of visitor budgets. The New Zealand government strengthened that pattern in February 2026 through an NZD 70 million (USD 40.61 million) Major Events and Tourism package, including NZD 40 million (USD 23.21 million) to secure large international events from 2026, making event-led inbound demand a funded policy track rather than a discretionary tactic. Annual overseas visitor arrivals rose to 3.51 million in the year ended December 2025, with Australia contributing 1.52 million visitors, and international visitor spending reached NZD 12.5 billion (USD 7.25 billion), providing the New Zealand sports tourism market with a stronger demand base entering 2026. Airline capacity is also moving in the right direction, as international air services planned for Northern Winter 2025–26 were 8.2% higher than the prior year and 3.5% above the pre-pandemic benchmark, which supports event calendars and bookings through 2026 and 2027. The commercial pattern in the New Zealand sports tourism market is also shifting toward higher-yield packaging, as direct bookings remain the leading channel. Still, official event and rights-holder packages are expanding the fastest and creating more room for premium fan experiences and longer-stay itineraries.[1]
Key Report Takeaways
- By sports tourism type, Active Participation Tourism held 41.93% of the market in 2025, while Spectator and Event Tourism is projected to expand at a 9.93% CAGR through 2031.
- By sports category, Adventure Sports accounted for 24.82% of the market in 2026, while Marathon and Endurance Sports Tourism is forecast to grow at an 11.23% CAGR through 2031.
- By visitor origin, Domestic visitors held 68.14% of the market in 2025, while the International segment is expected to grow at a 10.35% CAGR through 2031.
- By booking channel, Direct bookings accounted for 42.92% of the market in 2025, while Official Event and Rights-holder Packages are projected to advance at a 9.62% CAGR through 2031.
- By geography, the South Island held 60.24% of the market in 2025, while the North Island is forecast to expand at a 9.35% CAGR through 2031.
Note: Market size and forecast figures in this report are generated using Mordor Intelligence’s proprietary estimation framework, updated with the latest available data and insights as of January 2026.
New Zealand Sports Tourism Market Trends and Insights
Drivers Impact Analysis*
| Drivers | (~) % Impact on CAGR Forecast | Geographic Relevance | Impact Timeline |
|---|---|---|---|
| Government-Backed Major-Event Attraction Funding | +2.2% | National, with concentrated gains in Auckland, Queenstown, Tauranga, Wellington, Christchurch | Short term (≤ 2 years) |
| International Visitor Recovery from Australia and Long-Haul Markets | +1.8% | National, Auckland gateway, South Island ski and adventure corridors | Medium term (2-4 years) |
| Bucket-List Destination Appeal and Proven Host Reputation | +1.5% | Global draw, South Island dominant, North Island growing | Long term (≥ 4 years) |
| Off-Peak Tourism Strategy Favoring Event-Led Travel | +0.8% | Shoulder-season demand in Auckland, Raglan, Tauranga, Rotorua | Medium term (2-4 years) |
| Sport Diplomacy Pipeline with India, the Pacific, and the United States | +0.6% | Auckland, Dunedin, Wellington, Pacific corridor | Long term (≥ 4 years) |
| Inbound School and Club Team Touring Ecosystem | +0.5% | Rotorua, Wellington, North Island regional centers | Medium term (2-4 years) |
| Source: Mordor Intelligence | |||
Government-Backed Major-Event Attraction Funding
New Zealand’s NZD 70 million (USD 40.61 million) Major Events and Tourism package, announced in February 2026, represented the country’s strongest single policy commitment to event-led tourism in more than a decade. More than half of that package, or NZD 40 million (USD 23.21 million), was allocated to secure large international events from 2026, which shows that the state is prioritizing inbound visitor yield over purely domestic audience growth. Events confirmed under the wider package included the World Surf League Championship Tour at Raglan, the New Zealand International Football Festival at Eden Park, and the Snow League World Challenge at Cardrona, with shoulder-season timing that supports regional occupancy outside summer peaks. Tauranga’s World Triathlon series, backed by NZD 2.65 million (USD 1.53 million) from the Major Events Fund, is projected to attract more than 6,000 international visitors and generate over NZD 25 million (USD 14.50 million) in international visitor spending across 2026 to 2028. The funding model also matters because Major Events Fund eligibility is tied to measurable international visitor generation and net national economic benefits, which turns public support into a quality filter for the New Zealand sports tourism market. That support improves near-term event conversion, but the lack of confirmed funding beyond 2027 still creates a planning risk for operators building multi-year event calendars.[2]
International Visitor Recovery from Australia and Long-Haul Markets
Australia remained the largest international source market in 2025, with 1.52 million arrivals, up 10% year on year, keeping the trans-Tasman corridor central to the New Zealand sports tourism market. The recovery is broader than just Australia, as overseas visitor arrivals totaled 3.51 million in the year ended December 2025, and international visitor spending reached NZD 12.5 billion (USD 7.25 billion) over the same period. Air New Zealand expanded seats to the United States and Canada by 8%, added 34,000 North America seats, and increased premium cabin allocation by 15% for the 2025–26 southern summer, which supports higher-yield sports travel demand. Auckland Airport data also showed Auckland–China seat capacity at 103% of pre-COVID levels, restoring an important channel for winter sports, rugby, and mixed-italianity travel. A stronger air network matters because it gives the New Zealand sports tourism market a larger pool of event-timed visitors across 2026 and 2027, especially from long-haul source markets that book earlier and spend more per trip. The pattern is now reinforced by the April 2025 New Zealand Rugby and STH Group partnership, which converted rugby-led travel into a fully integrated hospitality offer for global fans.
Bucket-List Destination Appeal and Proven Host Reputation
The New Zealand sports tourism market benefits from a destination profile that is difficult for competitors to replicate, as alpine terrain, surf environments, adventure corridors, and sports heritage attractions are clustered within a single compact national travel circuit. Queenstown Marathon’s presence in a global editorial travel shortlist for 2026 and Rotorua Marathon’s draw of more than 7,000 participants in 2025 show that New Zealand events convert destination prestige into registrations and extended stays. The All Blacks Experience also showed that sports heritage can generate stand-alone demand, with revenue up 45% between July and October 2025 and up 165% during Test week. Tourism New Zealand’s Active Escape campaign, launched in the Australian market, adds another layer by packaging running, cycling, and hiking with geothermal and Māori cultural experiences. That approach matters because the New Zealand sports tourism market is not relying only on one-off events; it is also building premium demand around reputation, scenery, sports culture, and multi-activity travel.
Off-Peak Tourism Strategy Favoring Event-Led Travel
The World Triathlon Series was held outside the peak season, while the government’s Regional Tourism Boost Campaign was designed to support visitors in regional destinations and during shoulder months. Christchurch Marathon in April 2026 recorded 8,479 participants from 36 countries, with 40% of entrants traveling from outside Christchurch and an estimated NZD 3 million (USD 1.74 million) local economic contribution. Hyrox Auckland almost doubled attendance from 2025 to 2026, moving from around 6,000 registered athletes to just under 11,000, demonstrating that urban fitness events are expanding the domestic and trans-Tasman event base. The off-peak logic is commercially important because travelers outside the summer season often face lower accommodation costs and less crowding, which improves trip value and repeat intent. That makes shoulder-season event design an important demand management tool for the New Zealand sports tourism market.
Restraints Impact Analysis*
| Restraints | (~) % Impact on CAGR Forecast | Geographic Relevance | Impact Timeline |
|---|---|---|---|
| Long-Haul Access Costs and Still-Constrained Airline Capacity | -1.0% | Global, most acute for North America, Europe, and Northeast Asia inbound corridors | Medium term (2-4 years) |
| Peak-Season Infrastructure Pressure and Resident Social-License Risks | -0.7% | Queenstown-Lakes, Rotorua, Bay of Islands, South Island alpine communities | Long term (≥ 4 years) |
| Equipment-Heavy Team Travel Slowed by Biosecurity Checks | -0.3% | All international entry points, Christchurch, Auckland, and Wellington airports | Medium term (2-4 years) |
| Certified Guide Shortages and Compliance-Cost Inflation | -0.3% | South Island adventure corridors, Fiordland, Aoraki or Mt Cook, Marlborough Sounds | Long term (≥ 4 years) |
| Source: Mordor Intelligence | |||
Long-Haul Access Costs and Still-Constrained Airline Capacity
Air capacity is improving, but the New Zealand sports tourism market still faces a cost problem on long-haul routes that affects Europe, the Middle East, and parts of Northeast Asia. BARNZ reported 8.2% seat growth for Northern Winter 2025–26, yet Air New Zealand still had up to 6 aircraft grounded in the second half of 2025 due to engine issues, limiting available long-haul lift. Auckland Airport data showed international capacity was still at 91% of pre-COVID levels in mid-2025, and long-haul load factors were at 87%, leaving little spare room for event-driven demand spikes. Passenger volumes between Auckland and the Middle East were also down 81% in March 2026, affecting connecting traffic to parts of South Asia and other long-haul markets. For skiing, golf, and multi-night touring packages, high airfares still absorb a large share of total spend, leaving less room for ground operators to protect margins. The arrival of more Boeing 787-9 aircraft and additional A321neo trans-Tasman frequencies offer some relief, but full restoration of 2019 long-haul capacity is still expected to take longer.
Peak-Season Infrastructure Pressure and Resident Social-License Risks
The South Island’s concentration of ski, adventure, and endurance assets gives the New Zealand sports tourism market a strong pull, but it also creates local pressure in places such as Queenstown-Lakes. Queenstown’s visitor intensity has raised concerns about accommodation, staffing, wages, and housing, complicating event delivery and seasonal workforce planning. NZSki’s fast-track application for the Doolans Basin expansion at The Remarkables would lift daily skier capacity from 3,500 to 6,000 and expand the skiable area to 711 hectares. Still, the construction timeline means the main relief would not arrive until late in the decade. Similar friction exists in Rotorua, where access management and visitor density shape the pace at which new adventure and heritage products can be added. The issue matters because resident acceptance, workforce availability, and transport capacity all affect how much growth the New Zealand sports tourism market can absorb at peak times. The absence of confirmed event funding beyond 2027 adds another layer of uncertainty for operators who are pricing multi-year itineraries around public event support.
*Our forecasts treat driver/restraint impacts as directional, not additive. The impact forecasts reflect baseline growth, mix effects, and variable interactions.
Segment Analysis
By Sports Tourism Type: Event Tourism Gaining Ground on an Active Participation Base
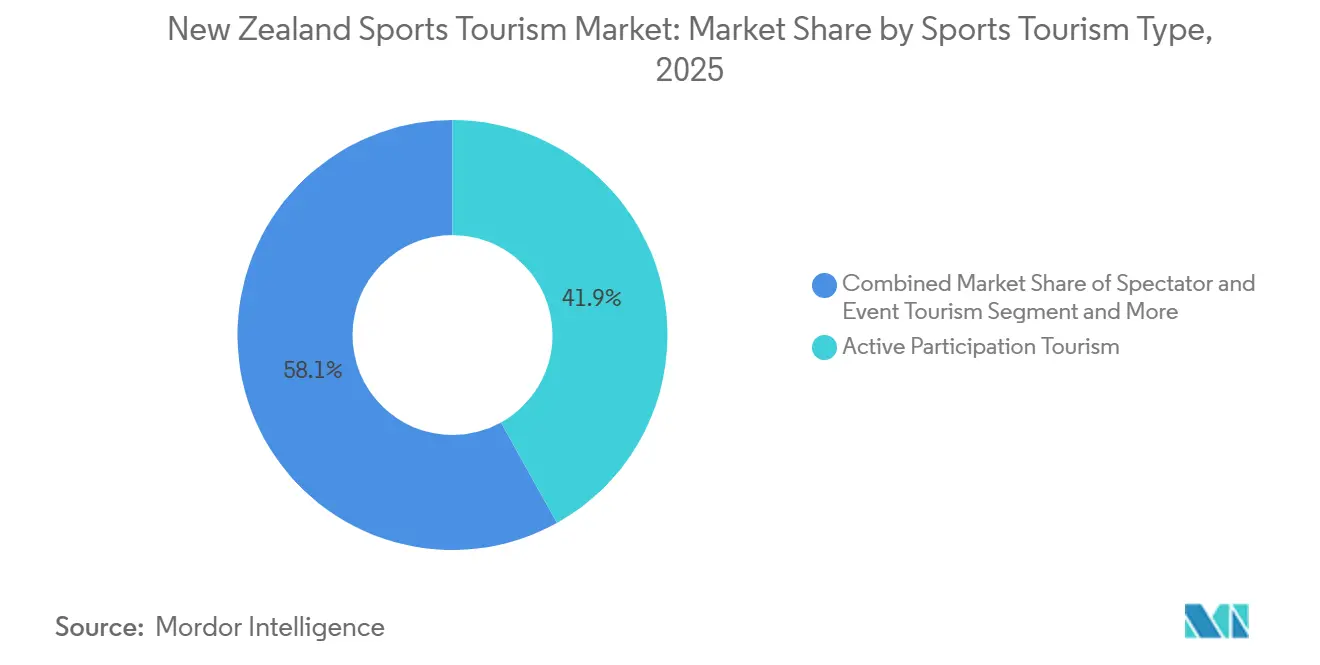
Active Participation Tourism held 41.93% of the New Zealand sports tourism market share in 2025, which reflects the country’s long-standing position as a place for direct physical activity rather than passive spectatorship. The segment is supported by Queenstown’s adventure ecosystem, the Great Walks network, and a dense calendar of endurance events that keep the New Zealand sports tourism market rooted in participation. Post-pandemic participation in running, cycling, and multi-sport formats continued to outperform earlier baselines, with Hyrox Auckland nearly doubling its registered athlete base from around 6,000 in 2025 to just under 11,000 in 2026. That rise matters because it supports repeat travel, recurring event attendance, and multi-activity itineraries rather than one-time visitation. It also helps operators simultaneously fill accommodation, transfers, guiding, and ancillary spend across multiple regions.
Spectator and Event Tourism is growing faster, with a 9.93% CAGR through 2031, driven by public funding and rights-holder packaging that are widening the event pipeline across the New Zealand sports tourism market. The government’s dedicated event-attraction funding from 2026 is a direct support factor here, as it increases the number of shoulder-season events with international appeal. The pattern is not replacing participatory travel; it is layering onto it, as marathon runners, rugby fans, and sports heritage visitors are increasingly combining multiple sports experiences in one trip. That hybrid demand pattern lifts per-trip spend because visitors add tickets, hospitality, heritage attractions, and regional stays to their core event or activity booking. Training Camps and School Tours, plus Sports Heritage and Experience Tourism, give the New Zealand sports tourism industry a broader base by creating year-round demand and reducing dependence on a single event cycle.

By Sports Category: Adventure Sports Lead but Endurance Is the Structural Growth Story
Adventure Sports accounted for 24.82% of the New Zealand sports tourism market in 2026, making it the leading sports category by value. Its strength comes from Queenstown’s dense commercial ecosystem of bungee, skydiving, jet boating, rafting, and alpine activity operators, many of which work within concession or access conditions that are not easy to replicate elsewhere. This scarcity supports pricing power and keeps the South Island central to the New Zealand sports tourism market. The category also benefits from international recognition, because New Zealand continues to be perceived as a bucket-list setting for high-engagement outdoor travel. That positioning supports both short-stay adventure breaks and longer mixed itineraries that combine sports participation with scenic touring.
Marathon and Endurance Sports Tourism is the fastest-growing category, with a 11.23% CAGR through 2031, and is becoming the strongest structural growth story in the New Zealand sports tourism industry. Christchurch Marathon’s record 8,479 participants from 36 countries in 2026 and Rotorua Marathon’s more than 7,000 participants in 2025 show that existing race platforms are already absorbing higher demand. The category is expanding on the back of broader participation shifts, including greater interest from younger and female entrants and stronger social visibility for endurance formats. This is commercially attractive because organizers can grow visitor numbers without the same infrastructure burden as some major spectator events. It also suits regional dispersal because endurance events can be staged across a wide set of towns and landscapes.
By Visitor Origin: Domestic Stability Funds the Platform, International Growth Drives Margin Expansion
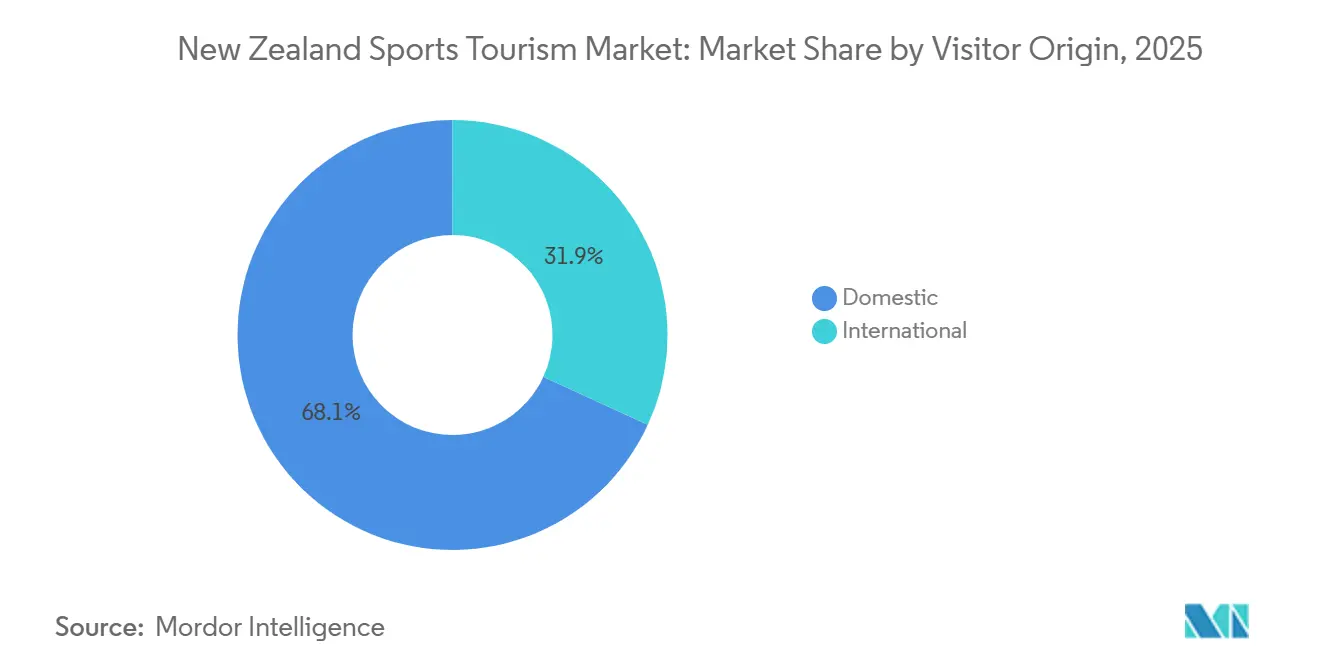
Domestic visitors accounted for 68.14% of the market in 2025, providing the New Zealand sports tourism market with a stable revenue floor between cycles of international demand. That domestic base reflects the country’s strong participation culture in running, cycling, skiing, and other adventure activities, as well as habits strengthened during the pandemic. It allows operators to keep guides, venues, transport links, and event capability active even when long-haul demand is uneven. This makes the local visitor segment especially valuable in a small but geographically dispersed market where supply continuity matters. The domestic share also reduces immediate vulnerability to sudden disruptions in airline or border services.
The International segment is growing faster, with a 10.35% CAGR through 2031, and it is expected to drive a larger share of incremental value because overseas visitors spend more per trip. MBIE’s survey data showed that international tourism accounted for 39% of total tourism expenditure, or NZD 18.1 billion (USD 10.5 billion), in the March 2025 year despite a smaller share of visitor volume. Australia still drives the largest inbound volume, while Asia-Pacific demand is supported by the NZSki China partnership and Tourism New Zealand’s Active Escape campaign in Japan. North America is expanding through premium rugby travel offers and improved premium cabin supply, while European visitors continue to favor long-form adventure and endurance itineraries. This matters because high-yield international sports tourists often book earlier and are less price sensitive than general leisure travelers.
By Booking Channel: Direct Bookings Anchored but Premium Packages Are the Growth Vector
Direct bookings accounted for 42.92% of the New Zealand sports tourism market in 2025, which shows that many travelers still trust established operators and prefer to build their own activity mix. That channel works well for local event registrations, domestic adventure travel, and repeat visitors who already know New Zealand’s sports destinations. It also benefits companies such as NZSki, RealNZ, and Ngāi Tahu Tourism, where brand recognition, destination knowledge, and direct customer communication support conversion. For the New Zealand sports tourism market, this keeps customer ownership in the hands of operators rather than intermediaries in many core product lines. The channel remains especially relevant for activities where travelers book accommodation and sports experiences separately.
Official Event and Rights-holder Packages are expanding faster, with a 9.62% CAGR through 2031, as event owners and partners increasingly control the full visitor experience rather than just ticket access. The New Zealand Rugby and STH arrangement is the clearest example, as it packages travel, premium hospitality, and branded matchday products under an exclusive rights-holder framework. That model captures a larger share of spend and creates clearer value tiers for high-yield fans traveling from Australia, North America, and other long-haul markets. It also allows event owners to shape the visitor journey from booking through stadium access and hospitality. This is why premium packaging has become one of the strongest margin opportunities inside the New Zealand sports tourism market.
Geography Analysis
The South Island accounted for 60.24% of New Zealand's sports tourism market share in 2025, reflecting its concentration of adventure, winter, and endurance assets. Queenstown remains the anchor because it combines commercial adventure scale, alpine access, event infrastructure, and a global destination profile within one compact region. NZSki's May 2026 fast-track application for the Doolans Basin expansion at The Remarkables proposed increasing the ski area from 449 hectares to 711 hectares and lifting daily skier capacity from 3,500 to 6,000, which shows long-horizon confidence in South Island demand. The same filing projected visitor spend growth from NZD 235 million to NZD 347 million (USD 201.35 million), then to NZD 402 million (USD 233.27 million), within 10 years of completion, underscoring how strongly operators expect sports-led travel to continue scaling in the region. The December 2025 NZSki and Sunac-BonSki partnership also positioned the South Island as a northern hemisphere off-season training and leisure destination for Chinese skiers.
The North Island is growing faster, at a 9.35% CAGR through 2031, as it benefits from a broader event pipeline, stronger urban gateways, and rising interest in rugby, football, surfing, and endurance experiences. Auckland sits at the center of this push, with Eden Park set to host the New Zealand International Football Festival in July 2026 under the event attraction package. Tauranga and Raglan strengthen the regional layer through triathlon and surf events, while Rotorua combines endurance sport with geothermal and Māori cultural extension opportunities. Rotorua Marathon's more than 7,000 participants in 2025 showed that the region already has a proven event base that can support longer-stay visitor patterns. This faster North Island growth matters because it helps the New Zealand sports tourism market spread demand more evenly and reduce overreliance on Queenstown.
Cross-island capacity now depends on both venue expansion and gateway efficiency. Te Kaha in Christchurch opened in March 2026 and, shortly after, hosted the Super Rugby Super Round in April, which added large-format sports capacity to the South Island and created a fresh base for event-related visitor nights in Canterbury. Auckland Airport's longer-run forecast of 14.4 million international passengers annually, or 45% growth, shows that the North Island gateway remains central to how the New Zealand sports tourism market scales. At the same time, the conservation concession framework still affects the pace of new guided adventure supply in protected South Island areas, which limits how quickly some premium products can be added. That means geography in the New Zealand sports tourism market is no longer only about destination appeal; it is also about air access, stadium readiness, local capacity, and speed of product approval. The result is a market where the South Island still leads in present value, while the North Island is gaining strategic importance as the growth geography.[3]
Competitive Landscape
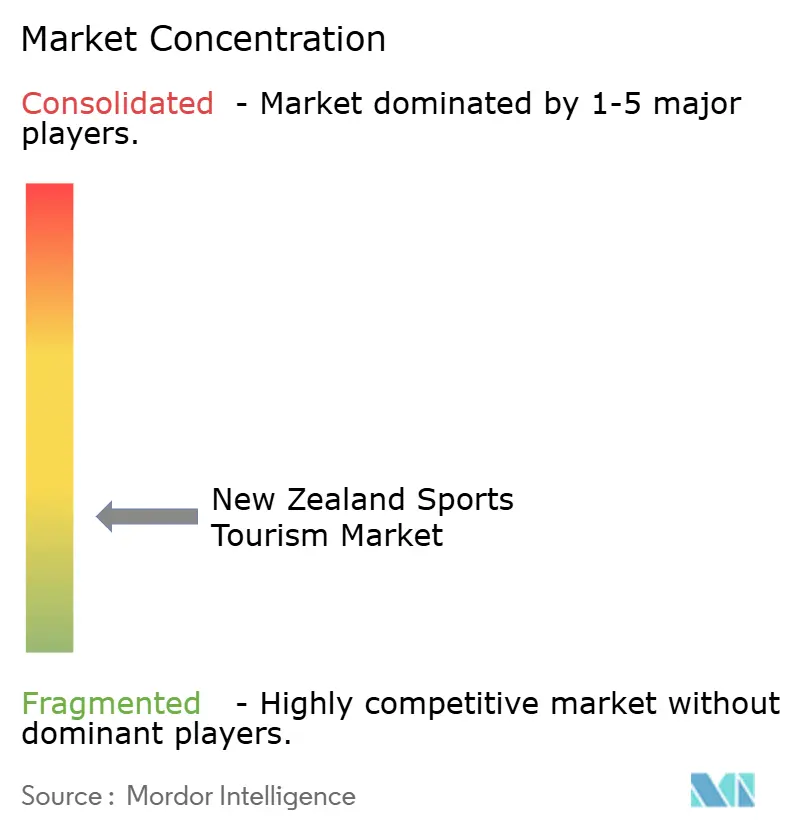
The New Zealand sports tourism market remains moderately fragmented, with a mix of national-scale operators and a long tail of specialist businesses that serve individual sports, regions, booking models, or visitor groups. Large names such as NZSki, Ngāi Tahu Tourism, and RealNZ have a stronger reach across products and distribution. However, they still operate inside a market where many experiences are local, specialized, and activity-specific. That structure means no single company controls the full market narrative across participation, spectator travel, training tours, and heritage experiences. It also means competition plays out differently by category, because ski access, rugby hospitality, youth tours, and adventure excursions all have distinct operating models. The New Zealand sports tourism market is therefore competitive, but not concentrated around one dominant integrated leader.
Consolidation pressure is still rising. The April 2025 exclusive four-year partnership between New Zealand Rugby and STH Group brought a high-yield global rugby hospitality channel under one coordinated provider, raising the barrier for other operators seeking to access premium fan travel. Intrepid Travel’s full acquisition of Haka Tours and ANZ Nature, followed by the Intrepid DMC rebrand, added global distribution depth to a well-known New Zealand touring platform. NZSki also showed how incumbents are investing operationally, with a NZD 2 million (USD 1.16 million)-plus Snow Factory artificial snowmaking machine at Coronet Peak and 25 Mandarin-speaking instructors for the 2026 season. Those moves matter because exclusivity, technology, and localization are becoming practical barriers that smaller operators cannot easily match.
There are still openings for smaller and regional players. The clearest gaps are premium Māori culture and sport itineraries, and off-peak regional event circuits outside Auckland and Queenstown, where public support exists but private execution remains uneven. The competitive threat is not only domestic, because Australia’s stronger monetization of major rugby touring events shows that yield management and packaging capability matter as much as raw visitor volumes. New entrants using dynamic pricing and OTA-led distribution can also pressure margins if incumbents do not improve their own pricing and bundling systems. In that sense, the New Zealand sports tourism market is moving toward a more structured competitive model where access rights, brand partnerships, and distribution strength matter more than simple destination presence. Smaller operators can still grow, but they need sharper positioning around niche sports, regional product depth, or curated group travel to defend margins.
New Zealand Sports Tourism Industry Leaders
-
Ngāi Tahu Tourism
-
Sports Travel & Hospitality New Zealand Limited
-
Skyline Enterprises
-
Active Adventures
-
NZSki Limited
- *Disclaimer: Major Players sorted in no particular order
Recent Industry Developments
- June 2026: NZSki Limited files fast-track application for NZD 150 million (USD 88.34 million)-plus Doolans Basin expansion at The Remarkables, proposing to grow the ski area from 449 hectares to 711 hectares, install New Zealand's longest gondola (2.7 km), and increase daily skier capacity from 3,500 to 6,000. Visitor spend at the resort is projected to grow from NZD 235 million (USD 138.41 million) to NZD 402 million (USD 236.77 million) within 10 years of project completion, with 1,851 new jobs created in the Queenstown-Lakes region.
- June 2026: New Zealand government confirms the World Surf League Championship Tour at Raglan, the FIFA World Series in Auckland, and the Snow League World Challenge at Wānaka under the NZD 40 million (USD 23.55 million) Events Attraction Package, alongside Robbie Williams and Linkin Park concerts. Events are confirmed as part of the wider NZD 70 million (USD 41.22 million) Major Events and Tourism package, with the FIFA World Series and WSL stop reinforcing Auckland and Waikato's dual-island status as sports event hubs.
- April 2026: Te Kaha (One New Zealand Stadium) opens in Christchurch and hosts the Super Rugby Super Round as its first major sporting event, ending Crusaders' 15-year use of temporary venues since the 2011 Canterbury earthquake. The stadium adds significant large-format capacity to the South Island events market and is expected to attract international Super Rugby and test match tourists to Christchurch.
- March 2026: Eden Park confirms New Zealand International Football Festival (Tottenham Hotspur vs Auckland FC, July 26, 2026) backed by the New Zealand Government's Events Attraction Package. Tottenham's 68 million global digital fanbase presents a direct international marketing channel, with TVNZ as the official broadcaster amplifying visibility in Australian and Pacific markets.
New Zealand Sports Tourism Market Report Scope
| Active Participation Tourism |
| Spectator and Event Tourism |
| Training Camps and School Tours |
| Sports Heritage and Experience Tourism |
| Adventure Sports |
| Water Sports |
| Winter Sports |
| Rugby Tourism |
| Golf Tourism |
| Cycling & Mountain Biking Tourism |
| Marathon & Endurance Sports Tourism |
| Cricket |
| Football |
| Domestic | |
| International | Australia |
| Asia-Pacific | |
| North America | |
| Europe |
| Direct |
| Official Event and Rights-holder Packages |
| Sports Tour Operators and Travel Agencies |
| Online Travel Agencies and Marketplaces |
| North Island |
| South Island |
| By Sports Tourism Type | Active Participation Tourism | |
| Spectator and Event Tourism | ||
| Training Camps and School Tours | ||
| Sports Heritage and Experience Tourism | ||
| By Sports Category | Adventure Sports | |
| Water Sports | ||
| Winter Sports | ||
| Rugby Tourism | ||
| Golf Tourism | ||
| Cycling & Mountain Biking Tourism | ||
| Marathon & Endurance Sports Tourism | ||
| Cricket | ||
| Football | ||
| By Visitor Origin | Domestic | |
| International | Australia | |
| Asia-Pacific | ||
| North America | ||
| Europe | ||
| By Booking Channel | Direct | |
| Official Event and Rights-holder Packages | ||
| Sports Tour Operators and Travel Agencies | ||
| Online Travel Agencies and Marketplaces | ||
| By Geography | North Island | |
| South Island | ||
Key Questions Answered in the Report
What is the projected value of the New Zealand sports tourism space by 2031?
It is projected to reach USD 4.97 billion by 2031 from USD 3.24 billion in 2026, growing at a CAGR of 8.93% over 2026 to 2031.
Which segment leads by sports tourism type in New Zealand?
Active Participation Tourism led with a 41.93% share in 2025, showing that the market is still anchored in direct physical engagement rather than spectatorship alone.
Which sports category is growing the fastest in New Zealand?
Marathon and Endurance Sports Tourism is the fastest-growing category, with a 11.23% CAGR through 2031, driven by strong race participation and greater event visibility.
Why is the North Island growing faster than the South Island?
The North Island is forecast to grow at a 9.35% CAGR because of Auckland-led event activity, Raglan surf events, Tauranga triathlon hosting, and Rotorua’s endurance and cultural extension appeal.
What is driving premium visitor spending in New Zealand sports travel?
Official event and rights-holder packages are growing the fastest at a 9.62% CAGR, and partnerships such as New Zealand Rugby with STH are pushing fans toward curated travel and hospitality products.
What are the main risks to growth through 2031?
The main risks are long-haul airfare pressure, residual airline capacity limits, local infrastructure strain in high-demand regions, biosecurity delays for team travel, and guide shortages in guided adventure corridors.