
Neurological Imaging Software Market Size and Share
Market Overview
| Study Period | 2020 - 2031 |
|---|---|
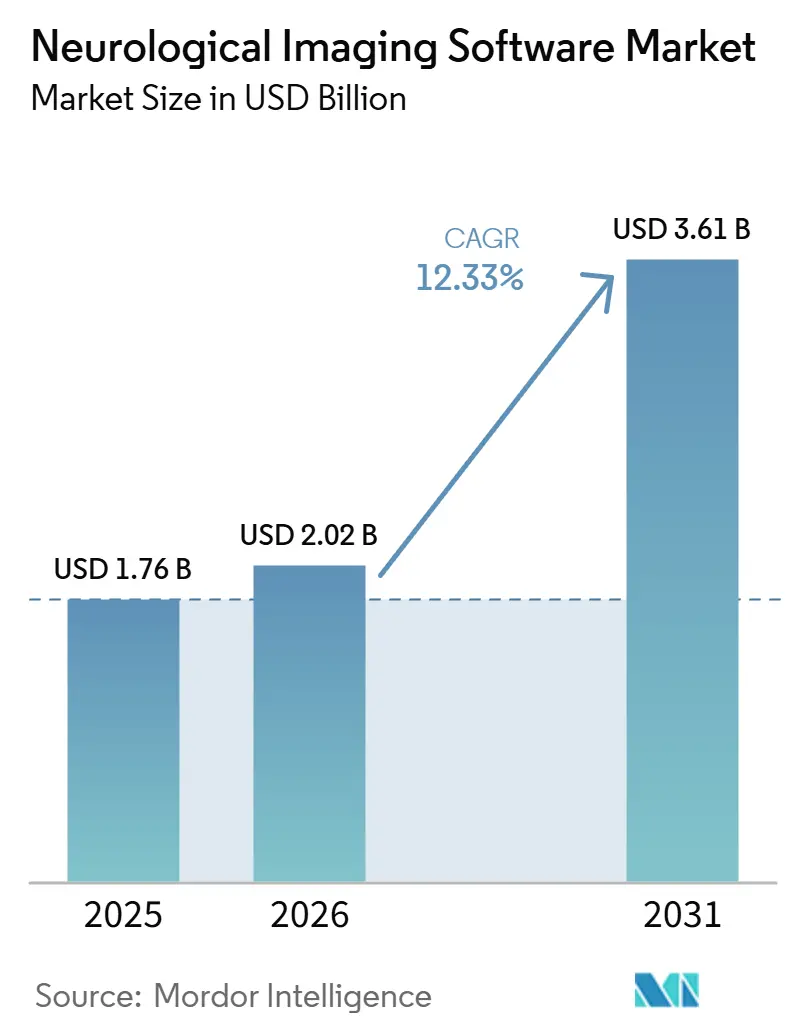
| Market Size (2026) | USD 2.02 Billion |
| Market Size (2031) | USD 3.61 Billion |
| Growth Rate (2026 - 2031) | 12.33 % |
| Fastest Growing Market | Asia-Pacific |
| Largest Market | North America |
| Market Concentration | Medium |
Major Players *Disclaimer: Major Players sorted in no particular order Image © Mordor Intelligence. Reuse requires attribution under CC BY 4.0. | |
Neurological Imaging Software Market Analysis by Mordor Intelligence
The Neurological Imaging Software Market size is expected to grow from USD 1.76 billion in 2025 to USD 2.02 billion in 2026 and is forecast to reach USD 3.61 billion by 2031 at 12.33% CAGR over 2026-2031.
The neurological imaging software market is supported by a large and persistent clinical need, as neurological disorders affect more than 3 billion people worldwide and cause more than 11 million deaths each year. New anti-amyloid therapies have also made serial MRI monitoring for amyloid-related imaging abnormalities a regular part of care for eligible patients. This creates recurring use of analysis and lesion-tracking tools rather than one-time diagnostic demand. Neurovascular networks, CNS clinical trials, and precision neurology are broadening the neurological imaging software market beyond conventional image viewing. Established imaging suppliers can use integrated platforms to protect hospital accounts, while software-focused vendors can compete through clinical evidence, faster clearances, and links to care coordination.
Key Report Takeaways
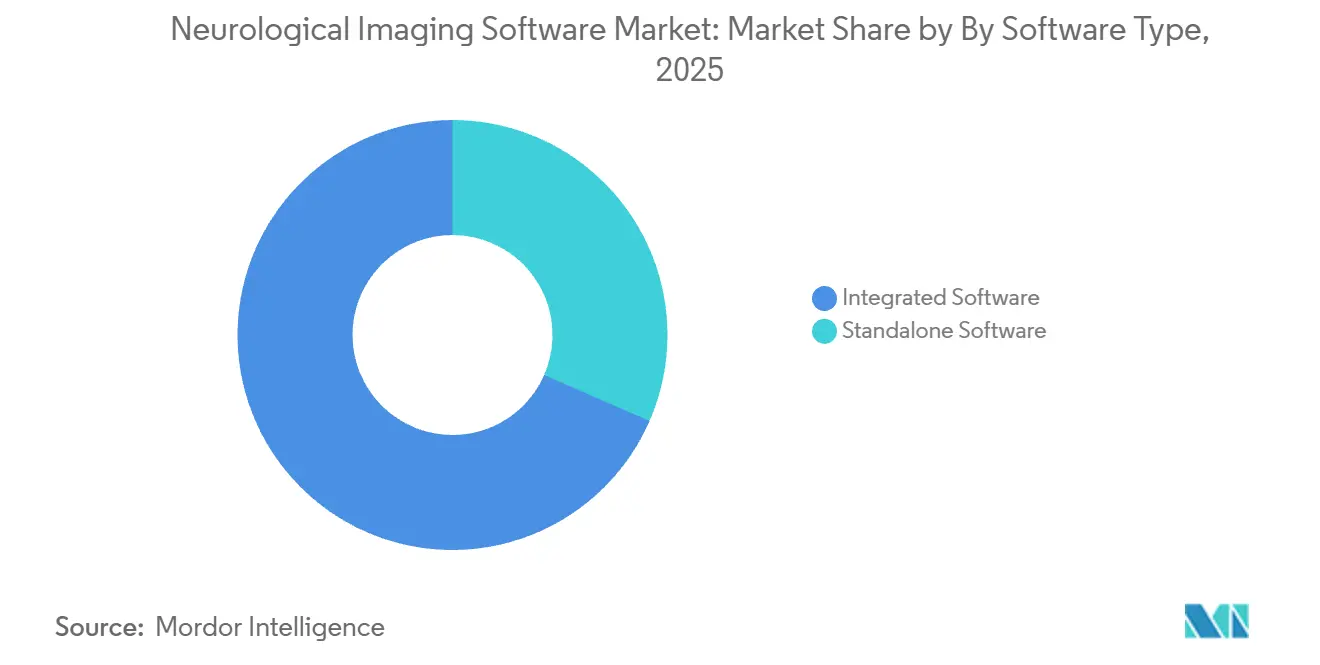
By software type, integrated software held 68.5% of the neurological imaging software market share in 2025, while standalone software is forecast to grow at a 12.4% CAGR through 2031.
By imaging modality, MRI software accounted for 42.2% of revenue in 2025, while PET software is forecast to expand at a 13.3% CAGR through 2031.
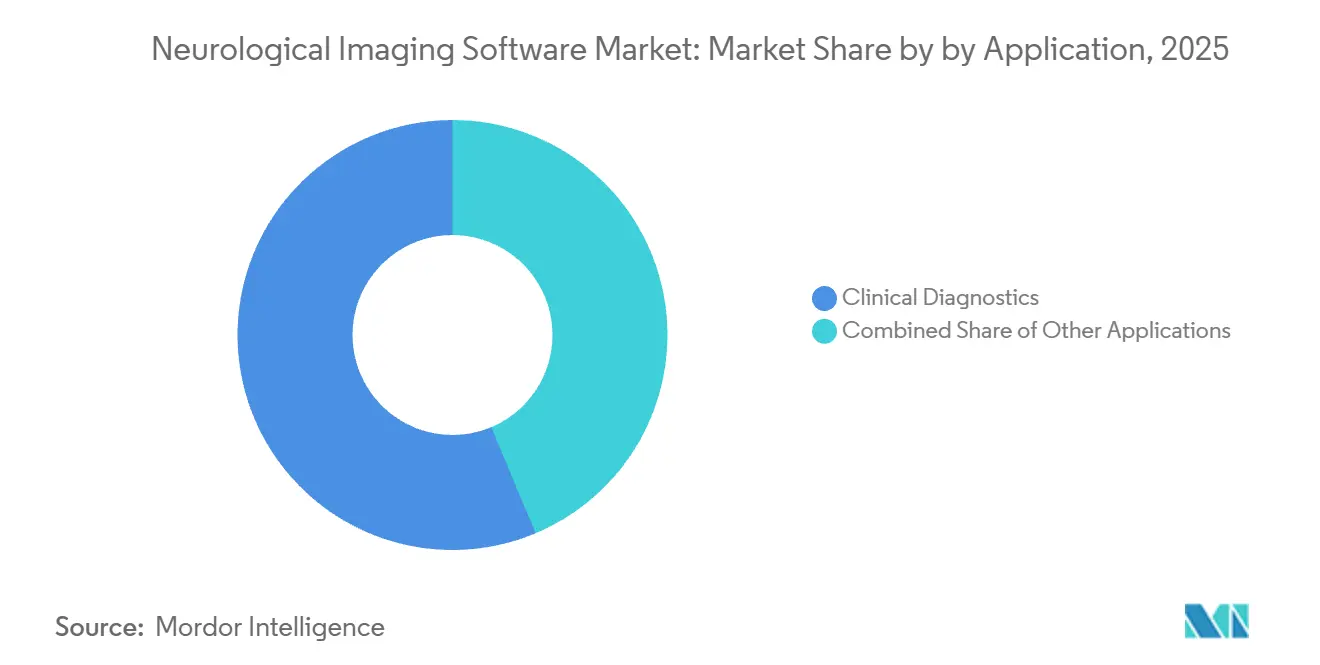
By application, clinical diagnostics held 56.3% of revenue in 2025, while the Others segment is forecast to grow at a 13.9% CAGR through 2031.
By deployment, cloud-based software held 54.7% of revenue in 2025, while hybrid deployment is forecast to grow at a 13.2% CAGR through 2031.
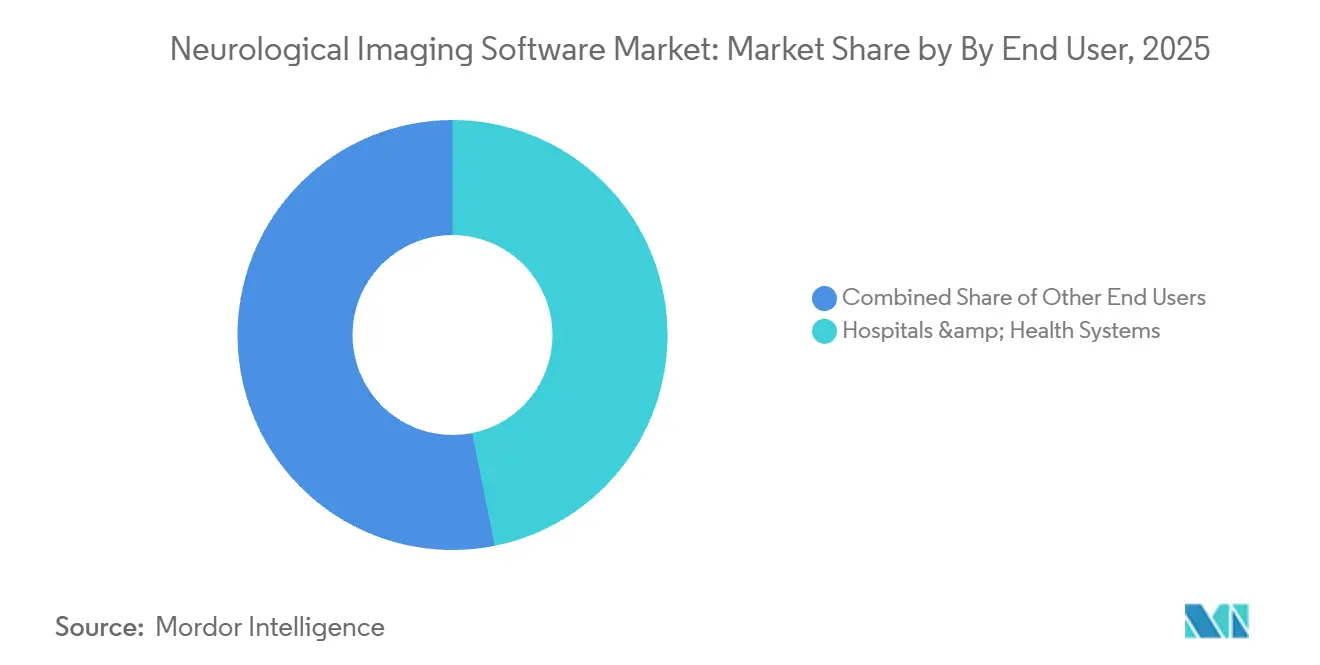
By end user, hospitals and health systems held 46.9% of revenue in 2025, while pharmaceutical and biotechnology companies are forecast to grow at a 14.1% CAGR through 2031.
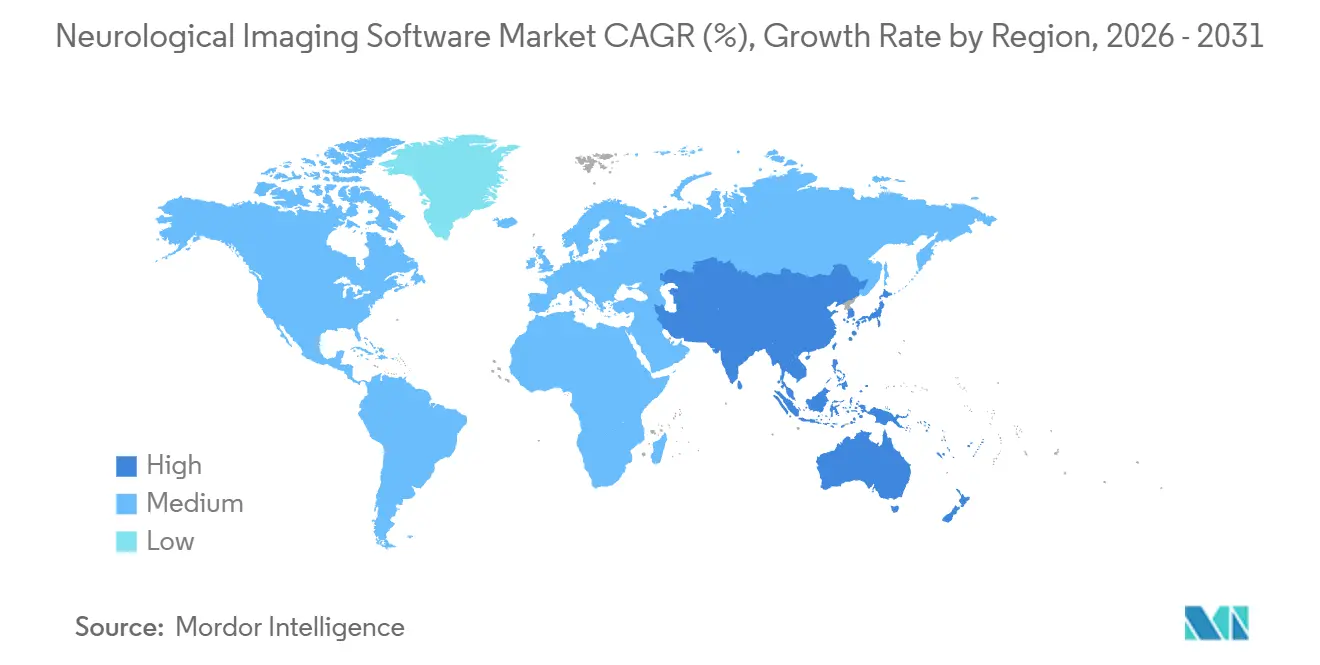
By geography, North America held 41.1% of revenue in 2025, while Asia Pacific is forecast to grow at a 12.6% CAGR through 2031.
Note: Market size and forecast figures in this report are generated using Mordor Intelligence’s proprietary estimation framework, updated with the latest available data and insights as of January 2026.
Market Trends and Insights
Drivers Impact Analysis of Neurological Imaging Software Market*
| Driver | (~) % Impact on CAGR Forecast | Geographic Relevance | Impact Timeline |
|---|---|---|---|
| Rising Burden of Neurological Diseases | +2.8% | Global, most acute in Asia Pacific and North America | Long term (≥ 4 years) |
| AI-Assisted Quantification and Faster Turnaround | +2.5% | North America and Europe, expanding to Asia Pacific | Medium term (2-4 years) |
| Cloud-Native Imaging and Cross-Site Collaboration | +2.0% | North America, Europe, and Asia Pacific | Medium term (2-4 years) |
| Imaging Biomarkers in Precision Neurology and CNS Trials | +1.8% | Global, concentrated in North America and the European Union | Medium term (2-4 years) |
| Longitudinal Measurement Standardization Across Sites | +1.2% | Global, with early gains in research-intensive markets | Long term (≥ 4 years) |
| Neurovascular Care Coordination and Faster Treatment | +0.9% | North America, Europe, and Asia Pacific telestroke networks | Short term (≤ 2 years) |
| Source: Mordor Intelligence | |||
Rising Disease Burden Extends the Per-Patient Imaging Window
The neurological imaging software market benefits from a growing need to manage long-duration neurological conditions. A 2026 study covering 470 million people in 38 countries found that neurological disability remained high even as age-adjusted death rates declined, particularly for Alzheimer’s disease, Parkinson’s disease, multiple sclerosis, and stroke[1]Pan American Health Organization, “Two in Five People in the Americas Live with a Neurological Disorder, New Study Finds,” Lancet Regional Health Americas, paho.org. These conditions often require repeated MRI examinations over many years. A patient with multiple sclerosis or Alzheimer’s disease may therefore generate serial imaging needs rather than one diagnostic scan. The World Stroke Organization projects a 58% increase in prevalent stroke cases worldwide by 2050. Providers that support brain volume measurement, lesion tracking, and progression review can serve this repeated clinical demand within the neurological imaging software market.
AI-Assisted Quantification Reshapes Neuroradiology Workflow Economics
The neurological imaging software market is also advancing as clinical teams seek to shorten routine interpretation work. AI tool availability in United States neuroradiology practices rose from 24.7% in 2017 to 61.4% in 2024, according to a 2025 survey[2]American Journal of Neuroradiology, “Third Comprehensive Survey of the Neuroradiology Work Environment in the United States,” American Journal of Neuroradiology. The same survey found that 78.7% of neuroradiologists had at least 1 burnout symptom, while 38.6% reported an intention to retire earlier than planned. Software must reduce routine work without creating false-positive review burdens for specialists. The long-running gap between neuroradiology job listings and trained graduates adds urgency to practical quantification tools. Siemens Healthineers received FDA 510(k) clearance for AI-Rad Companion Brain MR in January 2026, demonstrating continued institutional interest in automated quantitative brain MRI analysis.
Cloud-Native Platforms Enable Multi-Site Clinical and Research Collaboration
Cloud infrastructure gives the neurological imaging software market a way to support clinical networks and drug studies across several sites. The EBRAINS HealthDataCloud provides a GDPR-compliant environment for federated neuroimaging research and is linked to Charité University Medicine Berlin. Such environments allow research groups to analyze data across locations without physically centralizing patient records. Viz.ai is deployed in nearly 2,000 United States hospitals, and it introduced Viz Agent Studio in March 2026 for health systems to create AI care pathways. Adoption is not always a full move from local systems to cloud systems. Many organizations retain sensitive genomic data on site while sending de-identified imaging data to cloud computing, which favors vendors that support both environments.
Imaging Biomarkers in CNS Drug Development Create a New Software Demand Category
The neurological imaging software market is gaining a specialized demand source from CNS drug development. Anti-amyloid treatment programs require quantitative and longitudinal MRI monitoring for amyloid-related imaging abnormalities. These abnormalities affected up to 33% of patients in clinical trials, creating an ongoing need for segmentation and lesion-tracking support. The American Society of Neuroradiology issued a 2025 statement that described competencies for integrating neuro-PET interpretation into practice. This supports a move of PET biomarkers from research settings into clinical care. The National Institute on Aging has milestones to initiate the synthesis and testing of imaging ligands for at least 12 new PET or SPECT targets. Compatible post-processing tools can therefore find demand before many targets become commercial therapies.
Restraints Impact Analysis of Neurological Imaging Software Market*
| Restraint | (~) % Impact on CAGR Forecast | Geographic Relevance | Impact Timeline |
|---|---|---|---|
| Legacy PACS, EHR, and Modality Integration Costs | -1.5% | Global, most acute in public health systems in Europe and Asia Pacific | Long term (≥ 4 years) |
| Regulatory and Evidence Burden for Generalizable AI | -1.2% | North America and the European Union primary, with Asia Pacific approval pathways | Medium term (2-4 years) |
| Scanner, Protocol, and Population Variability | -0.8% | Global, most acute in multi-country research settings | Long term (≥ 4 years) |
| Shortage of Neuro-Radiology and AI Validation Expertise | -0.7% | North America, Europe, and Asia Pacific | Medium term (2-4 years) |
| Source: Mordor Intelligence | |||
Legacy System Integration Costs Create a Structural Adoption Barrier
The neurological imaging software market faces a practical constraint in the integration of new tools with existing systems. Hospitals must connect AI applications with PACS, DICOM-SR, HL7 FHIR, and electronic health records that may use incompatible data models. This work can require custom middleware and delay clinical activation by 6 to 18 months. The burden is more pronounced for regional hospitals in Europe and Asia Pacific that operate older PACS infrastructure. GE HealthCare received FDA clearance for its cloud-native View diagnostic viewer, which is intended to create a unified workflow across locations. Even where the technology reduces friction, hospitals must still train clinical and information technology staff and validate each tool against local equipment and protocols.
Regulatory Evidence Demands Limit Generalizability of Neuroimaging AI
The neurological imaging software market requires vendors to maintain evidence after an initial regulatory decision. FDA De Novo classification of Neuropacs for Parkinsonian syndrome differentiation in April 2026 followed more than 15 years of research and used more than 1,000 imaging data sets in its validation package. Models trained mainly on North American or European scanner configurations may also need local validation before use in Asian populations or on different scanner fleets. Research released in 2026 found that brain MRI embeddings remained scanner-dependent after harmonization. The European Union Medical Device Regulation and the FDA Software as a Medical Device framework also require post-market surveillance. These requirements favor suppliers with broad clinical partnerships, substantial data resources, and experience in long clearance cycles.
*Our forecasts treat driver/restraint impacts as directional, not additive. The impact forecasts reflect baseline growth, mix effects, and variable interactions.
Neurological Imaging Software Market Segment Analysis
By Software Type:
Integrated Platforms Anchor Clinical Workflows, Standalone Tools Gain in Niche SettingsIntegrated software held 68.5% of revenue in 2025. It fits hospital environments where radiologists, neurologists, and neurosurgeons need to share data in one workflow. The neurological imaging software market therefore continues to favor platform continuity in large health systems. Siemens Healthineers[3]Siemens Healthineers, “Siemens Healthineers Launches Syngo Flexinity Scalable Future-Proof Imaging Software Solutions,” ECR 2025 introduced Syngo Flexinity at ECR 2025 as a subscription suite for MRI, CT, and AI applications across scanner fleets. The model reduces separate licensing decisions for individual applications. It also gives providers a path to future software updates.
Standalone software is projected to grow at a 12.4% CAGR from 2026 to 2031. Buyers who manage Alzheimer’s trial cohorts or multiple sclerosis monitoring may select specialized tools for strong performance in a single clinical task. The neurological imaging software industry can therefore support specialist modules alongside integrated systems. These modules are usually added to an existing workflow rather than used to replace the core imaging platform. This creates room for OEM suppliers and focused software firms to serve the same hospital account. It also makes evidence for a specific disease indication an important part of procurement decisions.



By Imaging Modality:
PET Adoption Accelerates on Biomarker DemandMRI software held 42.2% of revenue in 2025, the largest neurological imaging software market size among imaging modalities. MRI is used across stroke, tumors, epilepsy, multiple sclerosis, and neurodegenerative disease assessment. PET software is forecast to grow at a 13.3% CAGR through 2031. Its adoption is tied to quantitative amyloid and tau biomarker assessment in treatment programs and clinical studies. CT software remains important in acute stroke triage, where time to treatment is critical. Harrison.ai received FDA clearance in March 2026 for acute infarct triage on non-contrast CT across 6 vascular territories.
SPECT software retains a defined role in perfusion imaging and epileptic focus localization. EEG and MEG visualization software is gaining use in pediatric epilepsy centers and pre-surgical mapping. These tools can support source localization where structural MRI alone is insufficient. Multimodal software and functional near-infrared spectroscopy software remain earlier-stage areas of the neurological imaging software market. Academic centers and cognitive neuroscience laboratories are expanding these capabilities for differentiated research use. The resulting demand is more specialized than the broad demand for MRI and CT analysis, but it provides suppliers with opportunities in focused clinical and research settings.
By Application:
Drug Development Use Cases Outpace Diagnostics GrowthClinical diagnostics held 56.3% of revenue in 2025 and remained the largest application. Hospitals and imaging centers use these tools for high-volume stroke, dementia, epilepsy, and tumor evaluations. The Others application category is forecast to grow at a 13.9% CAGR through 2031. It includes drug development, clinical trials, and regulatory-support work. Anti-amyloid treatment programs, tau imaging programs, and neuroinflammation studies require reproducible quantitative analysis across sites. This need makes the neurological imaging software market relevant to trial operations as well as standard patient care.
Research applications sit between routine diagnostics and commercial drug development. National Institutes of Health neuroscience programs, Brain Initiative projects, and academic collaborations contribute to this demand. brainlife.io provides a decentralized and open-source cloud platform for neuroscience research[4]Harrison.ai, “Harrison.ai Receives FDA Clearance for Acute Infarct Triage on Non-contrast CT Brain,” Harrison.ai. Pharmaceutical companies and contract research organizations evaluate software on validation depth, compatibility with regulatory submissions, and data portability. Their purchasing criteria differ from per-scan cost considerations in diagnostic imaging. This distinction can support a premium software tier for vendors that meet trial-grade requirements.
By Application of Neurological Imaging Software Market
| Clinical Diagnostics | 56.32% |
| Combined Share of Other Applications | 43.68% |
| Source: Mordor Intelligence | |
By Deployment:
Cloud-Based Scale Meets Hybrid-Architecture DemandCloud-based deployment held 54.7% of revenue in 2025. Multi-site neurovascular networks, decentralized trials, and health system consolidation all need imaging data to move across campuses. The neurological imaging software market size for cloud deployment is supported by these shared workflow needs. On-premises systems can be costly to expand for this purpose. Cloud tools can also standardize post-processing across a distributed set of sites. This makes cloud delivery useful where consistent analysis and rapid access are important.
Hybrid deployment is forecast to grow at a 13.2% CAGR through 2031. GDPR, national data localization requirements in China and India, and HIPAA responsibilities for genomically enriched records can require local primary storage. At the same time, AI inference workloads can move to cloud computing. Large academic medical centers retain on-premises systems because they have established computing resources and data governance practices. The neurological imaging software market favors suppliers that offer consistent capabilities and audit trails across cloud, hybrid, and local configurations. Such flexibility matters when clinical, technology, and compliance teams must approve the same procurement decision.
By End User:
Pharma Companies Drive the Fastest-Growing Revenue CohortHospitals and health systems held 46.9% of revenue in 2025. Their demand is sustained by acute neurology, surgical planning, and regular follow-up imaging for large patient populations. Pharmaceutical and biotechnology companies are forecast to grow at a 14.1% CAGR through 2031. These buyers use quantitative imaging software as a regulated clinical tool rather than a research convenience. The neurological imaging software market is therefore becoming more closely connected to evidence generation for therapies. This buyer group needs tools that work across sites and fit trial documentation requirements.
Neurophet raised KRW 32 billion, or USD 22.4 million, in April 2026 to expand in the United States and Japan and build relationships with pharmaceutical companies and medical institutions. Diagnostic imaging centers remain sophisticated but price-sensitive buyers, and they are adopting cloud-based and standalone tools. Academic medical centers and research institutes remain important validation partners and early proof-of-concept sites. Contract research organizations and specialist neurology or neurosurgery clinics form a fragmented but expanding group. Their demand is increasing for purpose-built quantification tools for particular diseases. These patterns give software vendors several customer routes beyond traditional hospital imaging departments.
Geography Analysis
North America Neurological Imaging Software Market
North America held 41.1% of global revenue in 2025, the leading neurological imaging software market share by region. The United States has a dense base of academic medical centers and a high number of FDA-cleared neuroimaging AI products. Siemens, GE HealthCare, Aidoc, Viz.ai, RapidAI, and Cercare Medical obtained new clearances between January and June 2026. The FDA Software as a Medical Device framework offers an established route for suppliers entering the United States. Medicare and commercial reimbursement for advanced neuroimaging also supports provider adoption. Canada’s telestroke networks and Mexico’s growing private neurology sector add regional demand, although the United States remains the main volume center.
Europe Neurological Imaging Software Market
Europe is the second-largest regional area for the neurological imaging software market. Germany, the United Kingdom, and France are the main demand centers. EU AI Act and Medical Device Regulation requirements have raised validation expectations for neuroimaging tools. Suppliers that meet those requirements can gain credibility in broader European procurement. Germany-based mediaire and VEObrain serve clinical users in DACH markets, while EBRAINS supports multi-country research under common data governance. The United Kingdom National Health Service is engaging with international vendors, including Heuron, while France, Italy, and Spain provide active academic neurology networks.
APAC, Middle East and South America Neurological Imaging Software Market
Asia Pacific is forecast to grow at a 12.6% CAGR from 2026 to 2031, the fastest regional growth rate in the neurological imaging software market. Japan uses a PMDA-regulated pathway that has supported domestic neuroimaging AI products. LPixel received PMDA approval in June 2025 for an EIRL Brain Aneurysm model update that reduced false positives and reported 92.3% sensitivity. FUJIFILM Healthcare launched SYNAPSE SAI viewer Ver2.6 in Japan in January 2025 with 3 brain MRI reading support functions. China’s UII system automatically segments 111 brain regions, while South Korea’s Neurophet is expanding after a third FDA 510(k) clearance in January 2026. India and Australia are building demand through academic neuroscience investment and healthcare digitization, while GCC countries, Brazil, and Argentina offer longer-term opportunities constrained by infrastructure and reimbursement gaps.

Competitive Landscape
The neurological imaging software market has a 2-tier competitive structure. The first tier includes Siemens Healthineers, GE HealthCare, Koninklijke Philips, Canon Medical, FUJIFILM Healthcare, and Agfa-Gevaert. These imaging OEMs combine software with scanner procurement and can introduce integrated suites before separate vendors are evaluated. This gives them an advantage with hospital clinical and technology teams. Siemens Healthineers integrated Cortechs.ai NeuroQuant 5.0 into its Digital Marketplace in March 2026 for MRI monitoring of amyloid-related imaging abnormalities. Its 2025 revenue of EUR 23.4 billion also reflects the investment capacity available to larger incumbents.
GE HealthCare has integrated the icometrix icobrain platform for quantitative brain MRI analysis and expanded work with NVIDIA for AI-powered imaging inference. This approach allows OEMs to incorporate third-party capabilities while retaining control of the main imaging environment. The neurological imaging software market also includes AI-native firms such as Viz.ai, Aidoc, RapidAI, Brainomix, QMENTA, IXICO, Pixyl, and Imaging Biometrics. These companies compete through clinical validation, regulatory clearance speed, and care-coordination functions. Aidoc announced USD 150 million in Series E financing in April 2026 and received its second FDA Breakthrough Device Designation in June 2026. Their position depends on showing that tools improve workflow without adding clinical review work.
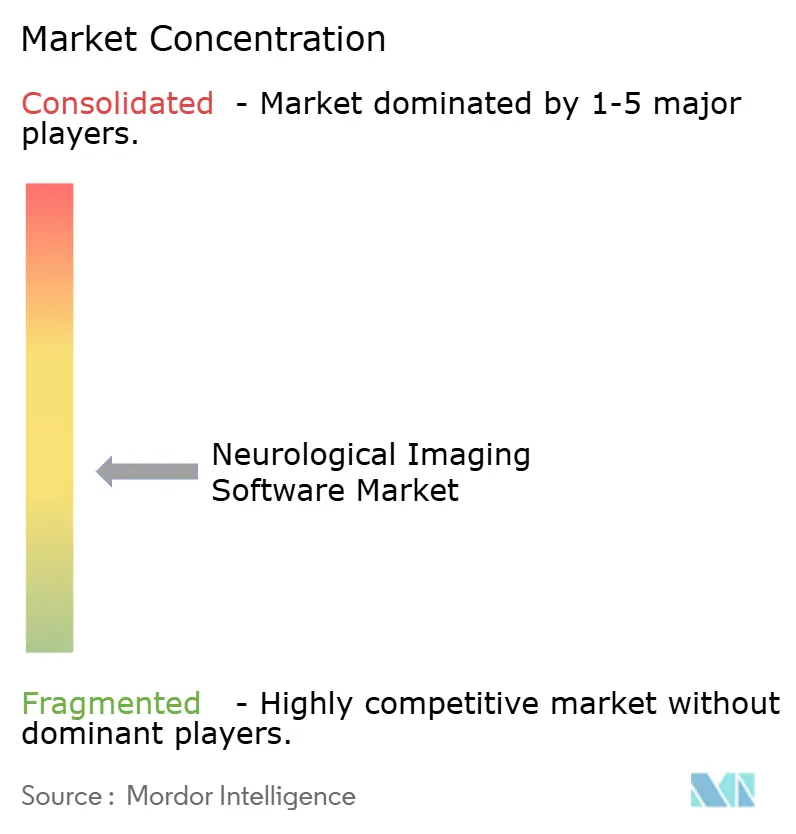
Longitudinal biomarker platforms that serve both clinical diagnostics and drug development represent an open area of competition. Vendors that combine trial-grade, multi-site validated quantification with direct electronic health record links can address pharmaceutical contracts and hospital enterprise needs with one product architecture. Pixyl and AQUILAB are building positions in multiple sclerosis lesion quantification and PET or CT analysis through academic medical partnerships. Viz.ai and Cortechs.ai announced a July 2026 collaboration to put NeuroQuant and NeuroQuant MS analysis into Viz.ai’s care coordination platform. This type of partnership shows how clinical workflow suppliers are moving into neurodegenerative disease monitoring. The neurological imaging software market remains moderately concentrated because large OEM platforms and a group of specialized vendors both have meaningful roles.
Neurological Imaging Software Industry Leaders
Siemens Healthineers AG
GE HealthCare Technologies Inc.
Koninklijke Philips N.V.
Canon Medical Systems Corporation
Aidoc Medical Ltd.
- *Disclaimer: Major Players sorted in no particular order
Neurological Imaging Software Market Companies Covered in this Report
- Siemens Healthineers
- GE HealthCare Technologies Inc.
- Koninklijke Philips
- Canon
- Agfa-Gevaert
- FUJIFILM Healthcare Corporation
- Brain Lab
- MIM Software
- QMENTA Inc.
- Viz.ai Inc.
- Aidoc Medical Ltd.
- RapidAI Inc.
- TeraRecon Inc.
- Pro Medicus Limited
- Novarad
- Esaote S.p.A.
- AQUILAB
- IXICO
- Brainomix Ltd.
- Quibim S.L.
- Pixyl SAS
- Imaging Biometrics, LLC
- NeuroLogica



Global Neurological Imaging Software Market Report Scope
| Integrated Software |
| Standalone Software |
| MRI Software |
| CT Software |
| PET Software |
| SPECT Software |
| EEG and MEG Visualization and Analysis Software |
| Others (fNIRS Software, Multimodal Neuroimaging Software, etc) |
| Clinical Diagnostics |
| Research Applications |
| Others (Drug Development, Clinical Trials, etc.) |
| On-Premises |
| Cloud-Based |
| Hybrid |
| Hospitals and Health Systems |
| Diagnostic Imaging Centers |
| Academic Medical Centers and Research Institutes |
| Pharmaceutical and Biotechnology Companies |
| Others (Contract Research Organizations, Specialty Neurology and Neurosurgery Clinics) |
| North America | United States |
| Canada | |
| Mexico | |
| Europe | Germany |
| United Kingdom | |
| France | |
| Italy | |
| Spain | |
| Rest of Europe | |
| Asia-Pacific | China |
| Japan | |
| India | |
| South Korea | |
| Australia | |
| Rest of Asia-Pacific | |
| Middle East | GCC |
| South Africa | |
| Rest of Middle East | |
| South America | Brazil |
| Argentina | |
| Rest of South America |
| Software Type | Integrated Software | |
| Standalone Software | ||
| Imaging Modality | MRI Software | |
| CT Software | ||
| PET Software | ||
| SPECT Software | ||
| EEG and MEG Visualization and Analysis Software | ||
| Others (fNIRS Software, Multimodal Neuroimaging Software, etc) | ||
| Application | Clinical Diagnostics | |
| Research Applications | ||
| Others (Drug Development, Clinical Trials, etc.) | ||
| Deployment | On-Premises | |
| Cloud-Based | ||
| Hybrid | ||
| End User | Hospitals and Health Systems | |
| Diagnostic Imaging Centers | ||
| Academic Medical Centers and Research Institutes | ||
| Pharmaceutical and Biotechnology Companies | ||
| Others (Contract Research Organizations, Specialty Neurology and Neurosurgery Clinics) | ||
| Geography | North America | United States |
| Canada | ||
| Mexico | ||
| Europe | Germany | |
| United Kingdom | ||
| France | ||
| Italy | ||
| Spain | ||
| Rest of Europe | ||
| Asia-Pacific | China | |
| Japan | ||
| India | ||
| South Korea | ||
| Australia | ||
| Rest of Asia-Pacific | ||
| Middle East | GCC | |
| South Africa | ||
| Rest of Middle East | ||
| South America | Brazil | |
| Argentina | ||
| Rest of South America | ||


Key Questions Answered in the Report
What is driving growth in neurological imaging software?
Rising neurological disease burden, repeated monitoring needs, AI-assisted quantification, cloud collaboration, and biomarker use in CNS trials are expanding adoption.
How large is the neurological imaging software market in 2026?
The neurological imaging software market size is USD 1.76 billion in 2026 and is forecast to reach USD 3.61 billion by 2031 at a 12.3% CAGR.
Which software type leads neurological imaging adoption?
Integrated software led with 68.5% of revenue in 2025 because hospital users need connected workflows across imaging and clinical teams.
Which imaging modality is growing fastest?
PET software is projected to grow at a 13.3% CAGR through 2031, supported by biomarker quantification needs in neurodegenerative disease programs.
Why are pharmaceutical companies adopting these tools?
Pharmaceutical and biotechnology companies need reproducible quantitative imaging for CNS trials and are forecast to grow at a 14.1% CAGR through 2031.
Which region has the fastest projected growth?
Asia Pacific is forecast to grow at a 12.6% CAGR through 2031, supported by national approval pathways and expanding clinical and research investment.
Page last updated on:





