Market Overview
| Study Period | 2020 - 2031 |
|---|---|
| Forecast Data Period | 2026 - 2031 |
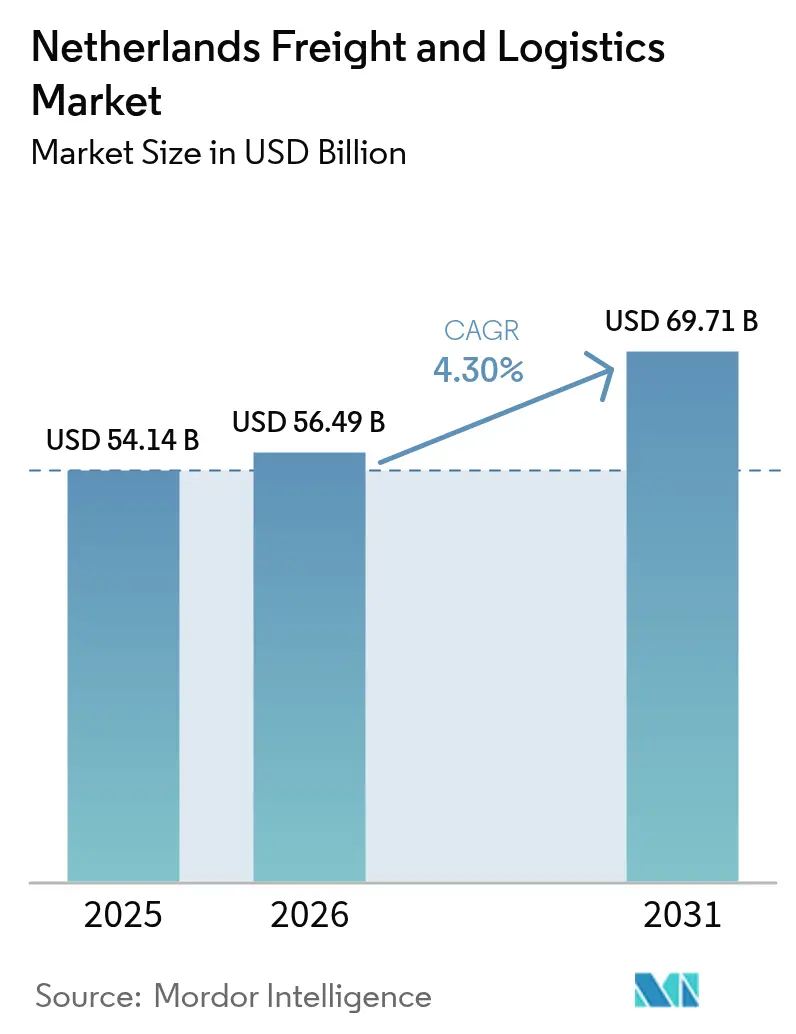
| Base Year Market Size (2025) | USD 54.14 Billion |
| Market Size (2026) | USD 56.49 Billion |
| Market Size (2031) | USD 69.71 Billion |
| Growth Rate (2026 - 2031) | 4.30% CAGR |
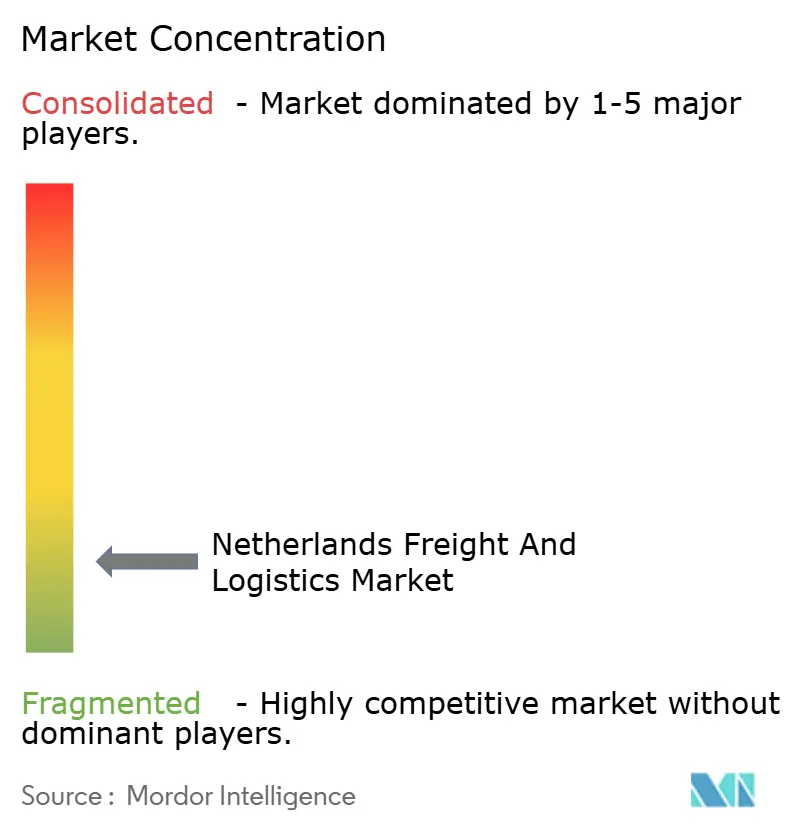
| Market Concentration | Low |
Major Players *Disclaimer: Major Players sorted in no particular order Image © Mordor Intelligence. Reuse requires attribution under CC BY 4.0. | |
Netherlands Freight And Logistics Market Analysis by Mordor Intelligence
The Netherlands Freight And Logistics Market size was valued at USD 54.14 billion in 2025 and is estimated to grow from USD 56.49 billion in 2026 to reach USD 69.71 billion by 2031, at a CAGR of 4.30% during the forecast period (2026-2031).
The market’s growth profile reflects the country’s role as a distribution gateway anchored by the Port of Rotterdam and Amsterdam Schiphol, which together underpin high-flow maritime and air corridors across Europe. The Netherlands freight and logistics market continues to benefit from advanced digital customs systems that compress dwell times and streamline cross-border documentation, which sustains throughput even when physical bottlenecks arise. The policy drive for zero-emission zones is changing last-mile economics and routing choices, which favors parcel lockers, electric vans, and cargo-bike networks across dense urban areas. Strong inland waterway connectivity stabilizes multimodal flows during rail or highway disruptions, while hydrogen and carbon capture projects around the port area align logistics with decarbonization goals. The Netherlands freight and logistics market will also gain from selective warehouse automation and micro-fulfillment models that absorb labor constraints and grid congestion inside existing brownfield footprints.
Key Report Takeaways
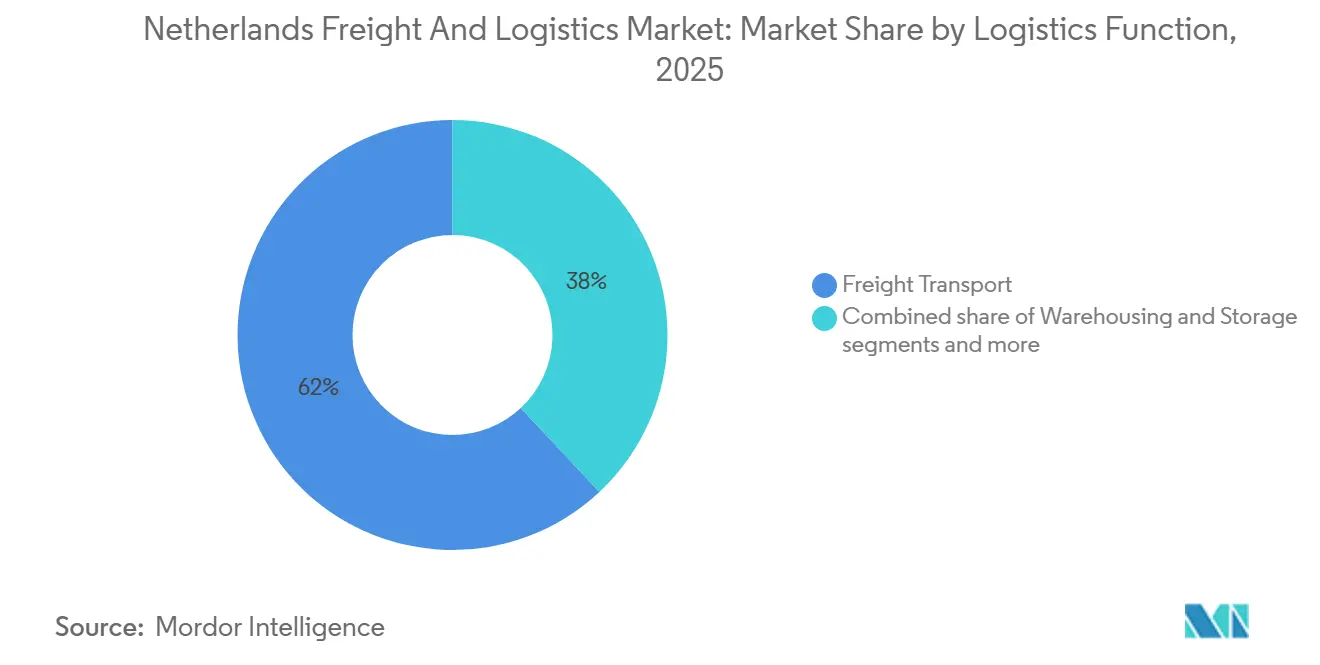
- By logistics function, Freight Transport led with 61.97% of the Netherlands' freight and logistics market share in 2025, while Courier, express, and parcel is forecast to expand at a 4.76% CAGR through 2026-2031.
- By end user industry, manufacturing accounted for 31.74% of the Netherlands' freight and logistics market size in 2025, while wholesale and retail trade recorded the highest projected CAGR at 4.64% through 2026-2031.
- Rotterdam's deep-sea capabilities and Schiphol's air cargo efficiency solidify the Netherlands' status as a pivotal multimodal distribution hub, streamlining just-in-time deliveries for the entire European market.
- Leadership in green logistics, digital twin infrastructure, and customs innovation is shifting the Netherlands from pure transit efficiency to a value-added, sustainability-compliant orchestration hub, though labor constraints and EU regulatory complexity demand adaptive operational models.
Note: Market size and forecast figures in this report are generated using Mordor Intelligence’s proprietary estimation framework, updated with the latest available data and insights as of 2026.
Netherlands Freight And Logistics Market Trends and Insights
Drivers Impact Analysis*
| Driver | (~) % Impact on CAGR Forecast | Geographic Relevance | Impact Timeline |
|---|---|---|---|
| Rotterdam Port as Europe’s Primary Gateway | +0.8% | Rotterdam and Randstad core, with national spill-over | Medium term (2-4 years) |
| Schiphol Airport Cargo Hub Expansion | +0.3% | Amsterdam–Schiphol corridor, supporting Dutch pharma and perishables | Short term (≤ 2 years) |
| Strategic Location for E-Commerce And 3PL | +1.1% | National, with early gains in Tilburg, Venlo, Eindhoven | Medium term (2-4 years) |
| Advanced Multimodal Connectivity | +0.9% | Rhine-Scheldt Delta, Rotterdam-Ruhr corridors | Long term (≥ 4 years) |
| Government Push for Zero-Emission Logistics | +0.7% | Amsterdam, Rotterdam, Utrecht, The Hague, scaling regionally | Medium term (2-4 years) |
| Digital Customs and Port Community Systems | +0.5% | Global, port-centric advantage for Rotterdam and Amsterdam | Short term (≤ 2 years) |
| Source: Mordor Intelligence | |||


Rotterdam Port's Position as Europe's Largest Gateway Driving Container and Bulk Cargo Volumes
Rotterdam’s role as Europe’s largest seaport remains central to the Netherlands' freight and logistics market, with 2024 cargo throughput indicating a slight overall decrease while maintaining high-volume handling capacity and a resilient container base. Container momentum has held up better than several bulk segments as the energy transition reduces coal flows and refiners adjust to new fuel mixes over time. The Porthos carbon capture and storage project, targeting operations from 2026 with industrial emitters in the port cluster, positions Rotterdam as a decarbonization services hub that complements logistics throughput. Hydrogen infrastructure is progressing through a 32 km pipeline welded inside the port area, tying future green fuels supply to maritime and hinterland transport applications. Inland waterways and rail links continue to underpin modal shifts to relieve highway congestion between Rotterdam and the Ruhr industrial belt, sustaining cost-efficient hinterland access.[1]Government of the Netherlands, “Inland Shipping,” government.nl
Schiphol Airport Cargo Hub Expansion Serving High-Value and Pharma Logistics
Schiphol’s cargo activity retained a strong end to 2025, with a December performance rebound driven by Far East inbound shipments and ongoing strength in pharmaceuticals. The hub’s specialization in pharma is reinforced by IATA CEIV Pharma certifications and a network of GDP-compliant cold-chain stations operated by carriers and 3PLs serving temperature-sensitive cargo. Swissport expanded second-line cargo capacity with Terminal 12, adding a facility that supports 24/7 import handling and integrates with advanced consolidation programs to reduce truck emissions near the airport precinct. Pharmaceutical and electronics flows continue to leverage air freight’s speed-to-market premium, with Schiphol’s handlers aligning investments with higher-margin segments. Partial policy constraints on flight movements sustain a push to optimize belly capacity and synchronize cargo-handling windows with ground-side digital tools, which protects throughput quality.
Strategic Location as European Distribution Center for E-commerce and 3PL Operations
The Netherlands’ ability to reach a very high share of European consumers within a single working day sustains cross-border fulfillment, which strengthens the Netherlands' freight and logistics market as a preferred hub. High online shopping penetration in the domestic market and steady gains in cross-border volumes continue to push CEP and omnichannel fulfillment demand for integrated warehousing and last-mile services. Operators are scaling modular and automation-ready solutions to let brands access enterprise-grade logistics without long fixed leases, aligning with urban delivery rules and consumer expectations on delivery speed. Localized micro-fulfillment and parcel locker networks complement electric vans and cargo bikes inside zero-emission zones, which reduces failed deliveries and smooths intraday peaks. These routes often integrate with port and airport gateways that channel high-value and time-sensitive flows to and from continental distribution networks.
Advanced Multimodal Connectivity Integrating Road, Rail, Inland Waterways, and Pipelines
The Netherlands maintains dense multimodal infrastructure, with inland waterways carrying 331.5 million tonnes in 2024 and containerized IWW cargo rising to 41.0 million tonnes, which stabilizes throughput when roads or rail face disruptions. Government policy supports inland shipping’s role in shifting flows away from congested highways, and this keeps long-haul legs efficient for maritime containers bound for the Rhine-Ruhr. Rotterdam’s hydrogen and CCS initiatives link energy-transition infrastructure to freight operations, which adds future optionality for bunkering and low-carbon trucking. These networks anchor the Netherlands freight and logistics market in integrated routing that balances speed, emissions, and cost across road, rail, barge, and pipeline. Shippers adopt barge and rail pre- and post-carriage where available to meet corporate emissions objectives under evolving European reporting rules.[2]UNCTAD, “Port Performance and Maritime Trade Facilitation,” unctad.org
Restraints Impact Analysis*
| Restraint | (~) % Impact on CAGR Forecast | Geographic Relevance | Impact Timeline |
|---|---|---|---|
| Driver Shortage and Warehouse Labor Gaps | -0.6% | National, most acute in Randstad | Short term (≤ 2 years) |
| Nitrogen Emission Caps Limiting New Builds | -0.4% | National, near Natura 2000 zones | Medium term (2-4 years) |
| High Land Costs and Space Limits in Randstad | -0.3% | Zuid-Holland, Noord-Holland, Utrecht | Long term (≥ 4 years) |
| Road Congestion on Key Freight Corridors | -0.3% | A2, A4, A12, A15 corridors and urban entries | Short term (≤ 2 years) |
| Source: Mordor Intelligence | |||
Acute Shortage of Truck Drivers and Warehouse Personnel Driving Wage Inflation
Persistent scarcity of qualified drivers and logistics staff raises labor costs and limits route flexibility in peak periods, which reinforces automation and network redesign across the Netherlands freight and logistics market. Wage scales for transport roles stepped up under the 2026 sector agreement, amplifying 2024–2025 adjustments and leaving operators to rebalance contracts and service levels. Contract logistics providers are deploying dense automation, such as automated storage and retrieval systems, to relieve warehouse labor constraints and improve pick rates inside constrained footprints. Fleet electrification projects and new service centers proceed with careful capacity planning to keep staffing and skills aligned with the zero-emission transition.[3]IRU, “Decarbonising Logistics: CEVA Plans,” iru.org Consolidation activities in road transport seek scale benefits that counter wage inflation through centralized maintenance and better asset utilization.
Strict Nitrogen Emission Caps Limiting Warehouse and Distribution Center Expansion
Tighter nitrogen rules have extended timelines for new logistics construction near protected Natura 2000 sites, which diverts investment into brownfield redevelopment that can leverage prior permits and existing grid connections. Operators with established facilities add contiguous capacity where zoning and utilities permit, as seen in near-port cold-chain expansions designed to serve food and life sciences flows. The constraint shifts attention to higher-value automation so that more volume can be handled within the current footprint of the Netherlands freight and logistics market. Local planning bodies weigh nitrogen impacts alongside municipal climate targets, which favors projects with strong emissions profiles and digital coordination with ports and terminals. Cold storage and pharma-compliant spaces that expand on existing sites help avoid lengthy new permitting processes while meeting rising demand for temperature-controlled logistics.
*Our forecasts treat driver/restraint impacts as directional, not additive. The impact forecasts reflect baseline growth, mix effects, and variable interactions.
Segment Analysis
By End User Industry: Manufacturing Dominates Amid Tech-Led Recovery and Chemical Restructuring
Manufacturing accounted for 31.74% of the Netherlands' freight and logistics market share in 2025, while wholesale and retail trade posted the fastest projected growth at 4.64% CAGR to 2031. Semiconductor equipment producers, defense-related programs, and high-tech components distribution reinforce demand for time-definite air freight for critical parts and for certified ground transport serving cleanroom standards in the Netherlands freight and logistics market. Chemical flows continue to evolve with the energy transition, which reduces certain oil product movements while increasing reverse logistics tied to circular and bio-based materials. Cold-chain needs in food processing and pharma support expansions in temperature-controlled capacity, which is aligned with near-port locations and cross-border distribution to Benelux and Germany. The Netherlands freight and logistics market maintains strong handling for high-value segments that require visibility and controlled environments.
Wholesale and retail trade’s growth reflects deep e-commerce penetration and cross-border shopping patterns, which push omnichannel warehouses to run at higher automation levels with extended cutoffs. CEVA and bol extended their partnership through 2029 across five Dutch locations totaling over 260,000 square meters, underscoring how major retailers rely on advanced fulfillment with high daily order throughput during peak seasons. Parcel lockers and open-network access that can serve multiple carriers compress last-mile van trips and enable reliable customer pickup in zero-emission zones. These choices keep delivery promises while supporting urban climate objectives within the Netherlands' freight and logistics industry.


By Logistics Function: Freight Transport Leads the Market While CEP Expands With E-commerce
Freight transport commanded 61.97% of the Netherlands' freight and logistics market share in 2025, aggregating road, rail, air, pipeline, and sea or inland waterway moves that form the backbone of national goods flows within the Netherlands' freight and logistics market size. Inland waterways carried 331.5 million tonnes in 2024, and containerized volumes reached 41.0 million tonnes, which provides cost-efficient hinterland access when other modes are constrained. Air cargo capacities serve high-value pharma and electronics with CEIV Pharma and GDP-compliant stations across the airport community, which secure reliability for time-definite shipments. Freight forwarders benefit from port and airport community systems that improve data timing and accuracy, which reduces dwell and administrative steps in clearance.
Courier, express, and parcel is the fastest growing logistics function at a projected 4.76% CAGR through 2031 as parcel lockers, electric vans, and cargo bikes align last mile operations with urban access and sustainability rules. Temperature-controlled warehousing is expanding capacity near key corridors and ports, including a 40% expansion at Bergen op Zoom that will lift capacity beyond 250,000 pallets upon completion in 2026. Complementary facilities from Americold extend cold chain coverage for pharma and FMCG across the country. This mix of heavy maritime flows, select air capacity for high-value goods, and accelerating CEP volumes positions the Netherlands freight and logistics market for balanced growth across modes and services.
Geography Analysis
Rotterdam’s seaport activity reinforces Zuid-Holland’s dominance, while Noord-Holland and Zeeland post strong inland waterway metrics within the EU by NUTS 2 comparison. Zuid-Holland handled 160.5 million tonnes of inland waterway freight in 2024, representing 17.3% of the EU total, and Noord-Holland handled 70.7 million tonnes or 7.6% of the EU total, which highlights the core role of the Randstad. Zeeland’s IWW intensity reflects North Sea Port connectivity and chemical product flows into the hinterland, which supports regional specialization in liquid bulk and diversified container trade. These patterns sustain an ecosystem in which maritime gateways, inland terminals, and urban nodes coordinate to manage high-volume corridors across the Netherlands' freight and logistics market.
Provinces along the German border leverage rail terminals and barge access to serve Rhine-Ruhr industries, creating resilient routing options when one mode is capacity-limited. Venlo and Tilburg function as critical consolidation points, supported by port-adjacent facilitation systems that streamline customs and transit data. The broader urban corridor around Amsterdam Schiphol sustains high-value flows in pharma and electronics that rely on certified handling and time-definite service. The Netherlands freight and logistics market continues to balance near-port activity with inland distribution platforms to reach Germany, Belgium, and France in one day.
Urban policy changes are shaping the geographic allocation of assets. Zero-emission zones expand from 18 to 29 municipalities in 2026, accelerating micro-hub and parcel locker deployment, which reduces van traffic and aids city access compliance. Locker networks near dense neighborhoods shorten route distances and compress delivery windows, allowing multi-carrier interoperability at key sites. Selective cold-chain expansions close to Rotterdam and Antwerp ports improve coverage for perishables and pharma across Benelux, Germany, and northern France. These investments reinforce the Netherlands' freight and logistics market’s spatial mix of gateway hubs and urban micro-fulfillment.
Competitive Landscape
Large integrators and specialized operators are adding capabilities in e‑commerce fulfillment, last‑mile delivery, air cargo handling, and cold‑chain capacity, which deepens competition across the Netherlands freight and logistics market. DHL Group completed a step acquisition to reach 100% ownership of Monta B.V., strengthening e-commerce fulfillment technology and plug-and-play infrastructure in the Netherlands. DHL also acquired a national parcel-station operator, deepening out-of-home capabilities aligned with zero-emission zones and consumer pickup trends. FedEx opened a new facility in Vianen with capacity and security features tuned for high-volume parcel and pallet flows, adding EV charging to support fleet transition. These moves sustain broad competition in CEP and contract logistics across the Netherlands' freight and logistics market.
Cold chain and high-compliance segments are expanding, with Lineage breaking ground on a 40% expansion at Bergen op Zoom to surpass 250,000 pallet positions by 2026, serving frozen food and pharma-adjacent flows under BREEAM Excellent standards. Americold’s Dutch sites add capacity for temperature-controlled goods that require 24/7 monitoring and validated process controls. In parallel, Schiphol’s cargo community is adding second-line handling capacity and integrating digital workflows to reduce truck emissions and waiting times around the airport. These investments reinforce competitive differentiation in pharma, perishables, and time-critical segments of the Netherlands freight and logistics market.
Technology-enabled fulfillment models continue to proliferate. CEVA renewed its multi-site contract with bol through 2029, emphasizing automation and data-driven orchestration at scale. New modular offerings give start-ups and scale-ups enterprise-grade services without long leases, which helps smaller brands compete on delivery speed and reliability. Broader decarbonization initiatives, including electric truck deployments and charging infrastructure, aim to align with municipal zero-emission targets while preserving high on-time performance for last-mile and regional legs. These developments sustain an intensely competitive Netherlands freight and logistics market in which scale, specialization, and digitalization are decisive.
Netherlands Freight And Logistics Industry Leaders
A.P. Moller - Maersk
Bleckmann Logistics
Broekman Logistics
C.H. Robinson
CMA CGM Group (Including CEVA Logistics)
- *Disclaimer: Major Players sorted in no particular order

Recent Industry Developments
- January 2026: Bleckmann launched “Bscale” in the Netherlands and the UK, offering modular, pay-as-you-grow warehousing and fulfillment with automation and same-day delivery without long-term lease commitments.
- June 2025: Lineage broke ground on a 40% capacity expansion of its fully automated cold-storage warehouse in Bergen op Zoom, increasing capacity to over 250,000 pallet positions upon completion in 2026. The site features BREEAM Excellent certification, rooftop solar, and on-site battery storage.
- April 2025: DHL Group acquired full ownership of Monta B.V. Group for €147 million. Monta, a Dutch e-commerce fulfillment company, enhances DHL's position in the growing e-commerce logistics sector.
- April 2025: DSV acquired DB Schenker for €14.3 billion, creating the largest logistics group globally with €41.6 billion in revenue. The deal strengthens DSV-Schenker as Europe's top road feeder network operator. The DB Schenker brand will phase out by 2027, impacting the Netherlands' logistics market.


Netherlands Freight And Logistics Market Report Scope
Agriculture, Fishing, and Forestry, Construction, Manufacturing, Oil and Gas, Mining and Quarrying, Wholesale and Retail Trade, and Others are covered as segments by End User Industry. Courier, Express, and Parcel (CEP), Freight Forwarding, Freight Transport, Warehousing, Storage, and other services are covered as segments by Logistics Function in the Netherlands Freight and Logistics Market.
End User Industry
| Agriculture, Fishing, and Forestry |
| Construction |
| Manufacturing |
| Oil and Gas, Mining and Quarrying |
| Wholesale and Retail Trade |
| Others |
Logistics Function
| Courier, Express, and Parcel (CEP) | Domestic |
| International | |
| Freight Forwarding | |
| Freight Transport | Air |
| Pipelines | |
| Rail | |
| Road | |
| Sea and Inland Waterways | |
| Warehousing and Storage | Non-Temperature Controlled |
| Temperature Controlled | |
| Other Services |
| End User Industry | Agriculture, Fishing, and Forestry | |
| Construction | ||
| Manufacturing | ||
| Oil and Gas, Mining and Quarrying | ||
| Wholesale and Retail Trade | ||
| Others | ||
| Logistics Function | Courier, Express, and Parcel (CEP) | Domestic |
| International | ||
| Freight Forwarding | ||
| Freight Transport | Air | |
| Pipelines | ||
| Rail | ||
| Road | ||
| Sea and Inland Waterways | ||
| Warehousing and Storage | Non-Temperature Controlled | |
| Temperature Controlled | ||
| Other Services | ||


Market Definition
- Agriculture, Fishing, and Forestry (AFF) - This end user industry segment captures the external (outsourced) logistics expenditure incurred by the AFF industry players. The end user players considered are the establishments primarily engaged in growing crops, raising animals, harvesting timber, harvesting fish & other animals from their natural habitats and providing related support activities. Herein, Logistics Service Providers (LSPs) play a crucial role in acquisition, storage, handling, transportation, and distribution activities for the optimal & continuous flow of inputs (seeds, pesticides, fertilizers, equipment, and water) from manufacturers or suppliers to the producers and smooth flow of output (produce, agro-goods) to distributors/ consumers. This includes both termperature controlled and non-temperature controlled logistics, as and when required according to the shelf life of goods being transported or stored.
- Construction - This end user industry segment captures the external (outsourced) logistics expenditure incurred by the construction industry players. The end user players considered are the establishments primarily engaged in constructing, repairing and renovating residential & commercial buildings, infrastructure, engineering works, subdividing and developing land. Logistics Service Providers (LSPs) play a crucial role in increasing profitability of construction projects by maintaing the inventory of raw materials & equipment, time-critical supplies and by providing other value added services for effective project management.
- Courier, Express, and Parcel - The Courier, Express, and Parcel services, often called as CEP Market, refers to the logistics and postal service providers which specialize in moving small goods (parcels/packages). It captures the overall market size (USD) and market volume (number of parcels) of (1) the shipments/parcels/packages which are under 70kgs/ 154lbs weight, (2) Business Customer packages viz. Business-to-Business (B2B) & Business-to-Consumer (B2C) as well as private customer packages (C2C), (3) non-express parcel delivery services (Standard and Deferred) as well as express parcel delivery services (Day-Definite-Express and Time-Definite-Express), (4) domestic as well as international parcels.
- Demographics - To analyse total addressable market demand, population growth & forecasts have been studied and presented in this industry trend. It represents population distribution across categories like gender (male/female), development area (urban/rural), major cities among other key parameters like population density and final consumption expenditure (growth and share % of GDP). This data has been used for assessing the fluctations in demand & consumption expenditure, and the major hotspots (cities) of potential demand.
- Export Trends and Import Trends - Overall logistics performance of an economy is positively and significantly (statistically) correlated to its trade performance (exports and imports). Hence, in this industry trend, total value of trade, major commodities/ commodity groups and the major trade partners, for the studied geography (country or region as per the scope of report) have been analysed alongside the impact of major trade/logistics infrastructure investments & regulatory environment.
- Freight Forwarding - Freight forwarding which herein refers to the freight transportation arrangement (FTA) industry includes establishments primarily engaged in arranging & tracking transportation of freight between shippers and carriers. Logistics Service Providers (LSPs) considered are freight forwarders, NVOCCs, custom brokers and marine shipping agents. Others segment under Freight Forwarding captures the revenue earned through value added services of FTA like custom brokerage/clearance activities, preparation of freight related documentation, consolidation-deconsolidation of goods, cargo insurance & compliance, arrangement of warehousing & storage, liasing with shippers, and freight forwarding through other modes of transport viz. road and rail.
- Freight Pricing Trends - Freight pricing by mode of transport (USD/tonkm), over the review period, has been presented in this industry trend. The data has been used in assessing the inflationary environment, impact on trade, freight turnover (tonkm), freight and logistics market demand by mode of transport segments and hence the overall freight and logistics market size.
- Freight Tonnage Trends - Freight tonnage (weight of goods in tons) handled by mode of transport, over the review period, has been presented in this industry trend. The data has been used as one of the parameters apart from average distance per shipment (km), freight volume (tonkm), and freight pricing (USD/tonkm) to assess the freight transport market size.
- Freight Transport - Freight Transport refers to the hiring of a logistics service provider (outsourced logistics) for the transport of commodities (raw materials/final/intermediate/finished goods including both solids and fluids) from the origin to a destination within the country (domestic) or cross-border (international).
- Freight and Logistics - External expenditure on (or outsourced) facilitation of freight transport (freight transportation), arrangement of freight transport through an agent (freight forwarding), warehousing and storage (temperature controlled or non-temperature controlled), CEP (domestic or international courier, express and parcel) and other value-added logistics services involved in the transportation of commodities (raw materials or finished goods including both solids and fluids) from the origin to a destination within the country (domestic) or cross-border (international), through one or more modes of transportation viz. road, rail, sea, air and pipelines constitute freight and logistics market.
- Fuel Price - Fuel price spikes can cause delays and diruption for logistics service providers (LSPs), while drops in the same can result in higher short-term profitability and increased market rivalry to offer consumers with the best deals. Hence, the fuel price variations have been studied over the review period and presented along with the causes as well as market impacts.
- GDP Distribution by Economic Activity - Nominal Gross Domestic Product and distribution of the same, across major economic sectors in the geography studied (country or region as per scope of the report) have been studied and presented in this industry trend. As GDP is positively related to the profitability and growth of logistics industry, this data has been used in adjunction to the input-output tables/ supply-use tables for analyzing the potential major contributing sectors towards the logistics demand.
- GDP Growth by Economic Activity - Growth of Nominal Gross Domestic Product across major economic sectors, for the geography studied (country or region as per scope of the report) have been presented in this industry trend. This data has been utilized for assessing the growth of logistics demand from all the market end users (economic sectors considered here).
- Inflation - Variations in both Wholesale Price Inflation (YoY change in producer price index) and Consumer Price Inflation have been presented in this industry trend. This data has been used to assess the inflationary environment as it plays a vital role in smooth functioning of the supply chain, directly impacting the logistics operational cost components e.g., pricing of tyres, driver wages & benefits, energy/fuel prices, maintenace costs, toll charges, warehousing rents, custom brokerage, forwarding rates, courier rates etc. hence impacting the overall freight and logistics market.
- Infrastructure - As infrastructure plays a vital role in an economy's logistics performance, variables like length of roads, distribution of road length by surface category (paved v/s unpaved), distribution of road length by road classification (expressways v/s highways v/s other roads), rail length, volume of containers handled by major ports and tonnage handled by major airports have been analysed and presented in this industry trend.
- Key Industry Trends - The report section named "Key Industry Trends" include all the key variables/parameters studied to better analyze the market size estimates and forecasts. All the trends have been presented in the form of data points (time series or latest available data points) along with analysis of the paramter in the form of concise market relevant commentary, for the geography studied (country or region as per the scope of report).
- Key Strategic Moves - The action taken by a company to differentiate from its competitor or used as a general strategy is referred to as a key strategic move (KSM). This includes (1) Agreements (2) Expansions (3) Financial Restructuring (4) Mergers and Acquisitions (5) Partnerships, and (6) Product Innovations. Key players (Logistics Service Providers, LSPs) in the market have been shortlisted, their KSM have been studied and presented in this section.
- Liner Shipping Bilateral Connectivity Index - It indicates a country pair's integration level into global liner shipping networks and plays a crucial role in determining bilateral trade, which in turn potentially contributes toward the prosperity of a country and its surrounding region. Hence the major economies connected to the country/ region as per scope of the report, have been analyzed and presented in "Liner Shipping Connectivity" industry trend.
- Liner Shipping Connectivity - This industry trend analyses the state of connectivity to the global shipping networks based on the status of maritime transport sector. It includes the analysis of liner shipping connectivity, bilateral shipping connectivity, and port liner shipping connectivity indices for the geography (country/ region as per scope of the report) over the review period.
- Liner Shipping Connectivity Index - It indicates how well countries are connected to global shipping networks based on the status of their maritime transport sector. It is based on five components of the maritime transport sector: (1) The number of shipping lines servicing a country, (2) The size of the largest vessel used on these services (in TEUs), (3) The number of services connecting a country to the other countries, (4) The total number of vessels deployed in a country, (5) The total capacity of those vessels (in TEUs).
- Logistics Performance - Logistics Performance and Logistics Costs are the backbone of trade, and influences trade costs, making countries compete globally. Logistics performance is influenced by market wide adopted supply chain management strategies, government services, investments & policies, fuel/ energy costs, inflationary environment etc. Hence, in this industry trend, the logistics performance of the geography studied (country/ region as per the scope of report) has been analysed and presented over the review period.
- Major Truck Suppliers - Market share of truck brands is influenced by factors like geographical preferences, portfolio of truck types, truck prices, local production, truck repair & maintenance service peneteration, customer support, technological innovations (like electric vehicles, digitalization, autonomous trucks), fuel efficiency, financing options, annual maintenance costs, availability of substitutes, marketing startegies etc. Hence, the distribution (share % for base year of the study) of truck sales volume for leading truck brands and commentary on current market scenario & market anticipation over the forecast period have been presented in this industry trend.
- Manufacturing - This end user industry segment captures the external (outsourced) logistics expenditure incurred by the Manufacturing industry players. The end user players considered are the establishments primarily engaged in the chemical, mechanical or physical transformation of materials or substances into new products. Logistics Service Providers (LSPs) play a crucial role in maintaining a smooth flow of raw materials across the supply chain, enabling timely delivery of finished goods to distributors or end customers and storing & supplying the raw materials to clients for just-in-time manufacturing.
- Maritime Fleet Load Carrying Capacity - Maritime fleet load carrying capacity depicts the development state of an economy's maritime infrastructure & trade. It is influenced by factors like volume of production, international trade, major end user industries, maritime connectivity, environmental regulations, investments in port infrastructure development, port container cargo handling capacity etc. This industry trend represents the maritime fleet load carrying capacity by type of ship viz. container ships, oil tankers, bulk carriers, general cargo, among other types alongwith the influencing factors for the geography studied (country/ region as per scope of the report), over the review period.
- Modal Share - Freight Modal Share is influenced by factors like modal productivity, government regulations, containerization, distance of shipment, temperature control requirements, type of goods, international trade, terrain, speed of delivery, shipment weight, bulk shipments, etc. Also, modal share by tonnage (tons) and modal share by freight turnover (ton-km) differ as per average distance of shipments, weight of major commodity groups transported in the economy and number of trips. This industry trend represents the distribution of freight transported by mode of transport (tons as well as ton-km), for the study base year.
- Oil and Gas, Mining and Quarrying - This end user industry segment captures the external (outsourced) logistics expenditure incurred by the extraction industry players. The end user players considered are the establishments that extract naturally occurring mineral solids, such as coal and ores; liquid minerals, such as crude petroleum; and gases, such as natural gas. Logistics Service Providers (LSPs) covers entire phases from upstream to downstream and plays a crucial role in the transportation of machinery, drilling equipments, extracted minerals, crude oil & natural gas and refined/ processed products from one place to another.
- Other End Users - Other end user segment captures the external (outsourced) logistics expenditure incurred by the financial services (BFSI), real estate, educational services, healthcare, and professional services (administrative, waste management, legal, architectural, engineering, design, consulting, scientific R&D). Logistics Service Providers (LSPs) plays a crucial role in the reliable movement of supplies and documents to/from these industries such as transporting any equipment or resources required, shipping confidential documents and files, movement of medical goods & supplies (surgical supplies and instruments, including gloves, masks, syringes, equipment) to name a few.
- Other Services - Other Services segment captures revenue earned through (1) Value added services (VAS) for freight transportation by road, rail, air and sea & inland waterways, (2) VAS for marine cargo transportation (operation of terminal facilities such as harbours and piers, operation of waterway locks, navigation, pilotage and berthing activities, lighterage, salvage activities, lighthouse activities, among other miscellaneous support activities), (3) VAS for land freight transportation (operation of terminal facilities such as railway stations, stations for the handling of goods, operation of railroad infrastructure, switching and shunting, towing and road side assistance, liquefaction of gas for transportation purposes, among other miscellaneous support activities), (4) VAS for air cargo transportation (operation of terminal facilities such as airway terminals, airport and air-traffic-control activities, ground service activities on airfields, runway maintenance, inspection/ ferrying/ maintenance/ testing of aircrafts, aircraft fuelling services, among other miscellaneous support activities), (5) VAS for warehousing and storage service (operation of grain silos, general merchandise warehouses, refrigerated warehouses, storage tanks etc., storage of goods in foreign trade zones, blast freezing, crating goods for shipping, packing and preparing goods for shipping, labelling and/or imprinting the package, kit assembling and packaging services, among other miscellaneous support activities), and (6) VAS for courier, express and parcel service (pickup, sorting).
- Port Calls and Performance - The performance of ports is key to an economy's freight movement, trade, global connectivity, successful growth strategies, investment attractiveness for production & distribution systems, and thus affects GDP, employment, per capita income and industrial growth. Hence, the port perfomance parameters like median time spent by vessels in the ports; average age, size, cargo carrying capacity, container carrying capacity, of vessels entering the ports, port calls, and container port throughput have been analysed and presented in this industry trend.
- Port Liner Shipping Connectivity Index - It reflects a port's position in the global liner shipping network, wherein a higher value of index is associated with better connectivity. Efficient and well-connected ports (1) contribute towards minimizing transport costs, linking supply chains and supporting international trade, (2) pave the way for economies of scale and development of expertise by permitting producers to better exploit possibilities in domestic as well as foreign markets. Hence the major ports of strategic importance, in the country/ region as per scope of the report, have been analyzed and presented in "Liner Shipping Connectivity" industry trend.
- Port Throughput - It reflects the amount of cargo or number of vessels a port handles annually. It can be related to (1) cargo tonnage, (2) container TEU, and (3) vessel calls. Port throughput in terms of total containers handled (TEU's), has been presented in the "Port Calls and Performance" industry trend.
- Producer Price Inflation - It indicates inflation from viewpoint of the producers viz. the average selling price received for their output over a period of time. Annual change (YoY) of producer price index is reported as wholesale price inflation in the "Inflation" industry trend. As WPI captures dynamic price movements in most comprehensive way, it is widely used by governments, banks, industry, business circles and is deemed important in formulation of trade, fiscal and other economic policies. The data has been used in adjunction to consumer price inflation for better understanding the inflationary environment.
- Segmental Revenue - Segmental Revenue has been triangulated or computed and presented for all the major players in the market. It refers to the freight and logistics market specific revenue earned by the company, over the base year of study, in the geography studied (country or region as per the scope of report). It is computed through the study and analysis of major parameters like financials, service portfolio, employee strength, fleet size, investments, number of countries present in, major economies of concern, etc. that have been reported by the company in its annual reports, webpage. For companies having scarce financial disclosures, paid databases like D&B Hoovers, Dow Jones Factiva have been resorted to and verified through industry/expert interactions.
- Transport and Storage Sector GDP - Value and growth of Transport and Storage Sector GDP has a direct relation to the freight and logistics market size. Hence, this variable has been studied and presented over the review period, in value terms (USD) and as share % of total GDP, in this industry trend. The data has been supported by concise and relevant commentary around the investments, developments, and current market scenario.
- Trends in E-Commerce Industry - Enhanced internet connectivity and boom in smartphone penetration, coupled with increasing disposable incomes, has led to a phenomenal growth in the e-commerce market globally. Online shoppers require fast and efficient delivery of their orders leading to an increase in the demand for logistics services especially e-commerce fulfilment services. Hence, the Gross Merchandise Value (GMV), historial and projected growth, breakup of major commodity groups in e-commerce industry for the studied geography (country or region as per scope of the report) have been analysed and presented in this industry trend.
- Trends in Manufacturing Industry - Manufacturing industry involves the transformation of raw materials into finished products, while logistics industry ensures the efficient flow of raw materials to the factory, and the transport of manufactured products to the distributors & consumers. Demand-Supply of both industries are highly cross-linked and critical for a seamless supply chain. Hence, the Gross Value Added (GVA), breakup of GVA into major manufacturing sectors, and growth of manufacturing industry over the review period have been analysed and presented, in this industry trend.
- Trucking Fleet Size By Type - Market share of truck types is influenced by factors like geographical preferences, major end user industries, truck prices, local production, truck repair & maintenance service peneteration, customer support, technological disruptions (like electric vehicles, digitalization, autonomous trucks) etc. Hence, the distribution (share % for base year of study) of truck parc volume by type of truck, market disruptors, truck manufacturing investments, truck specifications, truck use & import regulations, and market anticipation over the forecast period have been presented in this industry trend.
- Trucking Operational Costs - The prime reasons for measuring/ benchmarking logistics performance of any trucking company are to reduce operational costs and increase profitability. On the other hand, measuring operational costs helps to identify whether and where to make operational changes to control expenses and identify areas for improved performance. Hence, in this industry trend, trucking operational costs and the variables involved viz. driver wages & benefits, fuel prices, repairs & maintenance costs, tyre costs etc. have been studied over the base year of study, and presented for the geography studied (country or region as per the scope of report).
- Warehousing and Storage - Warehousing and storage segment captures revenue earned through the operation of general merchandise, refrigerated and other types of warehousing & storage facilities. These establishments take responsibility for storing the goods and keeping them secure in lieu of charges. Value added services (VAS) they may provide are considered to be a part of the "other services" segment. Here VAS refer to a range of services, related to the distribution of a customer's goods and can include labelling, breaking bulk, inventory control & management, light assembly, order entry & fulfillment, packaging, pick & pack, price marking & ticketing and transportation arrangement.
- Wholesale and Retail Trade - This end user industry segment captures the external (outsourced) logistics expenditure incurred by the wholesalers and retailers. The end user players considered are the establishments primarily engaged in wholesaling or retailing merchandise, generally without transformation, and rendering services incidental to the sale of merchandise. Logistics Service Providers (LSPs) plays a crucial role in the reliable movement of supplies to and finished products from production houses to the distributors and finally to the end customer covering activites like material sourcing, transportation, order fulfillment, warehousing & storage, demand forecasting, inventory management etc.
| Keyword | Definition |
|---|---|
| Axle Load | The axle load of a wheeled vehicle is the total weight bearing on the roadway for all wheels connected to a given axle. |
| Back Haul | Backhaul is the return movement of a transport vehicle from its original destination to its original point of departure. |
| Bill of Lading | A bill of lading is a legal document issued by a carrier to a shipper that details the type, quantity, and destination of the goods being carried. |
| Bunkering | Bunkering is the process of supplying fuel and/or gasoil to be used to power the propulsion system of a ship (such fuel is referred to as bunker). It includes the logistics of loading and distributing the fuel among available shipboard tanks. A person dealing in trade of bunker (fuel) is called a bunker trader. |
| Bunkering Service | Bunkering service is the supply of a requested quality and quantity of bunkers to a ship. |
| C-commerce | C-commerce (Collaborative commerce) describes electronically enabled business interactions among an enterprise’s internal personnel, business partners and customers throughout a trading community. The trading community could be an industry, industry segment, supply chain or supply chain segment. |
| Cabotage | Transport by a vehicle registered in a country performed on the national territory of another country. |
| Cartage Agent | A ground transportation service that provides pickup and delivery of freight in locations not served directly by an air or ocean carrier. |
| Contract logistics | Contract logistics refers to the outsourcing of resource management tasks by one company to a third-party company specializing in logistical matters, such as transportation, warehousing, and order fulfillment. |
| Courier | A business that is used to send messages, packages, etc. Courier service refers to the fast or quick, door to door pickup and delivery service for goods or documents. It can be local or international. A company that provides such delivery services is called a courier company. A courier company hires people to provide their services. Such a person hired by the courier service company is called a courier. |
| Cross docking | Cross docking is a practice in logistics management that includes unloading incoming delivery vehicles and loading the materials directly into outbound delivery vehicles, omitting traditional warehouse logistical practices and saving time and money. |
| Cross Trade | International transport between two different countries performed by a vehicle registered in a third country. A third country is a country other than the country of loading/embarkation and than the country of unloading/disembarkation. |
| Customs Clearance | The procedures involved in getting cargo released by Customs through designated formalities such as presenting import license/permit, payment of import duties and other required documentations by the nature of the cargo such as FCC or FDA approval. |
| Customs seal | Customs seal means a seal, stamp or any other preventive means affixed by customs officials to ensure the inviolability of goods, commercial means of transport or warehouses. |
| Dangerous Goods | Dangerous goods (or hazardous materials or HAZMAT) include flammable liquids/solids, gases, compressed, liquified, dissolved under pressure, corrosives, oxidising substances, explosive substances and articles, substances, which on contact with water, emit flammable gasses, organic peroxides, toxic substances, infectious substances, radioactive materials, miscellaneous dangerous goods and articles. |
| Direct Shipment | Direct shipment is a method of delivering goods from the supplier or the product owner to the customer directly. In most cases, the customer orders the goods from the product owner. This delivery scheme reduces transportation and storage costs, but requires additional planning and administration. |
| Drayage | A drayage is a form of trucking service that connects the different modes of shipping (intermodal), such as ocean freight or air freight. It’s a short-haul trip that transports goods from one place to another, usually before or after its long-haul shipping process. Drayage trucks move cargo to and from various destinations, such as container ships, storage lots, order fulfillment warehouses, and rail yards. Typically, drayage only transports goods in short distances and operates only in one metropolitan area. It also requires only one trucker in a single shift. |
| Dry Docking | Dry docking is a term used for repairs or when a ship is taken to the service yard. During dry docking, the whole ship is brought to a dry land so that the submerged portions of the hull can be cleaned or inspected. |
| Dry van | A dry van is a type of semi-trailer that's fully enclosed to protect shipments from outside elements. Designed to carry palletized, boxed or loose freight, dry vans aren't temperature-controlled (unlike refrigerated “reefer” units) and can't carry oversized shipments (unlike flatbed trailers). |
| Feedering | Transport service whereby loaded or empty containers in a regional are transferred to a “mother ship” for a long-haul ocean voyage. |
| Final Demand | Final demand includes all types of commodities (goods as well as services) consumed as final use and might include personal consumption, or consumption by government, by businesses as capital investment, and as exports. includes all types of commodities (goods as well as services) consumed as final use and might include personal consumption, or consumption by government, by businesses as capital investment, and as exports. |
| First mile Delivery | First mile delivery refers to the first stage of the transportation. This is when the parcel leaves the seller’s warehouse and is taken by the courier pick up agent to process it or take it to the warehouse. Once the package reaches the post office or the courier’s hub, it is then sorted and transported further until it reaches the customer’s doorstep. |
| Fiscal storage services | It means a facility, clearly separated from other premises, where the excise goods are produced, processed, held, received or dispatched under a duty suspension arrangement by an authorized depositor, in the course of his business, under conditions laid down by the customs authorities. |
| Flat Bed | It has a back body that is flatly shaped for easy loading and unloading of goods. The flatbed truck is mostly used to transport heavy, oversized, wide and indelicate goods. |
| Flatbed Truck | A flatbed truck is a type of truck with rigid design. It has a back body that is flatly shaped for easy loading and unloading of goods. The flatbed truck is mostly used to transport heavy, oversized, wide and indelicate goods such as machinery, building supplies or equipment. Due to the truck open body, the goods transported with it must not be vulnerable to rain. By functionality, the flatbed truck is comparable to a flatbed trailer. |
| Freight Transit Time | Transit time is how long it takes for a shipment to be delivered to its final destination after being picked up from a designated pick up point. |
| Halal Logistics | It refers to the process of managing the logistics operations such as fleet management, storage/warehousing, and materials handling according to the principles of Shariah law in ensuring the integrity of the halal products at the point of consumption. |
| Haulage | The commercial transport of goods. |
| Inbound Logistics | Inbound logistics is the way materials and other goods are brought into a company. This process includes the steps to order, receive, store, transport and manage incoming supplies. Inbound logistics focuses on the supply part of the supply-demand equation. |
| Intermediate Demand | Intermediate demand includes goods, services, and maintenance and repair construction sold to businesses, excluding capital investment. |
| International Loaded | Place of loading of goods in reporting country (i.e., country in which the vehicle performing the transport is registered) and place of unloading in a different country. |
| International Unloaded | Place of unloading of goods in reporting country (i.e., country in which the vehicle performing the transport is registered) and place of loading in a different country. |
| Last Mile Delivery | Last mile delivery refers to the very last step of the delivery process when a parcel is moved from a transportation hub to its final destination—which, usually, is a personal residence or retail store. |
| Less than-Truck-Load (LTL) | Less-than-truckload, also known as less-than-load (LTL), is a shipping service for relatively small loads or quantities of freight. An LTL provider combines the loads and shipping requirements of several different companies on their trucks, using a hub-and-spoke system to get goods to their destinations. |
| Locomotives Haluage | The transport of coal, ore, workers, and materials underground by means of locomotive-hauled mine cars. The locomotive may be powered by battery, diesel, compressed air, trolley, or some combination such as battery-trolley or trolley-cable reel. |
| Milkrun | A Milk Run is a delivery method used to transport mixed loads from various suppliers to one customer. Instead of each supplier sending a truck every week to meet the needs of one customer, one truck (or vehicle) visits the suppliers to pick up the loads for that customer. This method of transport got its name from the dairy industry practice, where one tanker used to collect milk from several dairy farms for delivery to a milk processing company. |
| Multi country consolidation | Multi-Country Consolidation (MCC) is a cost-effective solution that consolidates ones cargo from different countries of origin to build Full Container Loads (FCL). MCC is most suitable for companies that import light volumes of goods from multiple countries but want to take advantage of the more economic FCL freight rates. |
| Multi-Modal Logistics | Multimodal transportation or multimodal shipping refers to logistics and freight processes that require multiple modes of transportation. |
| Omni Channel Logistics | Omnichannel distribution is a multichannel approach taken by companies to give customers a way to purchase and receive orders from several sales channels with one-touch seamless integration. Some of the ways include- 1. Buy online, then pick-up at the brick and mortar store; 2. Buy online, then have it delivered to the home or another location; 3.In store purchase, with the delivery either to the home or another location; 4. Drop ship from a warehouse or manufacturing center to store, home or other location; 5.Buy online, then return at store or online; 6. Buy online, then return online. |
| OOG cargo | Out of Gauge (OOG) cargo is any cargo that can not be loaded into six-sided shipping containers simply because it is too large. The term is a very loose classification of all cargo with dimensions beyond the maximum 40HC container dimensions. That is a length beyond 12.05 meters – a width beyond 2.33 meters – or a height beyond 2.59 meters. |
| Other ships | Other ships include: Liquefied petroleum gas carriers, liquefied natural gas carriers, parcel (chemical) tankers, specialized tankers, reefers, offshore supply vessels, tugboats, dredgers, cruise, ferries, other non-cargo ships |
| Other Specialised Cargo | Other specialised goods include pre-slung goods (Goods, one or more items, supplied with a sling or slings), mobile units (Mobile Self Propelled Units, Non Self Propelled Units, unrolled vehicles), oversized equipment load (light and heavy machinery that is often too big or too heavy), high value freight that needs extra protection like electronics, financial services road freight. |
| Outsourced Freight Transport | Transport for hire or reward; The carriage for remuneration of goods. |
| Pallets | Raised platform, intended to facilitate the lifting and stacking of goods. |
| Part load | A part load describes goods which only fills a truck partially. In essence, the quantity of the shipment is bigger than the Less Than Truckload (LTL) shipment. Also, the shipment cannot fully occupy a truck i.e. its capacity is much lower than a Full Truckload (FTL) shipment. |
| Paved Road | Road surfaced with crushed stone (macadam) with hydrocarbon binder or bituminized agents, with concrete or with cobblestone. |
| Q-commerce | Q-commerce, also referred to as quick commerce, is a type of e-commerce where emphasis is on quick deliveries, typically in less than an hour. |
| Quay | A stone or metal platform lying alongside or projecting into water for loading and unloading ships. |
| Recommerce | Recommerce is the selling of previously owned items through online marketplaces to buyers who reuse, recycle or resell them. |
| ReverseLogistics | Reverse logistics is a type of supply chain management that moves goods from customers back to the sellers or manufacturers. |
| Road Freight Transport Service | Hiring a trucking agency for transport of commodities (raw materials or manufactured goods including both solids and liquids) form the origin to a destination within the country (domestic) or cross-border (international) constitutes road freight transport market. The service might be Full-Truck-Load or Less than-Truck-Load, containerized or non-containerized, temperature controlled or non temperature controlled, short haul or long haul. |
| Roll-on/roll-off cargo | Roll-on/roll-off (RORO or ro-ro) ships are cargo ships designed to carry wheeled cargo, such as cars, motorcycles, trucks, semi-trailer trucks, buses, trailers, and railroad cars, that are driven on and off the ship on their own wheels or using a platform vehicle, such as a self-propelled modular transporter. |
| Swap bodies | A swap body, swop body, exchangeable container or interchangeable unit, is one of the types of standard freight containers for road and rail transport. |
| Tank Barge | A non-self-propelled vessel constructed or adapted primarily to carry liquid, solid or gaseous commodities or cargos in bulk in cargo spaces (or tanks) through rivers and inland waterways, and may occasionally carry commodities or cargos through oceans and seas when in transit from one inland waterway to another. The commodities or cargos transported are in direct contact with the tank interior. |
| Tautliner vehicle | Tautliner and curtainsider are used as generic names for curtain sided trucks/trailers. The curtains are permanently fixed to a runner at the top and detachable rails/poles at front and rear, allowing the curtains to be drawn open and forklifts used all along the sides for easy and efficient loading and unloading. When closed for travel, vertical load restraint straps are attached to a rope rail beneath the truck bed, connecting the truck bed and curtain along both sides. Winches at either end of the curtain tension it, hence the 'Tautliner' name. This stops the curtain from flapping or drumming in the wind and can also help retain light loads from slipping sideways. |
| Transloading | Transloading is a shipping term that refers to the transfer of goods from one mode of transportation to another en route to their ultimate destination. |
| Tsubo | A Japanese unit of area equal to 35.58 square feet. |
| Unpaved Road | Road with a stabilized base not surfaced with crushed stone, hydrocarbon binder or bituminized agents, concrete or cobblestone. |
| Vessel Husbandry Services | It includes ship maintenance, repairs, cleaning, upkeep of the hull and rigging and equipment. |


Research Methodology
Mordor Intelligence follows a four-step methodology in all our reports.
- Step-1: Identify Key Variables: In order to build a robust forecasting methodology, the variables and factors identified in Step-1 are tested against available historical market numbers. Through an iterative process, the variables required for market forecast are set and the model is built on the basis of these variables.
- Step-2: Build a Market Model: Market-size estimations for the forecast years are in nominal terms. Inflation is not a part of the pricing, and the average selling price (ASP) is kept constant throughout the forecast period for each country.
- Step-3: Validate and Finalize: In this important step, all market numbers, variables and analyst calls are validated through an extensive network of primary research experts from the market studied. The respondents are selected across levels and functions to generate a holistic picture of the market studied.
- Step-4: Research Outputs: Syndicated Reports, Custom Consulting Assignments, Databases & Subscription Platforms


