
Mixed-Reality Quality Assurance Systems Market Size and Share
Market Overview
| Study Period | 2020 - 2031 |
|---|---|
| Market Size (2026) | USD 467.11 Million |
| Market Size (2031) | USD 938.91 Million |
| Growth Rate (2026 - 2031) | 14.98 % |
| Fastest Growing Market | Asia-Pacific |
| Largest Market | North America |
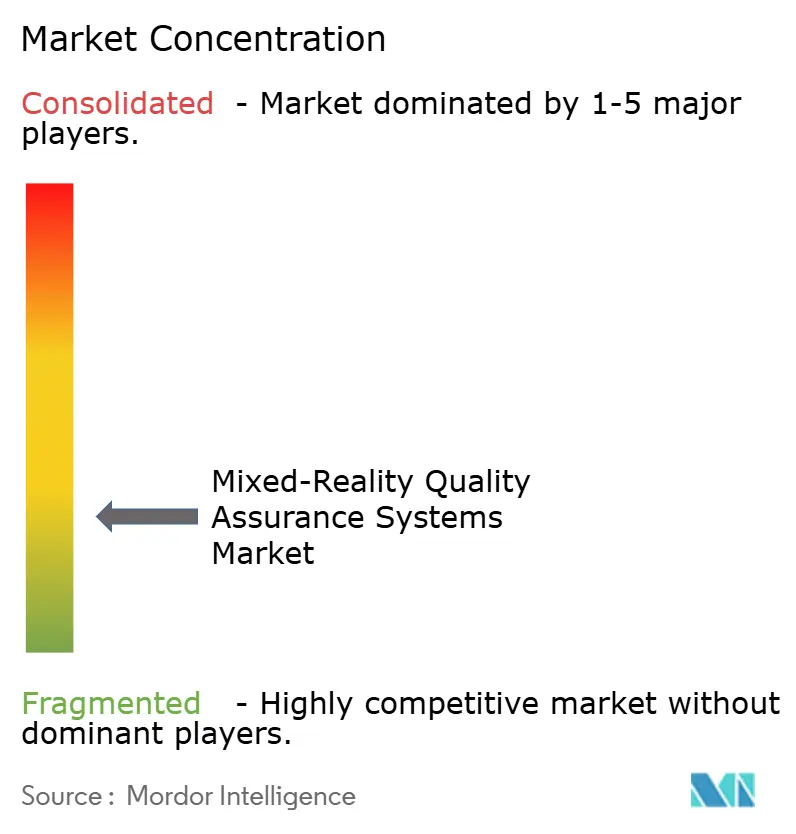
| Market Concentration | Low |
Major Players *Disclaimer: Major Players sorted in no particular order Image © Mordor Intelligence. Reuse requires attribution under CC BY 4.0. | |
Mixed-Reality Quality Assurance Systems Market Analysis by Mordor Intelligence
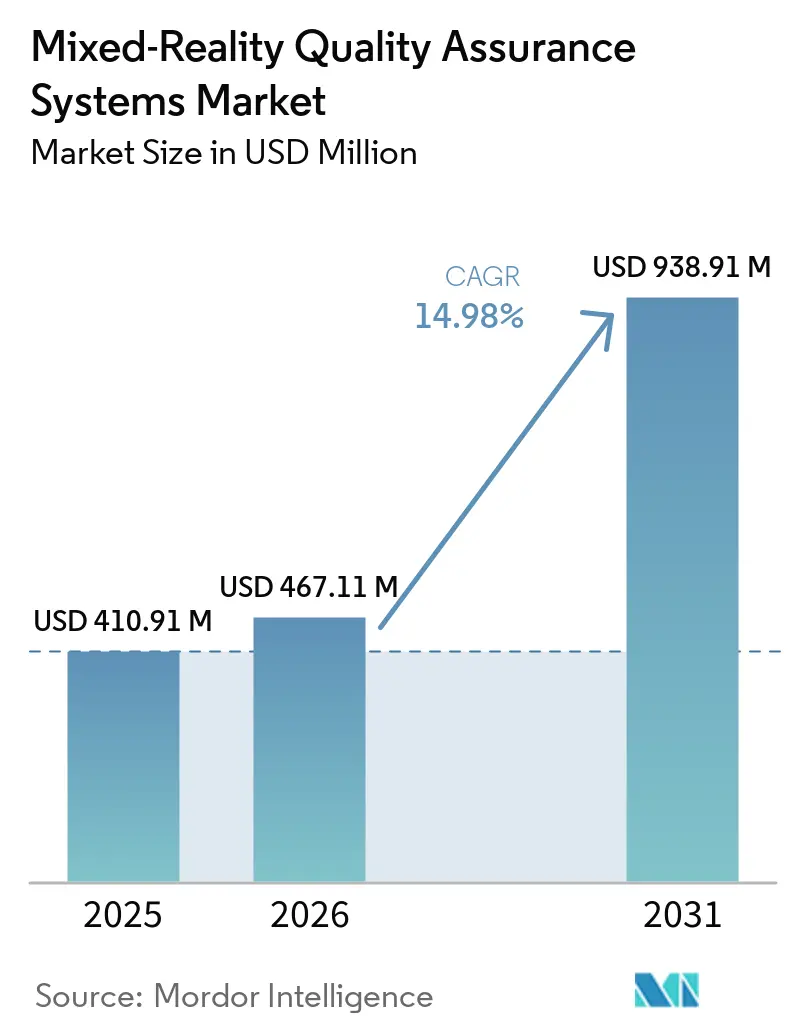
The Mixed-Reality Quality Assurance Systems Market size is projected to expand from USD 410.91 million in 2025 to USD 467.11 million in 2026, and to USD 938.91 million by 2031, registering a CAGR of 14.98% between 2026 and 2031. Demand is tied to enterprise use of AR and MR devices for inspection, remote work, and surgical guidance, where optical, sensor, or connectivity failures can have material operational consequences. The Mixed-Reality Quality Assurance Systems Market is also shaped by the move from prototype XR devices to commercial products that require optical, connectivity, and safety validation before shipment. Smaller near-eye displays, waveguide production, and low-latency network features expand both the number and the complexity of required tests. Vendors are responding by combining optical measurement, connectivity testing, and software validation in more integrated offerings. The outlook remains exposed to slower enterprise headset adoption and to the lack of common human-factors standards for healthcare and aerospace approvals.
Key Report Takeaways
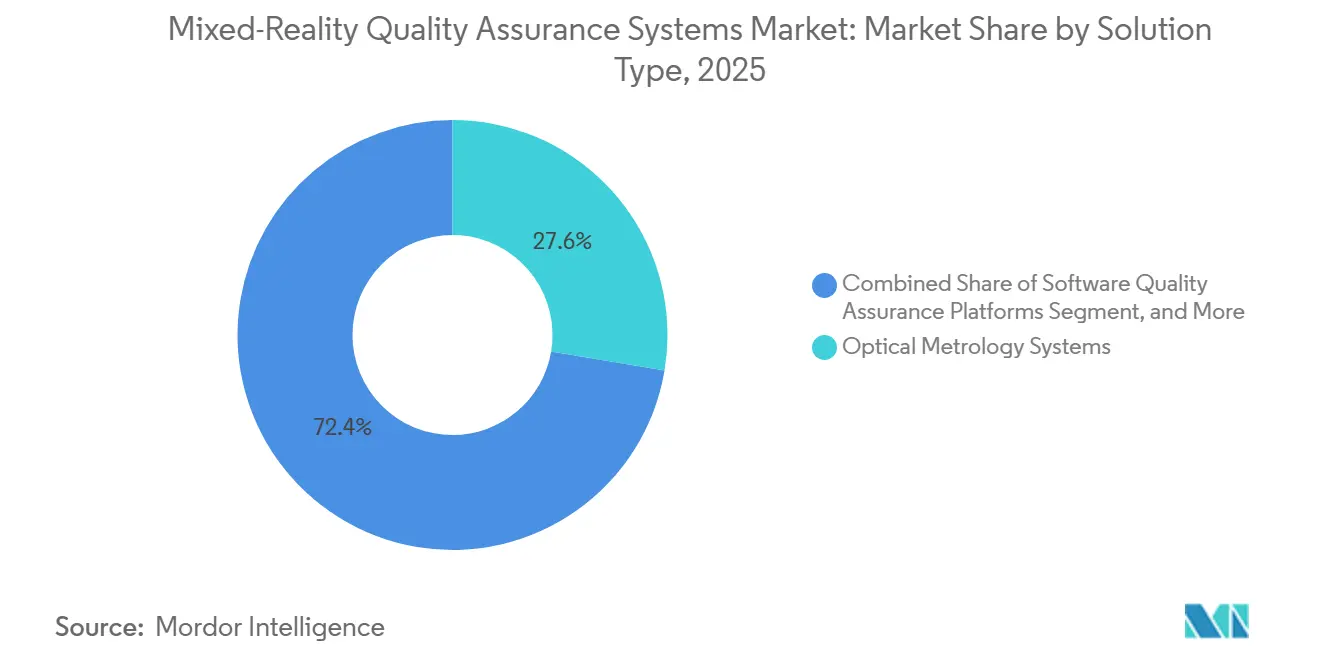
- By product type, optical metrology systems held 27.64% of the Mixed-Reality Quality Assurance Systems Market share in 2025, while software quality assurance platforms are projected to expand at a 17.72% CAGR through 2031.
- By system type, near-eye display test systems held 24.87% revenue share in 2025, while XR application and runtime test platforms are expected to expand at a 17.46% CAGR through 2031.
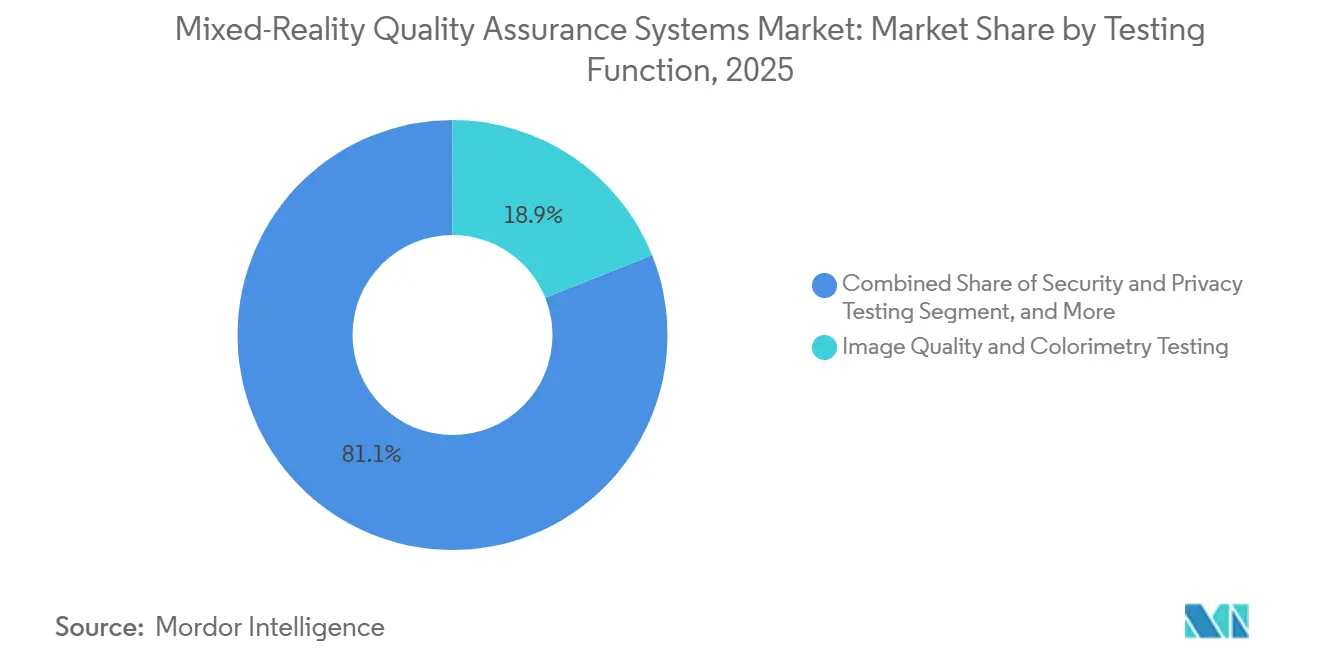
- By testing function, image quality, and colorimetry accounted for 18.93% of Mixed-Reality Quality Assurance Systems Market revenue in 2025, while security and privacy testing is projected to grow at a 17.83% CAGR through 2031.
- By end-user industry, consumer electronics held 25.76% of spending in 2025, while software and application developers are expected to expand at a 17.91% CAGR through 2031.
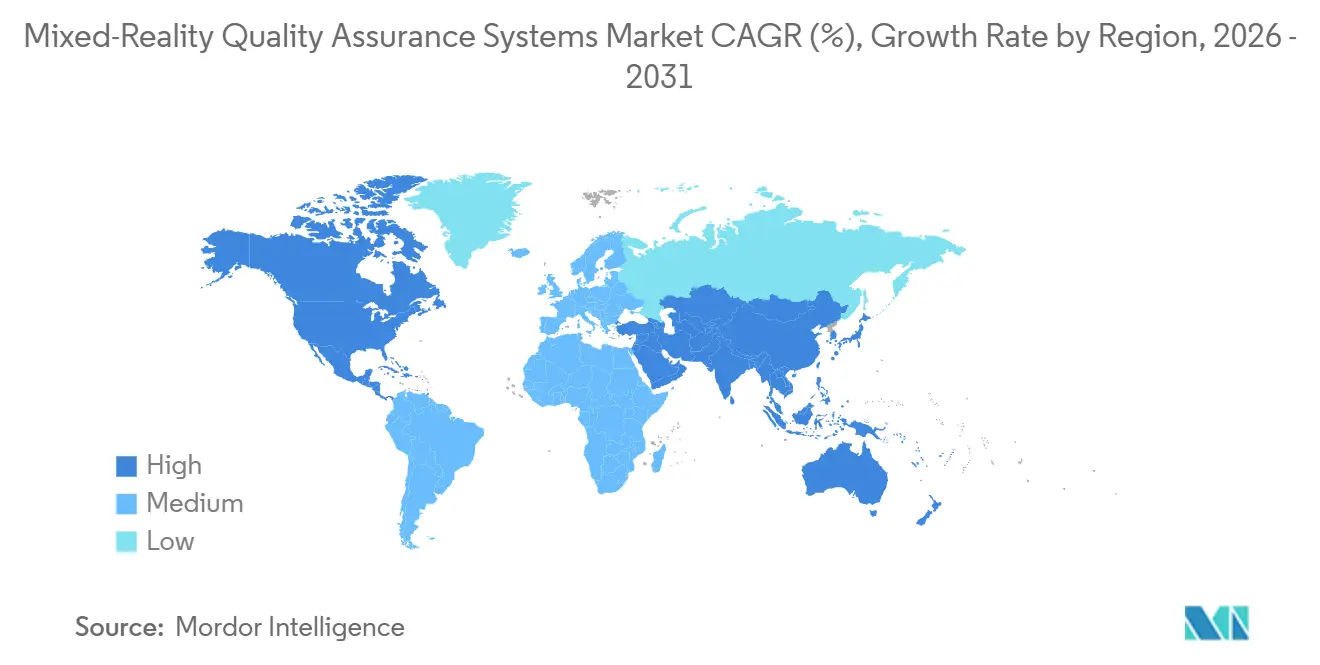
- By geography, North America held 34.28% revenue share in 2025, while Asia-Pacific is projected to advance at a 17.38% CAGR through 2031.
Drivers Impact Analysis
| Driver | (~) % Impact on CAGR Forecast | Geographic Relevance | Impact Timeline |
|---|---|---|---|
| Enterprise Demand for Immersive Technology Reliability | +3.2% | Global | Short term (≤ 2 years) |
| Near-Eye Display Measurement and Certification | +3.0% | Global, with early gains in North America, Europe, and Japan | Medium term (2-4 years) |
| High-Volume Smart-Glass Manufacturing | +2.5% | Asia-Pacific core, with effects in North America and Europe | Short term (≤ 2 years) |
| 5G-Advanced and Wi-Fi Evolution for Low-Latency XR | +2.0% | North America and Asia-Pacific, with Europe following | Medium term (2-4 years) |
| Human-Eye-Referenced Testing for Waveguide and Display Quality | +1.5% | Global, concentrated in North America and Europe | Long term (≥ 4 years) |
| Shift to Traceable Automated Quality Engineering | +1.2% | Global | Medium term (2-4 years) |
| Source: Mordor Intelligence | |||
Note: Market size and forecast figures in this report are generated using Mordor Intelligence’s proprietary estimation framework, updated with the latest available data and insights as of January 2026.
Global Mixed-Reality Quality Assurance Systems Market Trends and Insights
Drivers Impact Analysis*
| Driver | (~) % Impact on CAGR Forecast | Geographic Relevance | Impact Timeline |
|---|---|---|---|
| Enterprise Demand for Immersive Technology Reliability | +3.2% | Global | Short term (≤ 2 years) |
| Near-Eye Display Measurement and Certification | +3.0% | Global, with early gains in North America, Europe, and Japan | Medium term (2-4 years) |
| High-Volume Smart-Glass Manufacturing | +2.5% | Asia-Pacific core, with effects in North America and Europe | Short term (≤ 2 years) |
| 5G-Advanced and Wi-Fi Evolution for Low-Latency XR | +2.0% | North America and Asia-Pacific, with Europe following | Medium term (2-4 years) |
| Human-Eye-Referenced Testing for Waveguide and Display Quality | +1.5% | Global, concentrated in North America and Europe | Long term (≥ 4 years) |
| Shift to Traceable Automated Quality Engineering | +1.2% | Global | Medium term (2-4 years) |
| Source: Mordor Intelligence | |||
Enterprise Demand for Immersive Technology Reliability
Enterprise use of XR for maintenance, surgical training, and remote collaboration has raised reliability expectations. A faulty guidance overlay or tracking interruption can create liability and operating risks for the user. This requirement encourages buyers to include certified test coverage when purchasing an XR device. The Mixed-Reality Quality Assurance Systems Market, therefore, benefits from procurement cycles that are less dependent on consumer device launches. Network reliability and latency also influence hologram alignment and real-time AI-assisted interaction, making connectivity testing as important as display testing in many enterprise deployments.[1]M. Christopoulou et al., “5G/6G Architecture Evolution for XR and Metaverse: Feasibility Study, Security, and Privacy Challenges for Smart Culture Applications,” IEEE Access, ieee.org
Near-Eye Display Measurement and Certification
IEC 63145-22-20:2024 defines methods for measuring AR eyewear image quality, including field of view, ambient contrast, secondary-image rejection, and positioning accuracy. The standard gives device makers a clearer reason to procure radiometric benches, angular scanners, and colorimetric filters. The Mixed-Reality Quality Assurance Systems Market grows when measurement requirements are integrated into product development rather than treated as a late certification task. IEC 62629-62-12:2025 extends virtual-image display measurement methods to automotive 3D head-up displays. These requirements are moving test-equipment purchases earlier in OEM programs and narrowing the separation between research tools and production equipment.[2]International Electrotechnical Commission, “IEC 63145-22-20:2024 Eyewear Display: Specific Measurement Methods for AR Type Image Quality,” International Electrotechnical Commission, iec.ch
High-Volume Smart-Glass Manufacturing
Smart-glass production is moving from pilot lines toward larger manufacturing volumes. This shift makes reliable inspection more important at each stage of waveguide fabrication. Lumus and Quanta Computer signed a September 2026 licensing agreement for thinner Z-30 2.0 and A-Lens geometric waveguides, which highlights the supply-chain investment behind next-generation AI glasses.[3]Lumus, “Lumus and Quanta Expand Manufacturing Partnership With Licensing Agreement for Next-Generation Thinner, Lower-Cost Waveguides for AI Glasses,” Lumus, lumus.com Manual optical inspection is not practical at volumes reaching hundreds of thousands of units. TRIOPTICS introduced ImageMaster PRO AR Reflection for high-volume production with takt times below 1.5 seconds, reinforcing the need for automated testing in cleanroom production environments
5G-Advanced and Wi-Fi Evolution for Low-Latency XR
Network performance is a core quality measure for untethered XR devices. High end-to-end latency can cause noticeable lag and motion sickness. SoftBank, Ericsson, and Qualcomm reported a 90% reduction in wireless-segment latency during a commercial Tokyo 5G Standalone field trial using smart glasses.[4]Ericsson, “SoftBank, Ericsson, and Qualcomm Achieve 90% Latency Reduction in 5G Field Trial,” Ericsson, ericsson.com Rohde and Schwarz demonstrated a CMX500 test setup at MWC 2026 that emulates 4G, 5G, and Wi-Fi conditions while applying radio and IP impairments. The Mixed-Reality Quality Assurance Systems Market has a broader addressable test scope as devices adopt dual-mode 5G and Wi-Fi 7 connections.
Restraints Impact Analysis*
| Restraint | (~) % Impact on CAGR Forecast | Geographic Relevance | Impact Timeline |
|---|---|---|---|
| Cost of Specialized Near-Eye Display Test Equipment | -1.5% | Global, more acute in South America and Middle East and Africa | Short term (≤ 2 years) |
| Fragmented XR Device and Software Ecosystems | -1.2% | Global | Medium term (2-4 years) |
| Limited Comfort and Human-Factors Standardization | -0.8% | Global | Long term (≥ 4 years) |
| Calibration Complexity Across Operating Conditions | -0.6% | Global, more acute in industrial settings in Asia-Pacific and Middle East and Africa | Medium term (2-4 years) |
| Source: Mordor Intelligence | |||
Cost of Specialized Near-Eye Display Test Equipment
Goniometric scanners, angular luminance cameras, and waveguide MTF benches require substantial capital investment. This restricts comprehensive test coverage mainly to major OEM laboratories. Capacity can then become constrained when a device needs simultaneous certification across several jurisdictions. Service-based access to specialist equipment could reduce the burden for smaller laboratories. The Mixed-Reality Quality Assurance Systems Market may also see buyers replace some optical verification with lower-cost automated functional testing where product requirements permit.
Fragmented XR Device and Software Ecosystems
XR products use different operating systems, software development kits, sensor combinations, and connectivity stacks. This fragmentation requires separate scripts, device profiles, and compatibility libraries for many platform combinations. A study of 23 professional XR developers found limited awareness of GDPR and CCPA requirements and no awareness of XR-specific security standards. The Mixed-Reality Quality Assurance Systems Market must accommodate this uneven baseline in software assurance practices. Without stronger runtime interoperability, vendors will have limited ability to reuse automation assets across platforms.
*Our forecasts treat driver/restraint impacts as directional, not additive. The impact forecasts reflect baseline growth, mix effects, and variable interactions.
Segment Analysis
By Solution Type: Optical Metrology Leads While Software Platforms Accelerate
Optical metrology systems accounted for 27.64% of the Mixed-Reality Quality Assurance Systems Market share in 2025. They support waveguide image transfer verification, luminance uniformity checks, and color accuracy measurements before device shipment. IEC protocols specify instrument characteristics needed for certifiable results, which favors purpose-built metrology hardware. Display, motion, sensor, tracking, connectivity, and over-the-air systems cover calibration, latency, eye tracking, and testing across dual 5G and Wi-Fi 7.
Software quality assurance platforms are projected to expand at a 17.72% CAGR through 2031. XR rendering complexity, target-device profiles, and security documentation requirements support this pace. These platforms generate recurring revenue from maintained test cases and compatibility libraries, unlike mostly project-based hardware sales. Certification and compliance services gain relevance as OEMs use independent laboratories for product reviews. The Mixed-Reality Quality Assurance Systems Industry is becoming more balanced between measurement hardware, software automation, and outsourced validation.



By System Type: Near-Eye Display Systems Anchor Spending While Runtime Platforms Advance
Near-eye display test systems accounted for 24.87% of revenue in 2025. Their position reflects investment in goniometric luminance cameras, calibrated optical systems, and angular colorimeters. Waveguide test systems address overlay tolerances required for surface-relief grating production. Onto Innovation stated that image-based overlay tools can support the precision needed for high-volume SRG waveguide manufacturing. Calibration stations, network testbeds, and end-of-line systems support later assembly and connectivity tasks.
XR application and runtime test platforms are expected to expand at a 17.46% CAGR through 2031. Security audits, compatibility reviews, and rendering checks are becoming more common before platform submission. Integrated end-of-line systems reduce separate factory test stations but need more software coordination. Network and RF testbeds gain relevance as AI glasses adopt 5G-Advanced and Wi-Fi 7. The Mixed-Reality Quality Assurance Systems Market supports integrated solutions that improve throughput without weakening test coverage.
By Testing Function: Colorimetry Leads While Security Testing Gains Momentum
Image quality and colorimetry testing captured 18.93% of revenue in 2025. Investment centers on luminance, contrast, color gamut, and uniformity tools used at component and system levels. MTF, resolution, focus, field of view, distortion, warping, grating, and alignment checks remain necessary before final assembly. Onto Innovation described sub-100 nm overlay precision at 3σ for image-based overlay systems in waveguide process control. These requirements link optical accuracy directly to production yield.
Security and privacy testing is projected to expand at a 17.83% CAGR through 2031. Enterprise buyers need audit trails for eye gaze, hand tracking, and spatial scans. AUTOVR activated 390 unique sensitive-data exposures across 366 Meta Quest applications in a USENIX Security study. The result indicates a large potential attack surface in VR applications. Human factors and interoperability testing remain important when certification requires evidence beyond optical and electrical pass-fail results.
By End-User Industry: Consumer Electronics Leads Spending While Developers Expand Fastest
Consumer electronics represented 25.76% of spending in 2025. AI smart-glass programs are shifting from pilot activities to commercial production, requiring end-of-line equipment capable of matching factory throughput. Automotive companies use AR-overlay inspection tools to replace some manual checks with CAD-referenced workflows. Aerospace, defense, healthcare, and medical device buyers support higher-value instrument purchases and calibration contracts. Gaming and entertainment companies use software validation for latency, compatibility, and rendering quality.
Software and application developers are expected to expand at a 17.91% CAGR through 2031. Demand reflects more XR studios and increased requirements for security and privacy reviews. Certification bodies and laboratories affect time to market through their capacity constraints and expanding documentation requirements. The Mixed-Reality Quality Assurance Systems Market can benefit from tools and services that reduce those documentation burdens. Per-device service engagements are also lengthening beyond earlier binary pass-fail reviews.
Geography Analysis
North America accounted for 34.28% of revenue in 2025. The region benefits from AR and MR OEMs, certification laboratories, and enterprise deployments. United States requirements from the Federal Communications Commission, Food and Drug Administration, and Department of Defense support connectivity and optical testing. Canada contributes through automotive XR programs, while Mexico supports nearshoring of device assembly. United States platform operators also influence test practices through their developer certification requirements.
Europe is driven more by regulatory requirements and precision optics capability than by device manufacturing volume. IEC 63145 standards, GDPR obligations for biometric data, and high-risk AI requirements support compliance testing. TRIOPTICS upgraded the ImageMaster Lab AR Flex in September 2025 to measure MTF, distortion, color, luminance, veiling glare, and relative efficiency in a single automated pass. Germany has a deep base of optical instrumentation suppliers. The United Kingdom, France, Italy, and Spain support demand through deployments in manufacturing, energy, and aerospace.
Asia-Pacific is projected to expand at a 17.38% CAGR through 2031. China and South Korea concentrate smart-glass wafer and module manufacturing, while Japan supports enterprise XR deployment. The Mixed-Reality Quality Assurance Systems Market size in the region is supported by in-line inspection, critical-dimension measurement, and overlay verification near fabrication facilities. A Tokyo 5G field trial reported a 90% reduction in wireless latency, supporting investment in network and RF testbeds for XR services. South America and Middle East and Africa are smaller markets where service-based testing can be more accessible than capital equipment.

Competitive Landscape
The Mixed-Reality Quality Assurance Systems Market is fragmented because no vendor covers the full range from optical inspection to software security reviews and connectivity certification. OptoFidelity, TRIOPTICS, Radiant Vision Systems, Instrument Systems, Gamma Scientific, ELDIM, and Admesy have positions in traceable optical measurement. QualityAI, TestDevLab, GameDriver, and QualityReality address application and runtime validation. Hardware suppliers compete on calibration quality and IEC-compliant methods, while software suppliers compete on automation and device profiles. Different requirements across optical, software, and radio testing limit full-stack supplier coverage.
DXOMARK introduced Golden Eye Assistant in August 2026 for AI-assisted perceptual image-quality evaluation, extending its work into AI smart-glass display validation. Rohde and Schwarz demonstrated an end-to-end 5G and Wi-Fi XR testbed at MWC 2026, bringing radio testing and application performance testing closer together. Instrument Systems, Konica Minolta, and Radiant Vision Systems also presented joint optical metrology solutions for AR and VR at SPIE Photonics West 2026. These actions show that partnerships and integrated platforms are important competitive responses. Perceptual scoring supplements established radiometric measurement approaches.
Audit-ready records are important because buyers need evidence for optical, radio, privacy, and safety reviews. Suppliers with accredited measurement methods have an advantage when customers require traceable results. New entrants need time to establish confidence in calibration and documentation. The Mixed-Reality Quality Assurance Systems Market favors suppliers capable of operating in high-throughput production settings. Hardware vendors may need software partnerships, while software vendors may need instrument partners for physical device measurement.
Mixed-Reality Quality Assurance Systems Industry Leaders
OptoFidelity Oy
Radiant Vision Systems, LLC
Instrument Systems GmbH
Gamma Scientific, Inc.
Averna Technologies Inc.
- *Disclaimer: Major Players sorted in no particular order

Recent Industry Developments
- September 2026: Lumus announced a manufacturing agreement with Zhejiang Crystal-Optech Co., Ltd. to produce its geometric waveguides in China, adding a third manufacturing partner alongside Quanta Computer and SCHOTT. The move diversifies supply capacity ahead of multi-million-unit AR-glass programs and amplifies demand for in-line waveguide optical testing at the new production site.
- September 2026: Lumus signed a licensing agreement with Quanta Computer Inc. to manufacture next-generation Z-30 2.0 and A-Lens geometric waveguides at half the weight and thickness of prior generations. The agreement targets consumer AR programs moving from hundreds of thousands to multi-million-unit volumes and requires production-grade optical metrology at Quanta's Taiwan manufacturing base.
- August 2026: DXOMARK launched Golden Eye Assistant, an AI-powered perceptual image-quality evaluation platform that standardizes subjective visual-quality assessment using its annotated image database. The platform extends the company's testing methodology from smartphone cameras into AI smart glasses and XR display characterization.
- July 2026: Onto Innovation published a full process-control framework for surface-relief grating waveguide manufacturing. It combines optical critical-dimension metrology, picosecond ultrasonic film-thickness measurement, image-based overlay verification achieving 0.26 nm and 0.18 nm precision at 3σ, and automated optical inspection.


Global Mixed-Reality Quality Assurance Systems Market Report Scope
Mixed-Reality Quality Assurance Systems refer to specialized testing and validation solutions designed to evaluate the optical, mechanical, software, and connectivity performance of augmented reality (AR), virtual reality (VR), and mixed reality (MR) devices, ensuring high-fidelity user experiences, precise spatial tracking, and compliance with industry standards.
The Mixed-Reality Quality Assurance Systems Market Report is Segmented by Solution Type (Optical Metrology Systems, Display Test and Measurement Systems, Motion, Sensor, and Tracking Test Systems, Connectivity and Over-the-Air Test Systems, Software Quality Assurance Platforms, and Certification and Compliance Services), System Type (Near-Eye Display Test Systems, Waveguide Test Systems, Headset and Smart-Glass Calibration Stations, XR Application and Runtime Test Platforms, Network and Radio-Frequency Testbeds, and Integrated End-of-Line Test Systems), Testing Function (Image Quality and Colorimetry Testing, MTF, Resolution, and Focus Testing, FOV, Distortion, and Warping Testing, Waveguide Grating and Optical Alignment Testing, Motion, Tracking, and Sensor-Fusion Testing, Latency, Jitter, and Rendering-Performance Testing, Compatibility and Interoperability Testing, Security and Privacy Testing, Usability, Comfort, and Human-Factors Testing, and Connectivity, Throughput, and Mobility Testing), End-User Industry (Consumer Electronics, Automotive and Mobility Companies, Aerospace and Defense Organizations, Healthcare and Medical-Device Companies, Industrial and Enterprise Technology Companies, Gaming and Entertainment Companies, Software and Application Developers, Certification Bodies and Independent Laboratories, and Other End-User Industries), and Geography (North America, South America, Europe, Asia-Pacific, Middle East and Africa). The Market Forecasts are Provided in Terms of Value (USD).
| Optical Metrology Systems |
| Display Test and Measurement Systems |
| Connectivity and Over-the-Air Test Systems |
| Software Quality Assurance Platforms |
| Other Solution Types |
| Near-Eye Display Test Systems |
| Headset and Smart-Glass Calibration Stations |
| XR Application and Runtime Test Platforms |
| Other System Types |
| Image Quality and Colorimetry Testing |
| Waveguide Grating and Optical Alignment Testing |
| Security and Privacy Testing |
| Usability, Comfort, and Human-Factors Testing |
| Other Testing Functions |
| Consumer Electronics |
| Automotive and Mobility |
| Aerospace and Defense |
| Healthcare and Medical-Device |
| Gaming and Entertainment |
| Other End-User Industries |
| North America | United States | |
| Canada | ||
| Mexico | ||
| South America | Brazil | |
| Argentina | ||
| Rest of South America | ||
| Europe | Germany | |
| United Kingdom | ||
| France | ||
| Rest of Europe | ||
| Asia-Pacific | China | |
| Japan | ||
| India | ||
| South Korea | ||
| Rest of Asia-Pacific | ||
| Middle East and Africa | Middle East | Saudi Arabia |
| United Arab Emirates | ||
| Rest of the Middle East | ||
| Africa | South Africa | |
| Rest of Africa | ||
| By Solution Type | Optical Metrology Systems | ||
| Display Test and Measurement Systems | |||
| Connectivity and Over-the-Air Test Systems | |||
| Software Quality Assurance Platforms | |||
| Other Solution Types | |||
| By System Type | Near-Eye Display Test Systems | ||
| Headset and Smart-Glass Calibration Stations | |||
| XR Application and Runtime Test Platforms | |||
| Other System Types | |||
| By Testing Function | Image Quality and Colorimetry Testing | ||
| Waveguide Grating and Optical Alignment Testing | |||
| Security and Privacy Testing | |||
| Usability, Comfort, and Human-Factors Testing | |||
| Other Testing Functions | |||
| By End-User Industry | Consumer Electronics | ||
| Automotive and Mobility | |||
| Aerospace and Defense | |||
| Healthcare and Medical-Device | |||
| Gaming and Entertainment | |||
| Other End-User Industries | |||
| By Geography | North America | United States | |
| Canada | |||
| Mexico | |||
| South America | Brazil | ||
| Argentina | |||
| Rest of South America | |||
| Europe | Germany | ||
| United Kingdom | |||
| France | |||
| Rest of Europe | |||
| Asia-Pacific | China | ||
| Japan | |||
| India | |||
| South Korea | |||
| Rest of Asia-Pacific | |||
| Middle East and Africa | Middle East | Saudi Arabia | |
| United Arab Emirates | |||
| Rest of the Middle East | |||
| Africa | South Africa | ||
| Rest of Africa | |||


Key Questions Answered in the Report
What is the Mixed-Reality Quality Assurance Systems Market size?
The Mixed-Reality Quality Assurance Systems Market is valued at USD 467.11 million in 2026 and is projected to reach USD 938.91 million by 2031 at a 14.98% CAGR, supported by enterprise validation needs.
What is driving demand for the Mixed-Reality Quality Assurance Systems Market?
Enterprise XR use, display certification, larger smart-glass production volumes, and low-latency connectivity requirements are key demand factors for the Mixed-Reality Quality Assurance Systems Market.
Which product type leads the Mixed-Reality Quality Assurance Systems Market?
Optical metrology systems led with 27.64% share in 2025 because waveguides and displays need precise luminance, color, field-of-view, and image-uniformity checks before shipment.
Which end users are expanding fastest in the Mixed-Reality Quality Assurance Systems Market?
Software and application developers are projected to expand at a 17.91% CAGR through 2031 as platform submissions require broader security, privacy, compatibility, and performance documentation.
Which region is expected to expand fastest in the Mixed-Reality Quality Assurance Systems Market?
Asia-Pacific is projected to expand at a 17.38% CAGR through 2031, supported by waveguide manufacturing, in-line process control, and enterprise XR deployment activity.
Why is security testing important for the Mixed-Reality Quality Assurance Systems Market?
XR applications process eye-gaze, hand-tracking, and spatial data, increasing the need for privacy reviews, audit trails, and automated security testing across device platforms.
Page last updated on:


 Your data is secure and never sold or shared.


