
Vision-Based Quality Analytics Market Size and Share
Market Overview
| Study Period | 2020 - 2031 |
|---|---|
| Market Size (2026) | USD 1.76 Billion |
| Market Size (2031) | USD 3.53 Billion |
| Growth Rate (2026 - 2031) | 14.94 % |
| Fastest Growing Market | Asia-Pacific |
| Largest Market | Asia-Pacific |
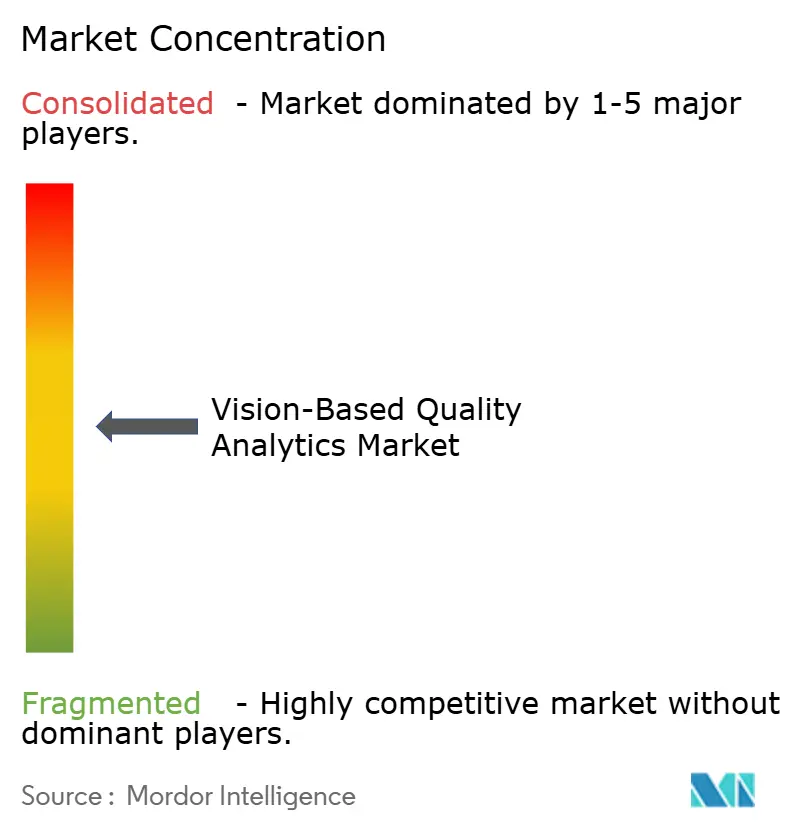
| Market Concentration | Medium |
Major Players *Disclaimer: Major Players sorted in no particular order Image © Mordor Intelligence. Reuse requires attribution under CC BY 4.0. | |
Vision-Based Quality Analytics Market Analysis by Mordor Intelligence
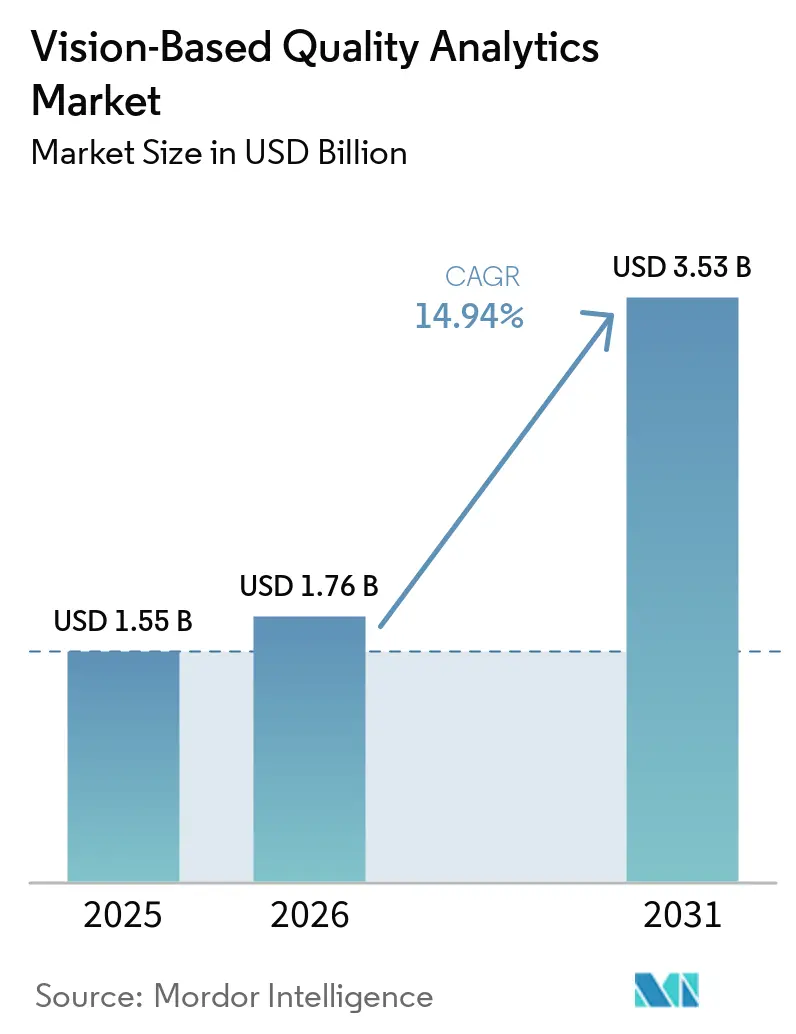
The vision-based quality analytics market size is projected to expand from USD 1.55 billion in 2025 and USD 1.76 billion in 2026 to USD 3.53 billion by 2031, registering a CAGR of 14.94% between 2026 to 2031. Manufacturers are placing inspection closer to the production process because defects can lead to scrap, rework, warranty claims, recalls, lost materials, and interrupted downstream operations. The vision-based quality analytics market is moving away from batch sampling and end-of-line checks toward continuous automated assessment. Inspection systems are becoming part of production decisions and are increasingly connected with manufacturing execution systems, enterprise resource planning systems, and process controls. Competitive priorities center on reliable deployment, continued model maintenance, integration with existing factory equipment, and consistent performance as operating conditions and product designs change. Opportunities are strongest where a missed defect can affect a high-value product, a production lot, a battery module, a wafer, or a downstream assembly.
Key Report Takeaways
- By analytics type, Defect and Anomaly Analytics held 32.67% of the vision-based quality analytics market share in 2025, while Predictive Quality Analytics is projected to expand at a 15.56% CAGR through 2031.
- By technology, Traditional Rule-Based Analytics accounted for 43.67% of the vision-based quality analytics market size in 2025, while AI/Deep Learning-Based Analytics is expected to grow at a 15.63% CAGR through 2031.
- By deployment, Edge/On-Premises held 61.45% share in 2025, while Cloud-Based deployment is forecast to grow at a 16.28% CAGR through 2031.
- By end-user industry, Electronics and Semiconductors accounted for 24.51% share in 2025, while EV and Battery Manufacturing is projected to advance at a 16.07% CAGR through 2031.
- By geography, Asia-Pacific held 36.12% share in 2025 and is expected to grow at a 16.21% CAGR through 2031.
Note: Market size and forecast figures in this report are generated using Mordor Intelligence’s proprietary estimation framework, updated with the latest available data and insights as of January 2026.
Global Vision-Based Quality Analytics Market Trends and Insights
Drivers Impact Analysis*
| Driver | (~) % Impact on CAGR Forecast | Geographic Relevance | Impact Timeline |
|---|---|---|---|
| Transition to Automated AI Defect Recognition | +3.2% | Global | Short term (≤ 2 years) |
| Precision Analytics Demand in EV Batteries and Semiconductors | +2.8% | Asia-Pacific core, spill-over to North America and EU | Medium term (2-4 years) |
| Edge Platforms for Real-Time In-Line Assessment | +2.4% | Global, with early concentration in Asia-Pacific and North America | Short term (≤ 2 years) |
| Predictive Quality Analytics to Reduce Scrap and Rework | +2.1% | Global | Medium term (2-4 years) |
| Regulatory and Traceability Standards in Medical Devices and Pharmaceuticals | +1.8% | North America and EU | Medium term (2-4 years) |
| Hybrid AI and Rule-Based Inspection Algorithms | +1.5% | Global, with concentration in Asia-Pacific | Long term (≥ 4 years) |
| Source: Mordor Intelligence | |||
Rapid Transition From Manual Inspection to Automated AI-Powered Defect Recognition
Manual inspection is becoming harder to sustain when production volumes rise and defect tolerance narrows. A consumer goods manufacturer replaced manual spot checks with unsupervised edge-based anomaly detection and targeted a reduction in inspection labor from 40% to 4% of its plant workforce. The vision-based quality analytics market benefits when manufacturers extend inspection to steps that previously lacked full coverage due to time or cost constraints. TSMC uses NVIDIA Metropolis and the NVIDIA TAO Toolkit to improve nanometer-scale defect classification while reducing the need for repeated labeling and retraining as conditions change. A VCSEL inspection study using 22,410 images reported 98.7% accuracy and reduced per-unit inspection time from 17.7 seconds to 1.5 seconds. The same study reported an 89% reduction in inspection time and a 4.5-month hardware payback period.
Increasing Demand for High-Precision Visual Analytics in EV Battery and Semiconductor Fabrication
Battery and semiconductor production both require close control because a single defect can jeopardize an entire lot, module, or finished product. The vision-based quality analytics market, therefore, has high-value applications in these production environments. Researchers presented AOI-SSL at the CVPR 2026 workshop as a self-supervised approach for wire-bonded semiconductor inspection, using domain-specific vision transformer pretraining on smaller inspection datasets. The LIBAD benchmark, released in August 2026, includes 744 electrode samples from real roll-to-roll production lines and covers 11 defect categories.[1]arXiv, “LIBAD: A Multimodal Anomaly Detection Benchmark for Li-Ion Battery Electrode Manufacturing,” arxiv.org It combines visible-light imaging, high-resolution X-ray, and inline-compatible X-ray radiography. Cell formats, including cylindrical, prismatic, and pouch designs, require inspection systems that can adapt to different configurations and defect patterns.
Proliferation of Edge Computing Platforms Enabling Real-Time In-Line Quality Assessment
Edge computing enables inspection at production speed without relying on a network round-trip for each decision. Cognex also launched the In-Sight 6900 Vision Controller in April 2026, using NVIDIA Jetson technology to run higher-capacity AI workloads at the edge. The vision-based quality analytics market has a clear need for these systems on electronics and semiconductor lines that require sub-100ms inference times. Research on edge-cloud collaboration found that selective routing of complex cases to cloud reasoning reduced runtime by up to 22.4%. The same research reported energy reductions per correct decision of 40-74% compared with fully cloud-dependent pipelines.
Rising Shift Toward Predictive Quality Analytics to Reduce Scrap Rates and Rework Costs
Predictive systems use inspection and process data to identify drift before it leads to defects. The vision-based quality analytics market is gaining from this shift because manufacturers want to prevent defective output rather than only separate it afterward. A closed-loop CNN-LSTM framework, evaluated on the SECOM semiconductor dataset, reported a 23.5% improvement in quality. The study also reported 8.7-12.3% lower operating costs than standalone AI or traditional models. The American Society for Quality states that the cost of poor quality can reach 20% of sales revenue when scrap, rework, warranty claims, and inspection overhead are included. Predictive models can identify multivariable patterns that fixed statistical thresholds may miss, allowing operators to adjust process settings earlier.
Restraints Impact Analysis*
| Restraint | (~) % Impact on CAGR Forecast | Geographic Relevance | Impact Timeline |
|---|---|---|---|
| Upfront Costs and Legacy Equipment Integration | -2.9% | Global, most acute in South America, Middle East and Africa, and smaller Asia-Pacific markets | Short term (≤ 2 years) |
| Limited Labeled Data for Rare Defects | -2.3% | Global | Medium term (2-4 years) |
| Optical and Environmental Effects on Accuracy | -1.8% | Global | Medium term (2-4 years) |
| Shortage of Edge Machine Learning Talent | -1.5% | North America, EU, South America, Middle East and Africa | Long term (≥ 4 years) |
| Source: Mordor Intelligence | |||
High Upfront Deployment Costs and Integration Complexity with Legacy Machinery
The vision-based quality analytics market faces a practical barrier in facilities that use older, PLC-driven equipment and have limited data infrastructure. A pilot usually requires manual fallback, evaluation milestones, and connectivity to a manufacturing execution system before an AI inspection system is ready for full production. Smaller manufacturers find the cost of commercial automated optical inspection systems. A VCSEL study described hardware-constrained architectures designed for settings where larger incumbent platforms are not feasible. Older plants may also lack the high-throughput, low-latency connectivity needed to link cameras, edge nodes, and enterprise systems. Neurala reported that its L-DNN technology can train and infer without cloud connectivity or GPU hardware, which addresses facilities with limited deployment capacity.
Scarcity of High-Quality Labeled Training Datasets for Rare Industrial Defect Models
Rare defects create an inherent data problem because supervised models need representative labeled examples. In VCSEL semiconductor production, crack defects accounted for less than 0.4% of production images in one study. The vision-based quality analytics market can be delayed when class imbalance weakens recall for defects that occur infrequently. A systematic review found that pure transformer models often remain in laboratory or benchmark settings because their data labeling and computational requirements are demanding. IMDD-1M, introduced at CVPR 2026, contains 1,000,000 aligned image-text pairs across more than 60 material categories and more than 400 defect types. Its broad coverage does not remove the need for data that matches each plant's specific process and defect morphology.
*Our forecasts treat driver/restraint impacts as directional, not additive. The impact forecasts reflect baseline growth, mix effects, and variable interactions.
Segment Analysis
By Analytics Type: Defect Inspection Leads While Predictive Tools Expand
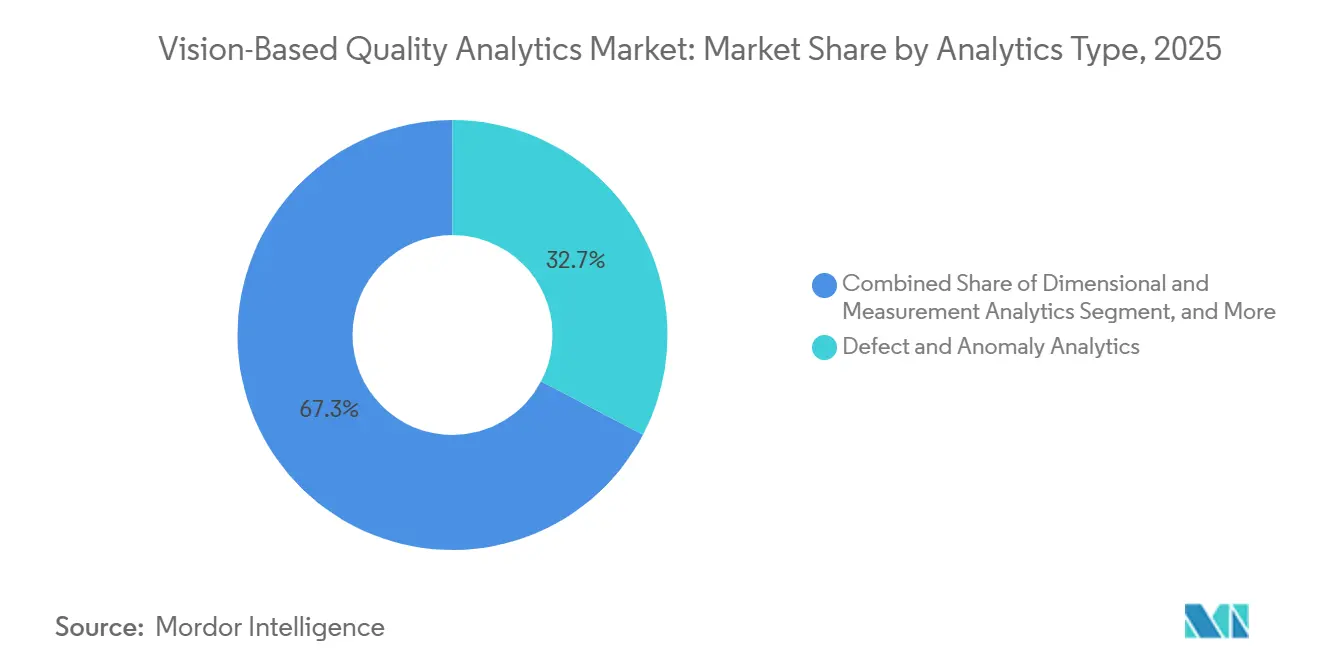
Defect and Anomaly Analytics held 32.67% share in 2025, making it the largest analytics category in the vision-based quality analytics market. Electronics, automotive, and food-processing lines use this category for surface and structural checks to determine whether a unit passes or fails. Installed automated optical inspection systems generate classification records that can be shared with manufacturing execution systems. Dimensional and Measurement Analytics supports precision metrology in high-mix discrete manufacturing. Pattern and Classification Analytics supports component identification and traceability in automotive and electronics assembly.
Predictive Quality Analytics is forecast to expand at a 15.56% CAGR through 2031. The vision-based quality analytics industry is adopting predictive tools because end-of-line detection does not recover the cost of material or processing already consumed. Process Quality Analytics links inspection results with upstream process variables and supports earlier corrective action. Other Analytics Types include specialized applications that are emerging in individual production settings. The SECOM study showed how a closed-loop model could adapt as process conditions change.



By Technology: Rule-Based Systems Remain Established While Deep Learning Advances
Traditional Rule-Based Analytics commanded a 43.67% share in 2025, reflecting an installed base of systems built around fixed thresholds, edge-detection filters, and geometric rules. These systems remain useful where products and operating conditions are stable. The vision-based quality analytics market still depends on rule-based methods for validated tasks that require consistent logic. Their limits become clearer when lighting, product variants, or process parameters change. A systematic review reported that YOLO-based approaches achieved 98.6% mAP on PCB defect datasets.
AI/Deep Learning-Based Analytics is forecast to grow at a 15.63% CAGR through 2031. The vision-based quality analytics industry is using deep learning, where hand-configured rules struggle with varied or complex features. The same review reported that HSA-RTDETR reached 96.9% mAP at 66.2 FPS for a 6-defect PCB inspection task. Hybrid AI and Rule-Based Analytics preserves validated rules for predictable checks while applying AI to variable conditions. SICK announced updated capabilities for its Nova platform, including tools for 3D data processing and neural-network object detection, for its Vision 2026 showcase.
By Deployment: Edge Is the Main Production Architecture and Cloud Supports Scale
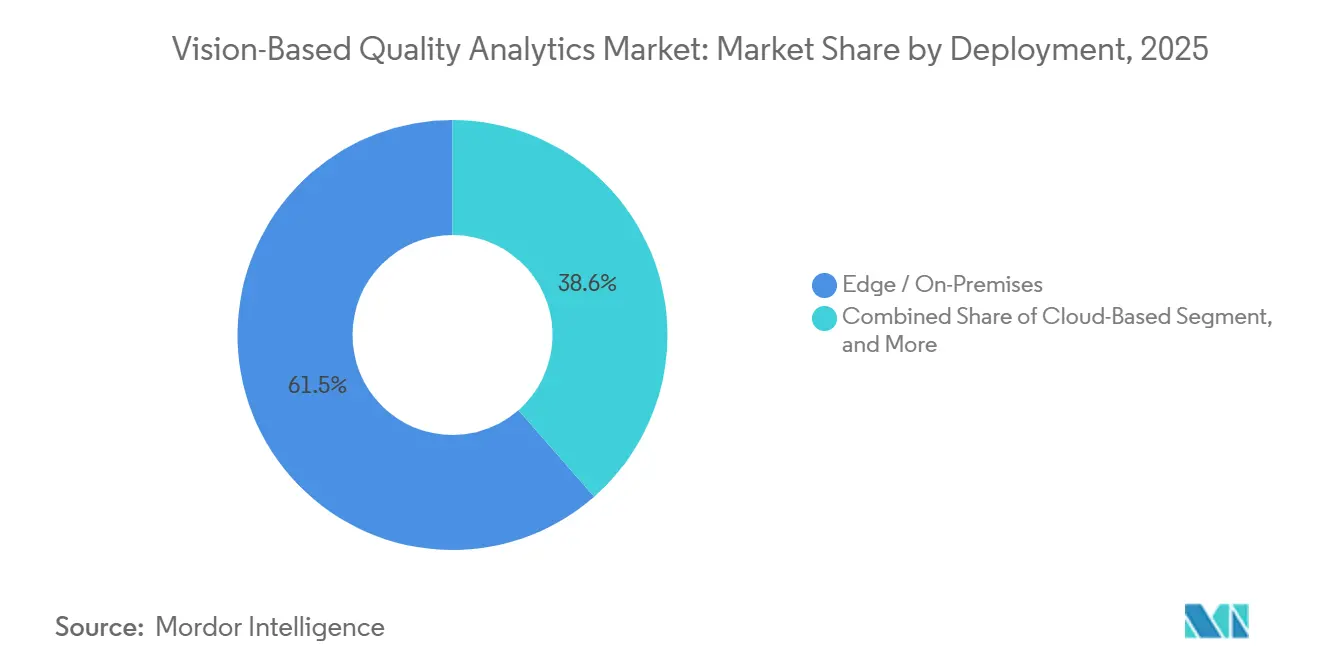
Edge/On-Premises deployment held 61.45% share in 2025 because high-speed production lines need decisions with very low latency. The vision-based quality analytics market relies on local inference when cloud round-trip times cannot consistently meet line-speed requirements. Edge systems keep image processing close to cameras and machinery. This can support stable operation even when external connectivity is limited, a consideration for facilities that operate with restricted network access or localized data systems. On-premises deployment also helps plants retain direct control over inspection workflows, image data, integration settings, and the timing of production-line decisions.
Cloud-Based deployment is expected to grow at a 16.28% CAGR through 2031. The vision-based quality analytics market is using cloud platforms for central training, version control, and multi-site model management rather than for every real-time decision. Cognex OneVision became generally available in May 2026 after a beta period with more than 100 customers.[2]Cognex Corporation, “Cognex OneVision Adoption Ramps as Manufacturers Scale AI Vision Globally,” Cognex Investor Relations, investor.cognex.com Schneider Electric reported a doubled yield and fewer false rejects, while Essity reduced AI inspection application development from more than 1 year to less than 1 day. A hybrid approach combines local inference with cloud model governance and selective cloud processing for complex cases.
By End-User Industry: Semiconductors Lead and EV Batteries Grow Fastest
Electronics and Semiconductors retained 24.51% share in 2025, supported by the need for 100% in-process inspection at advanced nodes. The vision-based quality analytics market serves fabs in which a single propagated defect can affect an entire wafer lot. Semiconductor inspection is demanding because it requires very high precision and regular model updates. TSMC's use of NVIDIA systems demonstrates the role of vision AI in nanometer-scale classification and yield management. These requirements make semiconductors a major driver of demand for inspection software and hardware.
EV and Battery Manufacturing is projected to grow at a 16.07% CAGR through 2031. The vision-based quality analytics market is expanding in this vertical as producers inspect cylindrical, prismatic, and pouch cells, as well as welds and traceability records. Automotive, Pharmaceutical and Medical Devices, and Aerospace and Defense are established inspection users with formal quality processes. Food and Beverage, Logistics, and Warehousing add demand through packaging checks, freshness detection, and pick-accuracy verification.
Geography Analysis
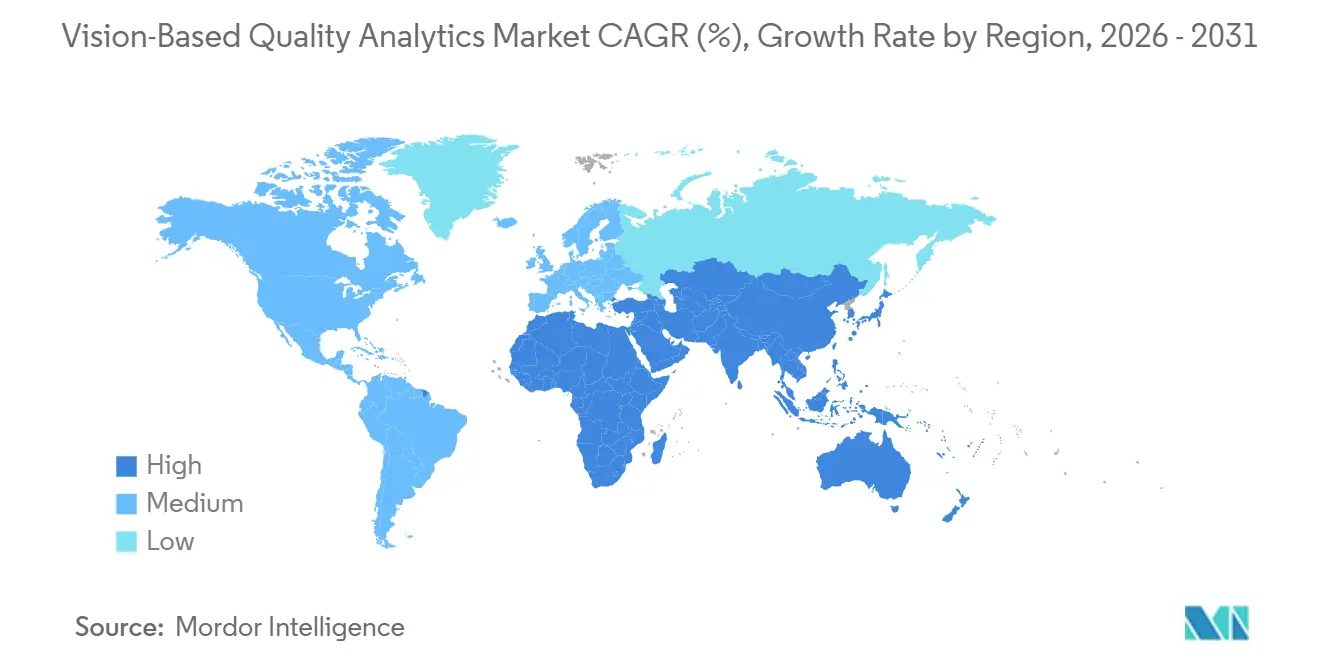
Asia-Pacific held 36.12% share in 2025 and is forecast to grow at a 16.21% CAGR through 2031. The vision-based quality analytics market has its largest regional base in Asia-Pacific because China, South Korea, Japan, and Taiwan have dense semiconductor, electronics, and battery production. China is expanding domestic semiconductor capacity, while South Korea has DRAM and OLED clusters. Japan supports VCSEL and automotive sensor manufacturing, and Taiwan has advanced foundry operations. India is an emerging demand location because semiconductor incentives and expanding electronics manufacturing services are supporting future inspection adoption.
The LIBAD benchmark released in August 2026 used real roll-to-roll production data and 3 imaging methods for battery electrode inspection. This work reflects the increasing complexity of quality requirements as regional battery capacity grows. Vietnam, Thailand, and Malaysia also contribute to demand as supply chains add precision production capacity. North America is the second-largest region, with demand across semiconductor manufacturing, pharmaceuticals, aerospace and defense, and automotive inspection. The United States has major demand in Arizona and Texas semiconductor clusters, the Great Lakes automotive corridor, and East Coast pharmaceutical and biotechnology facilities.
The FDA Quality Management System Regulation became effective on February 2, 2026, and incorporated ISO 13485:2016 by reference into 21 CFR Part 820.[3]U.S. Food and Drug Administration, “Medical Devices, Quality System Regulation Amendments,” Federal Register, thefederalregister.org This creates documentation and validation requirements for vision inspection systems in U.S. medical device facilities. Canada supports specialized demand through Ontario automotive suppliers and Quebec aerospace manufacturers, while Mexico adds electronics manufacturing activity. Europe is led by Germany's automotive, robotics, and precision engineering sectors. France, the United Kingdom, and Italy contribute through aerospace components, pharmaceuticals, and food processing. South America, the Middle East, and Africa remain smaller demand areas centered on Brazil, the UAE, and South Africa, where cloud and hybrid models can lower infrastructure requirements.

Competitive Landscape
The vision-based quality analytics market includes machine vision specialists such as Cognex Corporation, Keyence Corporation, and Teledyne Technologies Incorporated. The vision-based quality analytics market also includes AI-native software companies such as Landing AI, Neurala Inc., Sight Machine Inc., and Instrumental Inc. Hardware-integrated suppliers benefit from factory integration experience, certifications, and established inspection libraries. Software-focused suppliers compete through adaptable models, low-code interfaces, and tools designed for smaller labeled datasets. This creates competition across the hardware, algorithm, application development, integration, and enterprise deployment layers, rather than through a single, uniform vendor model.
Cognex made OneVision generally available in May 2026 to support centralized model governance and multi-site AI inspection deployment. Landing AI integrated LandingLens with ABB Robotics software after ABB invested in the company in September 2025. Landing AI stated that the integration can reduce the time to train and deploy robot vision AI by up to 80%. Siemens and NVIDIA expanded their partnership in January 2026 to develop an Industrial AI Operating System that includes quality analytics, digital twins, simulation, and adaptive manufacturing capabilities.[4]Siemens AG, “Siemens and NVIDIA Expand Partnership to Build the Industrial AI Operating System,” Siemens Press, press.siemens.com The first named implementation site is the Siemens Electronics Factory in Erlangen, Germany.
Neurala expanded its technology licensing program in July 2026, making its L-DNN engine available for products from FLIR Systems, IHI Logistics, and Sony Semiconductor Solutions. The technology is positioned for standard edge hardware and does not require cloud connectivity or GPU infrastructure. Smaller providers including Elementary Robotics, Kitov Systems, and Overview are focusing on autonomous patrol inspection and low-setup models. The competitive field includes established equipment providers and a broad group of software-focused companies, with competition occurring across connected but distinct layers.
Vision-Based Quality Analytics Industry Leaders
Cognex Corporation
Keyence Corporation
Siemens AG
Teledyne Technologies Incorporated
Zebra Technologies Corporation
- *Disclaimer: Major Players sorted in no particular order

Recent Industry Developments
- July 2026: Neurala expanded its technology licensing program on July 1, 2026, making its L-DNN edge-native vision AI engine available for embedding in products from FLIR Systems, IHI Logistics, and Sony Semiconductor Solutions. The program enables end users to train and run vision AI entirely on standard edge hardware without cloud connectivity or GPU infrastructure, targeting machine builders seeking to add AI inspection as a native product feature.
- June 2026: NVIDIA announced on June 1, 2026, that TSMC is using NVIDIA Metropolis and the TAO Toolkit to advance automated defect inspection with vision AI, improving detection of nanometer-scale defects while reducing repeated labeling and retraining as process conditions change. The deployment is part of a broader NVIDIA and TSMC collaboration spanning lithography simulation, process control, and fab operations optimization.
- May 2026: Cognex announced the general availability of OneVision on May 13, 2026. Since its June 2025 beta, over 100 customers have used the platform to scale AI inspection from single-line pilots to multi-site enterprise deployments in days rather than months, with reported cost savings of up to 50% versus duplicating AI development independently across sites.
- April 2026: Siemens launched its Industrial AI Suite in April 2026, running on a new line of Industrial PCs powered by NVIDIA GPUs. The suite simplifies the AI lifecycle from model packaging and deployment to monitoring and connectivity through the Siemens Industrial Edge ecosystem for scalable, multi-site AI operation.


Global Vision-Based Quality Analytics Market Report Scope
The vision-based quality analytics market comprises software and systems that use computer vision, artificial intelligence, and machine learning to inspect products, detect defects, monitor production processes, and analyze quality data in real time. These solutions help manufacturers improve quality control, reduce operational errors, enhance production efficiency, and ensure compliance with industry standards.
The Vision-Based Quality Analytics Market Report is Segmented by Analytics Type (Defect and Anomaly Analytics, Dimensional and Measurement Analytics, Pattern and Classification Analytics, Process Quality Analytics, Predictive Quality Analytics, and Other Analytics Types), Technology (AI/Deep Learning-Based Analytics, Traditional Rule-Based Analytics, and Hybrid AI and Rule-Based Analytics), Deployment (Edge/On-Premises, Cloud-Based, and Hybrid), End-User Industry (Electronics and Semiconductors, EV and Battery Manufacturing, Automotive, Pharmaceutical and Medical Devices, Food and Beverage, Aerospace and Defense, Logistics and Warehousing, and Other End-User Industries), and Geography (North America, South America, Europe, Asia-Pacific, Middle East, and Africa). The Market Forecasts are Provided in Terms of Value (USD).
| Defect and Anomaly Analytics |
| Dimensional and Measurement Analytics |
| Pattern and Classification Analytics |
| Process Quality Analytics |
| Predictive Quality Analytics |
| Other Analytics Types |
| AI / Deep Learning-Based Analytics |
| Traditional Rule-Based Analytics |
| Hybrid AI and Rule-Based Analytics |
| Edge / On-Premises |
| Cloud-Based |
| Hybrid |
| Electronics and Semiconductors |
| EV and Battery Manufacturing |
| Automotive |
| Pharmaceutical and Medical Devices |
| Food and Beverage |
| Aerospace and Defense |
| Logistics and Warehousing |
| Other End-User Industries |
| North America | United States |
| Canada | |
| Mexico | |
| South America | Brazil |
| Argentina | |
| Chile | |
| Rest of South America | |
| Europe | Germany |
| United Kingdom | |
| France | |
| Italy | |
| Spain | |
| Rest of Europe | |
| Asia-Pacific | China |
| Japan | |
| India | |
| South Korea | |
| Australia | |
| Rest of Asia-Pacific | |
| Middle East | United Arab Emirates |
| Saudi Arabia | |
| Qatar | |
| Rest of Middle East | |
| Africa | South Africa |
| Egypt | |
| Nigeria | |
| Rest of Africa |
| By Analytics Type | Defect and Anomaly Analytics | |
| Dimensional and Measurement Analytics | ||
| Pattern and Classification Analytics | ||
| Process Quality Analytics | ||
| Predictive Quality Analytics | ||
| Other Analytics Types | ||
| By Technology | AI / Deep Learning-Based Analytics | |
| Traditional Rule-Based Analytics | ||
| Hybrid AI and Rule-Based Analytics | ||
| By Deployment | Edge / On-Premises | |
| Cloud-Based | ||
| Hybrid | ||
| By End-User Industry | Electronics and Semiconductors | |
| EV and Battery Manufacturing | ||
| Automotive | ||
| Pharmaceutical and Medical Devices | ||
| Food and Beverage | ||
| Aerospace and Defense | ||
| Logistics and Warehousing | ||
| Other End-User Industries | ||
| By Geography | North America | United States |
| Canada | ||
| Mexico | ||
| South America | Brazil | |
| Argentina | ||
| Chile | ||
| Rest of South America | ||
| Europe | Germany | |
| United Kingdom | ||
| France | ||
| Italy | ||
| Spain | ||
| Rest of Europe | ||
| Asia-Pacific | China | |
| Japan | ||
| India | ||
| South Korea | ||
| Australia | ||
| Rest of Asia-Pacific | ||
| Middle East | United Arab Emirates | |
| Saudi Arabia | ||
| Qatar | ||
| Rest of Middle East | ||
| Africa | South Africa | |
| Egypt | ||
| Nigeria | ||
| Rest of Africa | ||


Key Questions Answered in the Report
What is the size of the vision-based quality analytics market?
The vision-based quality analytics market size is USD 1.76 billion in 2026 and is projected to reach USD 3.53 billion by 2031 at a 14.94% CAGR.
Which analytics category has the largest share?
Defect and Anomaly Analytics led with 32.67% share in 2025, supported by broad use in electronics, automotive, and food processing. These settings rely on frequent pass-fail decisions for surfaces, structures, components, and finished assemblies during routine production.
Which technology is growing fastest in vision-based quality analytics?
AI/Deep Learning-Based Analytics is projected to expand at a 15.63% CAGR through 2031 as manufacturers use it for variable and complex inspection tasks.
Why do manufacturers use edge deployment for inspection?
Edge deployment held 61.45% share in 2025 because high-speed lines need low-latency decisions close to the production equipment. It allows plants to process visual data locally and keep inspections aligned with production timing, rather than depending on an external response for each unit.
Which end-user sector is expanding fastest?
EV and Battery Manufacturing is forecast to grow at a 16.07% CAGR through 2031, driven by cell-format variation, weld checks, and traceability needs. Manufacturers need inspection systems that can address cylindrical, prismatic, and pouch cells while maintaining visibility into production quality.
Which region leads demand for vision-based quality analytics?
Asia-Pacific held 36.12% share in 2025 and is expected to grow at a 16.21% CAGR through 2031 because of its electronics, semiconductor, and battery production base. Manufacturing activity in China, South Korea, Japan, Taiwan, India, and Southeast Asia supports continuing demand for high-precision inspection.
Page last updated on:





