
Market Overview
| Study Period | 2019 - 2031 |
|---|---|
| Market Size (2026) | USD 17.45 Billion |
| Market Size (2031) | USD 22.89 Billion |
| Growth Rate (2026 - 2031) | 5.58 % |
| Fastest Growing Market | Middle East and Africa |
| Largest Market | North America |
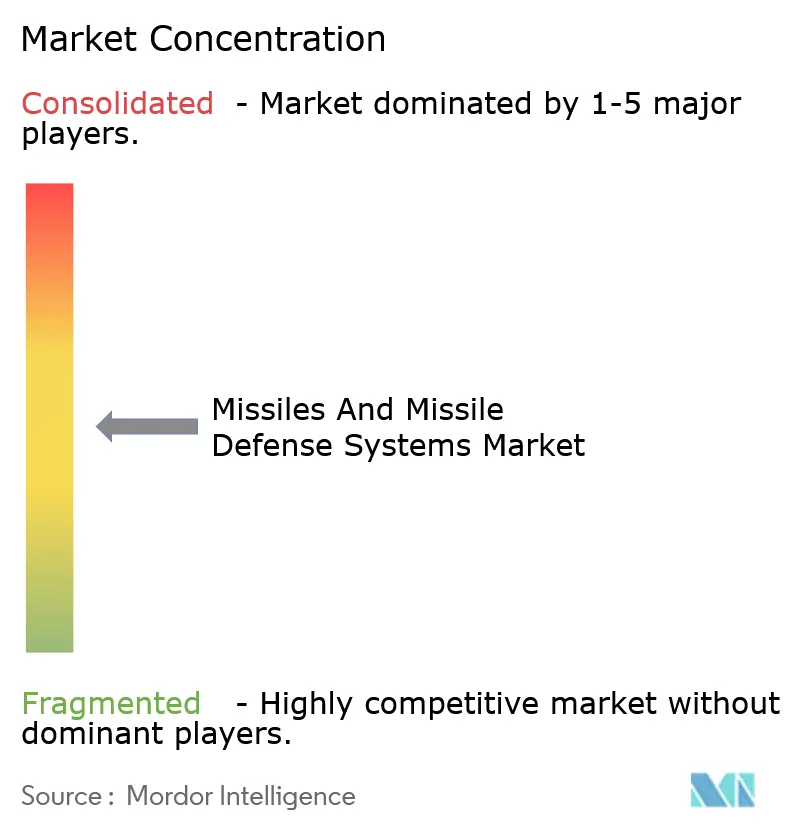
| Market Concentration | Medium |
Major Players *Disclaimer: Major Players sorted in no particular order Image © Mordor Intelligence. Reuse requires attribution under CC BY 4.0. | |
Missiles and Missile Defense Systems Market Analysis by Mordor Intelligence
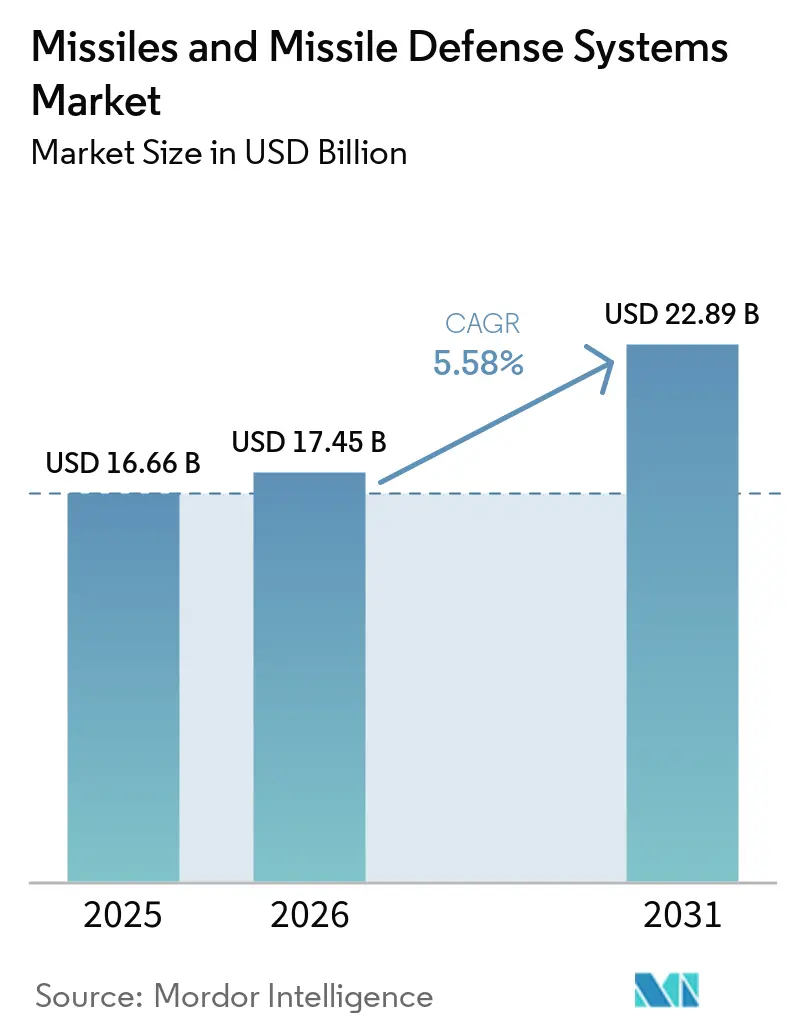
The missiles and missile defense systems market size is expected to grow from USD 16.66 billion in 2025 to USD 17.45 billion in 2026 and is forecasted to reach USD 22.89 billion by 2031 at a 5.58% CAGR over 2026-2031. This growth is supported by the rising procurement of short-range interceptors for active conflict zones, expanding orders for intermediate-range platforms that deter stand-off strikes, and the rapid adoption of space-based sensor layers that enhance tracking fidelity. [1] Nations are transitioning from episodic purchases to multi-year framework agreements that ensure propellant and semiconductor supply, a shift that lowers unit costs but concentrates risk among a few tier-1 vendors. Hypersonic threat proliferation is steering research funding toward kinetic-kill vehicles capable of engaging Mach 15 targets, while artificial-intelligence guidance upgrades are making export-controlled systems more attractive to treaty allies. Competitive pressure is intensifying as vertically integrated Asian contractors bundle missiles with radar and command software, forcing Western primes to safeguard gallium-nitride supply through upstream investments.
Key Report Takeaways
- By range, short-range systems held 37.89% of the missiles and missile defense systems market share in 2025, while intermediate-range platforms are forecast to expand at a 6.25% CAGR to 2031.
- By system type, missile-defense interceptors accounted for 51.45% of the missiles and missile defense systems market size in 2025, and anti-aircraft missiles are expected to track the fastest growth at a 5.89% CAGR through 2031.
- By platform, land-based launchers captured 47.95% of the revenue in 2025; space-based assets are growing at an 8.35% CAGR.
- By end user, the army led with 41.20% of spending in 2025, while the navy logged a 6.45% CAGR through 2031.
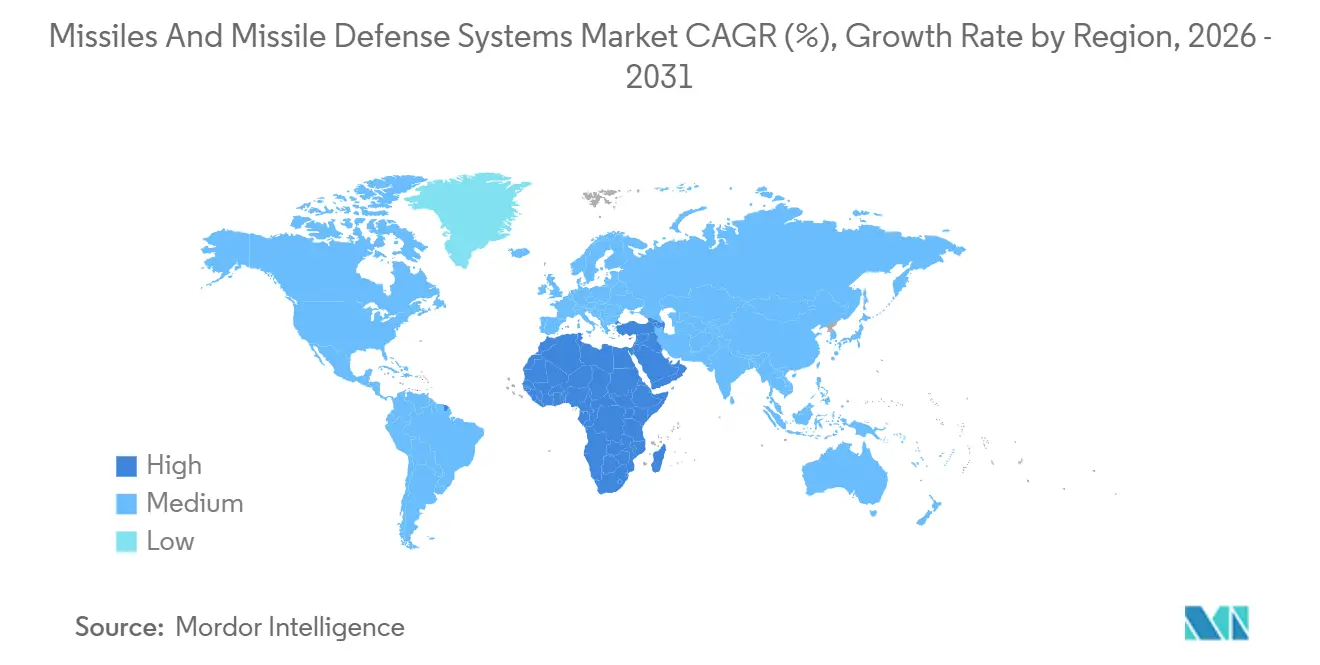
- By geography, North America accounted for 35.65% of the revenue in 2025, while the Middle East and Africa are expected to grow at the fastest rate, with a 6.78% CAGR through 2031.
Note: Market size and forecast figures in this report are generated using Mordor Intelligence’s proprietary estimation framework, updated with the latest available data and insights as of January 2026.
Market Trends and Insights
Drivers Impact Analysis of Missiles and Missile Defense Systems Market*
| Driver | (~) % Impact on CAGR Forecast | Geographic Relevance | Impact Timeline |
|---|---|---|---|
| Escalating great-power tensions and sustained defense-budget growth | +1.2% | North America, Europe, Asia-Pacific | Long term (≥ 4 years) |
| Global shift toward layered Integrated Air and Missile Defense procurements | +0.9% | North America, Europe, Middle East, Asia-Pacific | Medium term (2–4 years) |
| Rapid emergence of hypersonic threats accelerating interceptor and sensor demand | +1.1% | North America, Russia, China, allied nations | Medium term (2–4 years) |
| AI-enabled guidance, C2 and sensor-fusion boosting accuracy and exportability | +0.8% | North America, Europe, Israel | Short term (≤ 2 years) |
| National strategic-stockpile programs securing long-term energetics offtake | +0.6% | North America, Europe, Asia-Pacific | Long term (≥ 4 years) |
| Proliferated space-based tracking constellations lowering entry barriers | +0.7% | United States, Europe, emerging space powers | Medium term (2–4 years) |
| Source: Mordor Intelligence | |||
Escalating Great-Power Tensions and Sustained Defense-Budget Growth
Defense budgets continue to rise, led by a US request of USD 849.8 billion for fiscal 2025 that earmarks USD 33.7 billion for missile defense programs. China’s official allocation rose to USD 236 billion in 2025, while independent estimates suggest real spending is significantly higher. [2] Middle-power states respond by accelerating purchases, as seen in Poland’s USD 3.5 billion Javelin order, which locked in semiconductor supply and reduced unit costs. Multi-year agreements now dominate procurement, smoothing production lines for energetics and launch vehicles. This steady funding cycle supports the missiles and missile defense systems market by guaranteeing volume for prime contractors and their upstream suppliers.
Global Shift Toward Layered Integrated Air and Missile Defense Procurements
Nations are integrating radars, satellites, and airborne sensors into a single command network that cues any interceptor from any sensor. NATO’s 2024 Brussels communiqué mandates the implementation of Link 16 and Cooperative Engagement Capability by 2028. [3]Germany’s IRIS-T SLM and Spain’s Patriot PAC-3 MSE buys include software radios that enable real-time track handoff. The resulting demand boost extends beyond missiles to open-architecture launchers and battle-management software vendors, broadening revenue opportunities inside the missiles and missile defense systems market.
Rapid Emergence of Hypersonic Threats Accelerating Interceptor and Sensor Demand
Russia’s Avangard and China’s DF-ZF glide vehicles highlight the need for interceptors that maneuver at high-G loads. The US Missile Defense Agency budgeted USD 4.7 billion for the Glide Phase Interceptor, aiming for fielding by 2029. Japan’s USD 1.2 billion contract with Mitsubishi Heavy Industries to create a hypersonic Chu-SAM variant shows allied urgency. Heat-resistant composites and divert-control systems become bottlenecks, concentrating market power in firms with wind tunnels and ceramics expertise. These challenges elevate R&D spending, yet they also raise switching costs that favor incumbents in the missiles and missile defense systems market.
AI-Enabled Guidance, C2 and Sensor-Fusion Boosting Accuracy and Exportability
Lockheed Martin’s Long Range Anti-Ship Missile integrates a neural network that classifies maritime targets when GPS is jammed. Israel’s Iron Dome reduced intercept cost by 18% after adding machine-learning allocation logic. The US State Department has green-lit Patriot AI upgrades for Poland, noting that adaptive algorithms are complex to reverse-engineer, which eases export approvals. As autonomy advances, nations seek systems that maximize hit probability at a lower cost per shot, thereby reinforcing demand in the missiles and missile defense systems market.
Restraints Impact Analysis of Missiles and Missile Defense Systems Market*
| Restraint | (~) % Impact on CAGR Forecast | Geographic Relevance | Impact Timeline |
|---|---|---|---|
| Extremely high R&D and unit-procurement costs | -0.7% | Global, smaller defense budgets | Long term (≥ 4 years) |
| Tightening export-control and compliance regimes | -0.5% | Global, acute for non-aligned nations | Medium term (2–4 years) |
| Heat-resistant material and GaN TR-module supply-chain bottlenecks | -0.6% | North America, Europe, Asia-Pacific | Short term (≤ 2 years) |
| Rising cyber-security and system-integration risk profile | -0.4% | NATO and allied nations | Medium term (2–4 years) |
| Source: Mordor Intelligence | |||
Extremely High R&D and Unit-Procurement Costs
Next-generation interceptors carry price tags many buyers cannot absorb. The Glide Phase Interceptor program totals USD 18.9 billion, with a projected unit cost of near USD 45 million, which dwarfs the USD 3 million price of the PAC-3 MSE. European Sky Shield pools 15 nations to gain IRIS-T volume discounts, but collective buying slows schedules. As costs rise, some governments trim orders, eroding economies of scale and restraining growth in the missiles and missile defense systems market.
Tightening Export-Control and Compliance Regimes
ITAR, MTCR, and the EU Dual-Use Regulation now cover machine-learning guidance software, which adds paperwork and increases the risk of rejection. A 2024 ITAR denial blocked Javelin sales to a Southeast Asian state, steering the buyer toward Turkish alternatives. The result is a bifurcated supply chain, where Western manufacturers serve treaty allies. At the same time, Russia, China, and Turkey fill gaps elsewhere, limiting the total accessible revenue for some vendors in the missiles and missile defense systems market.
*Our forecasts treat driver/restraint impacts as directional, not additive. The impact forecasts reflect baseline growth, mix effects, and variable interactions.
Missiles and Missile Defense Systems Market Segment Analysis
By Range:
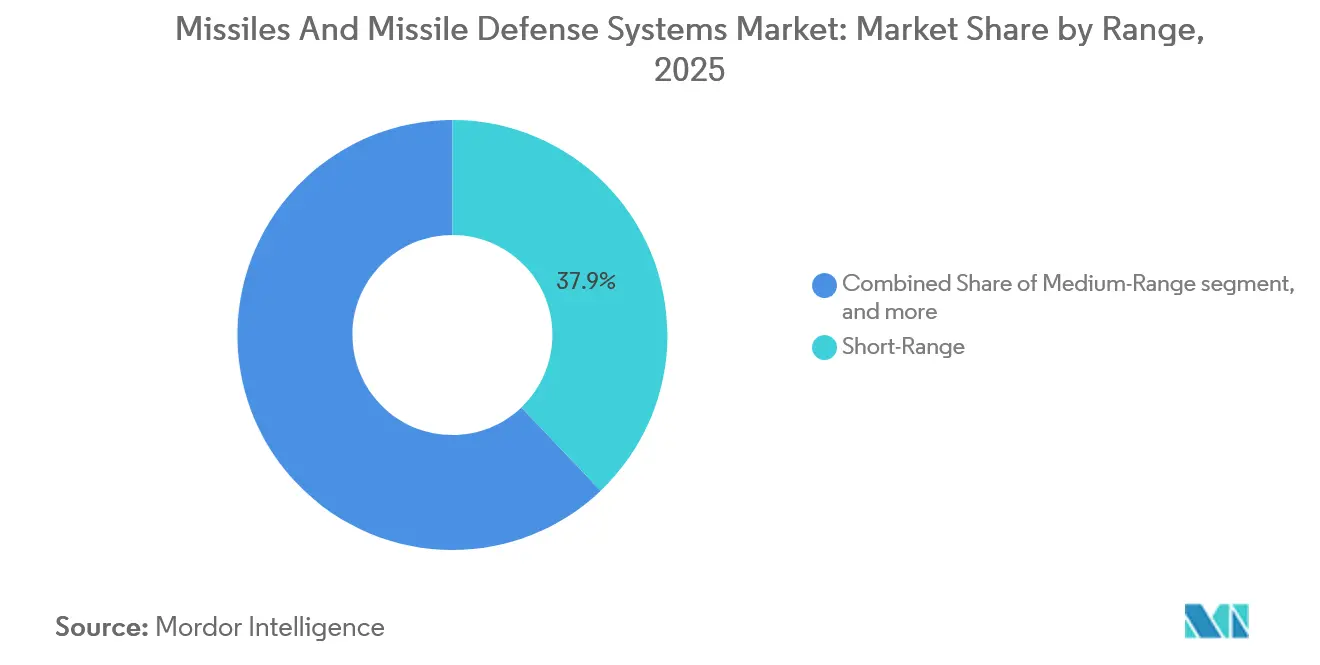
Tactical Dominance Meets Strategic HedgingShort-range platforms generated 37.89% of 2025 revenue, illustrating the tactical urgency that keeps production lines active for low-cost interceptors. The missiles and missile defense systems market size for short-range solutions is expanding as armies counter drones and loitering munitions that evade heavy radars. Mobile batteries, such as the IRIS-T SLM, achieved a 95% intercept success rate in 2024 operations, strengthening buyer confidence. Volume demand supports economies of scale that hold unit prices steady despite gallium-nitride shortages. Suppliers leverage standard launch canisters across ranges to streamline logistics.
Intermediate-range systems are forecast to rise at a 6.25% CAGR through 2031, reflecting strategic hedging against regional stand-off weapons. Japan’s 2025 Tomahawk purchase demonstrates how democracies can expand their reach without violating nuclear treaties. Although lower in volume, these missiles generate premium margins, thereby lifting the overall market for missiles and missile defense systems. Manufacturers manage the diverse portfolio by sharing seeker electronics and propulsion sub-assemblies between ranges, smoothing production planning across cycles.

By Missile and Defense System Type:
Interceptors Lead, Anti-Aircraft GainsInterceptor programs brought 51.45% of 2025 revenue, making them the cornerstone of the missiles and missile defense systems market share. THAAD, Arrow 3, and Ground-based Midcourse Defense fill the exo-atmospheric niche that demands high-priced kinetic kill vehicles. In the ground-based aircraft and missile defense systems market, the upgrades include equipping the recently deployed GBIs with an advanced booster and a more capable Exo-atmospheric Kill Vehicle (EKV). Open-architecture launchers now accept multiple interceptor types, enabling forces to tailor loadouts to specific scenarios and extend platform life.
Anti-aircraft missiles are projected to expand at a rate of 5.89% through 2031, as low-altitude cruise missiles challenge traditional radar defenses. NASAMS sales to Ukraine proved the value of mobile command-and-control kits that network with legacy radars. Suppliers retrofit seekers with software upgrades instead of hardware swaps, cutting integration time. This agility widens adoption across smaller militaries and underscores the diversity within the missiles and missile defense systems market.
By Platform:
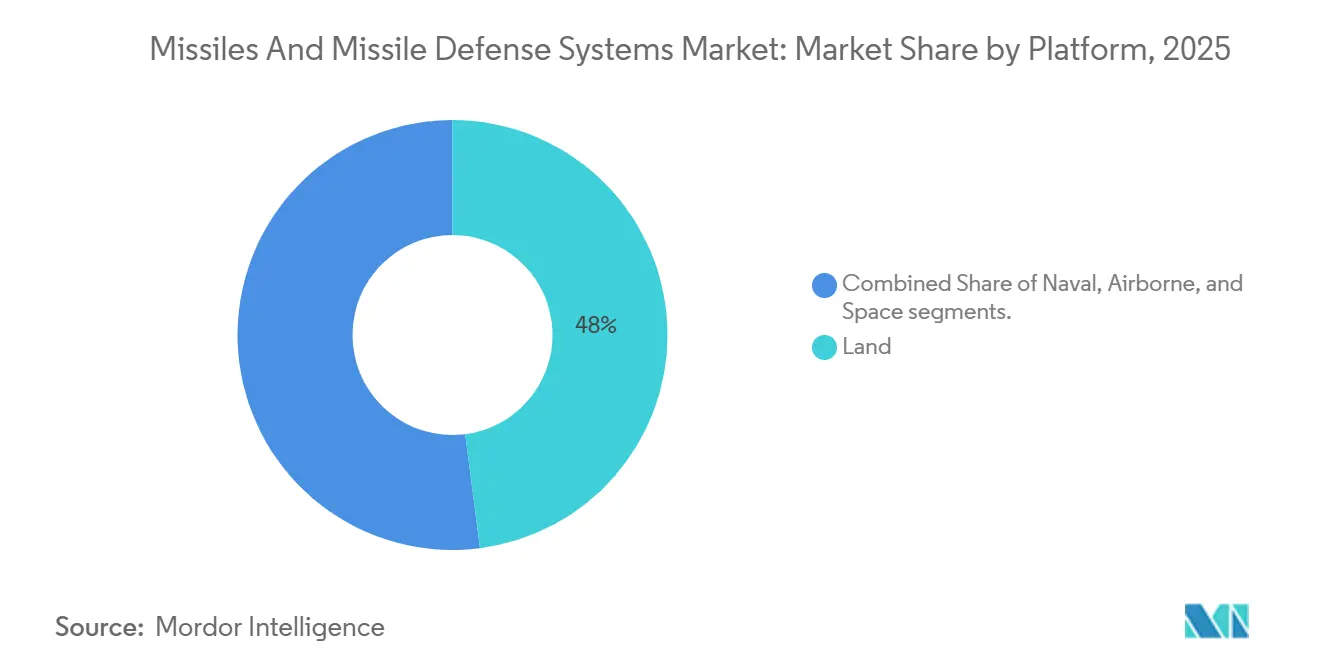
Land Anchors, Space AcceleratesLand-based launchers accounted for 47.95% of 2025 revenue, driven by vehicles that can quickly reposition when sensors detect threat vectors. Crew training pipelines already exist, lowering entry barriers for new batteries. Standardized rail launchers accept guided rockets, cruise missiles, and interceptors, maximizing tactical flexibility.
Space-based assets show the fastest momentum with an 8.35% CAGR. The Tracking Layer’s 126 satellites incur an incremental cost of USD 15 million each, a fraction of the cost of past geostationary platforms. Commercial data-as-a-service models enable middle-income states to purchase cueing feeds without sovereign launch programs, thereby broadening the customer reach for the missiles and missile defense systems industry. Ground contractors that translate raw infrared data into fire-control tracks are capturing value once reserved for satellite builders.
By End-User:
Army Leads, Navy ClimbsArmy formations accounted for 41.20% of 2025 spending, emphasizing forward-deployed units that require immediate protection against rockets and drones. The IAMD Battle Command System integrates Patriot, THAAD, and future hypersonic interceptors into a single, unified console, thereby enhancing situational awareness for operators.
Naval budgets grow at a 6.45% CAGR because fleets integrate vertical-launch cells that fire both anti-ship and ballistic interceptors. Japan’s Maya-class destroyers demonstrate how a single hull can accommodate multiple mission sets, justifying investment despite limited ship numbers. Multimission capacity ensures steady demand for radar upgrades and software licenses, boosting recurring revenue within the missiles and missile defense systems market size calculation for naval platforms.
Geography Analysis
North America Missiles and Missile Defense Systems Market
North America accounted for 35.65% of 2025 revenue, driven by the United States’ layered IAMD architecture and Canada’s NORAD modernization. The 2025 US Missile Defense Agency budget allocates USD 13.5 billion for next-generation interceptors, thereby preserving domestic production lines. Canada’s CAD 4.9 billion (USD 5.16 billion) North Warning System upgrade funds over-the-horizon radars that detect glide vehicles. Regional dominance stems from dense contractor ecosystems and test ranges, though future congressional caps could temper spending growth.
MEA Missiles and Missile Defense Systems Market
The Middle East and Africa region is the fastest-growing, with a 6.78% CAGR. Saudi Arabia fielded THAAD under a USD 15 billion program, adding exo-atmospheric coverage to Patriot batteries. The United Arab Emirates expanded PAC-3 deployments to protect infrastructure after drone raids. Israel sustains a layered defense by procuring Iron Dome, David’s Sling, and Arrow interceptors, creating a robust local supply chain that feeds regional exports. Emerging buyers in Sub-Saharan Africa signal new demand for locally assembled missiles.
APAC Missiles and Missile Defense Systems Market
Asia-Pacific pursues domestic development to ease ITAR constraints. Japan spends USD 5.1 billion on a hypersonic Chu-SAM interceptor. South Korea’s L-SAM intercepted a ballistic target at 50 km altitude and is moving to production in 2027. India flight-tested the Agni-Prime with a canister launch, enhancing its survivability. China’s DF-17 expansion prompts neighbors to accelerate the development of sensor networks, thereby enlarging the market for missiles and missile defense systems in the region.
Regulatory Landscape
Missiles and missile defense systems operate under overlapping national security, acquisition, and export-control regimes that shape who can buy, what configurations can be transferred, and how quickly programs progress from development to fielding. In the United States, national missile defense policy is anchored in 10 U.S.C. 5501, while defense acquisition and oversight mechanisms such as the Missile Defense Executive Board (MDEB) determine how Missile Defense Agency (MDA) elements are prioritized and integrated across the force.
From 2025 to 2026, policy updates increased focus on hypersonic defense and allied burden sharing while retaining nonproliferation safeguards. DoDD 5134.20E (April 2025) established the MDA Director as the DoD Executive Agent for Hypersonic Defense, and the 2026 National Defense Strategy (January 2026) reinforced integrated air and missile defense as a core homeland and allied posture objective. Export and foreign military sale pathways continue to act as market gatekeepers, including a Federal Register transmittal (April 2026) authorizing the export and sale of Patriot PAC-3 MSE missiles to Saudi Arabia, and updated U.S. MTCR policy guidance (January 2025) that enables more flexible, case-by-case review of certain Category I exports to vetted partners.
Value Chain Analysis
The value chain runs from requirements definition and program budgeting through system architecture and integration (radars, C2, launchers, and interceptors), component supply (seekers, guidance electronics, propulsion, energetic materials, and canisters), final assembly and test, certification, and through-life sustainment (recertification, software updates, and spares). A defining feature is the concentration of critical sub-tiers, where propulsion and seeker supply can set the production tempo for multiple missile families, and where shared suppliers create ripple effects across Patriot, THAAD, SM-series interceptors, and long-range strike inventories.
Industrial-base signals in 2026 highlight both scaling efforts and chokepoints. Reporting in 2026 emphasized solid rocket motors, propellant ingredients, and specialized workforce as persistent bottlenecks, with a noted Patriot-round backlog used to illustrate the gap between demand and 2025-era production rates. Primes and governments are also using multiyear procurement, direct supplier funding, and allied coproduction to add resilience, including PAC-3 MSE component manufacturing in Spain and THAAD canister and pallet localization in Saudi Arabia. These shifts move more value toward sub-tier capacity (propellant, cast-and-cure equipment, seekers, and quality inspection) and toward integration houses that can qualify changes without slowing deliveries.
Competitive Landscape
The missiles and missile defense systems market shows moderate concentration. Western primes race to debut glide-phase interceptors, while Asian contractors bundle missiles with radars to undercut prices. Lockheed Martin and Northrop Grumman push Mach 15 interceptors despite fixed-price contract risks that penalize overruns.
Vertical integration is a clear theme. RTX acquired a stake in Wolfspeed to secure gallium-nitride wafer capacity, thereby shortening radar lead times. European players joined forces when MBDA and Thales formed a EUR 450 million (USD 525.11 million) venture to craft a continental hypersonic interceptor, diversifying away from US supply chains.
Disruptors emerge from Turkey and South Korea. Roketsan’s SOM cruise missile secured a USD 450 million export sale due to flexible end-use terms that bypassed strict ITAR clauses. Hanwha Aerospace co-produces Chunmoo launchers in Poland, expanding its industrial reach into Europe. Smaller specialists in modular launchers, such as Kongsberg, capture value with open-architecture designs that reduce integration costs for multinational fleets.
Missiles and Missile Defense Systems Industry Leaders
-
Lockheed Martin Corporation
-
RTX Corporation
-
Northrop Grumman Corporation
-
The Boeing Company
-
MBDA
- *Disclaimer: Major Players sorted in no particular order
Missiles and Missile Defense Systems Market Companies Covered in this Report
- RTX Corporation
- Lockheed Martin Corporation
- Northrop Grumman Corporation
- The Boeing Company
- MBDA
- Israel Aerospace Industries Ltd.
- Saab AB
- Kongsberg Gruppen ASA
- RAFAEL Advanced Defense Systems Ltd.
- Hanwha Aerospace
- L3Harris Technologies, Inc.
- Diehl Stiftung & Co. KG
- Thales Group
- Bharat Dynamics Limited.
- China Aerospace Science and Technology Corporation
- Roketsan A.Ş.
Read Analysis of Missiles and Missile Defense Systems Companies
Market Opportunities and Future Outlook
A major opportunity area is throughput expansion for high-demand interceptors and associated subsystems (seekers, propulsion, canisters, and integration test), as procurement behavior shifts from episodic buys to long-duration frameworks that support capital investment. 2026 evidence includes Lockheed Martin receiving a seven-year procurement award, up to USD 35 billion, to accelerate and scale THAAD interceptor output, and L3Harris breaking ground on new Arkansas facilities to increase PAC-3 propulsion capacity using automated casting and AI-enabled inspection. Alongside interceptor scaling, RTX expanded the Redstone Raytheon Missile Integration Facility in Huntsville, Alabama, by 26,000 square feet, lifting integration capacity by more than 50%, and supporting higher delivery rates across missile programs.
A second opportunity is integration of layered architectures across platforms, which pulls demand toward open interfaces, battle management, and cross-domain sensor cueing, including space-enabled tracking feeds that widen the ecosystem beyond traditional missile OEMs. NATO interoperability targets such as Link 16 and Cooperative Engagement Capability implementation by 2028, together with U.S. investments in space-based tracking layers, create whitespace for suppliers that can harden networks, fuse multi-sensor data into fire-control-quality tracks, and certify missile-to-C2 integrations across land and naval combat systems. Export authorizations and policy adjustments also continue to define accessible demand pools, with recent U.S. actions supporting allied Patriot and PAC-3 MSE pathways that then drive follow-on needs for sustainment, recertification, and software upgrades.
Recent Industry Developments in Missiles and Missile Defense Systems Market
- July 2026: RTX (Raytheon) announced a partnership with Diehl Defence to double Stinger missile production in Europe. The agreement expands allied industrial participation and adds a nearer-to-user supply option for short-range air defense inventories under replenishment pressure.
- June 2026: Lockheed Martin received a seven-year contract action to accelerate and expand THAAD interceptor production, including a ramp from 96 to 400 missiles per year. The multiyear structure provides demand visibility that supports supplier onboarding, workforce scaling, and manufacturing automation across the interceptor value chain.
- December 2025: TAURUS Systems GmbH (a joint venture between MBDA and Saab) won a BAAINBw contract to set up a serial production line for the TAURUS NEO stand-off guided missile. Establishing serial production strengthens European deep-strike manufacturing capacity and reduces schedule risk for follow-on procurement once qualification and industrial readiness milestones are met.
Missiles and Missile Defense Systems Market Report Scope and Research Methodology
Market Definition and Coverage
This market covers the value of military missiles and missile defense systems delivered through procurement programs, including interceptor missiles, air defense missiles, and the connected system elements needed to detect, track, and engage threats (such as launchers and fire control and sensor integration).
Scope exclusions: We exclude space launch vehicles and purely civilian rockets, along with unrelated ground support equipment that is not integral to missile or missile defense engagement.
Segments Covered in This Report
- By Range
- Short-Range (Less than 1 000 km)
- Medium-Range (1 000–3 000 km)
- Intermediate-Range (3 001–5 500 km)
- Intercontinental (More than 5 500 km)
- By Missile and Defense System Type
- Missile-Defense Interceptors
- Anti-Aircraft Missiles
- Anti-Ship Missiles
- Anti-Tank Missiles
- By Platform
- Land
- Naval
- Airborne
- Space
- By End-User
- Army
- Navy
- Air Force
- By Geography
- North America
- United States
- Canada
- Mexico
- Europe
- United Kingdom
- France
- Germany
- Russia
- Rest of Europe
- Asia-Pacific
- China
- India
- Japan
- South Korea
- Rest of Asia-Pacific
- South America
- Brazil
- Rest of South America
- Middle East and Africa
- Middle East
- Saudi Arabia
- United Arab Emirates
- Israel
- Rest of Middle East
- Africa
- South Africa
- Rest of Africa
- Middle East
- North America
Data Sources, Market Sizing, and Validation
Desk Research
Desk research starts with building a clean fact base for defense demand, industrial capacity signals, and procurement timing. We mainly review public defense budget documents and procurement releases, plus defense ministry and armed forces announcements that describe new orders, upgrades, and planned deliveries.
For cross checks, we refer to sources such as Stockholm International Peace Research Institute (SIPRI) defense spending series, U.S. DoD budget justification books and selected contract notices, NATO defense expenditure releases, UN Comtrade trade statistics for relevant munitions categories, and government accountability or audit publications that flag schedule and cost changes. Company annual reports, investor presentations, and reliable press coverage help confirm program milestones and shipment timing. We also use a paid subscription focused on defense related market information to map platforms and programs to likely missile and interceptor categories faster. These sources are not exhaustive, and we also used other public references for data collection, validation, and clarification.
Primary Interviews and Surveys
Primary work is used to pressure test the model assumptions around what gets counted as a missile or a missile defense system, and when revenue is typically recognized across multi year programs. We spoke with a mix of program, engineering, and commercial roles across system integrators, subsystem suppliers, and downstream defense users across APAC, EMEA, and the Americas. Follow up questions were used to resolve gaps found in the desk research, especially where definitions differed between system elements and missile-only revenue lines.
Distribution of primary research fieldwork respondents
| Company type | Respondent position | Region |
|---|---|---|
| Top tier: 38% | CXOs: 15% | APAC: 44% |
| Mid tier: 46% | Functional/Unit leaders: 33% | EMEA: 33% |
| Smaller Players: 16% | Managers: 52% | Americas: 23% |
Market-Sizing & Forecasting
Sizing starts from a top-down build where defense budget lines, publicly visible procurement quantities, and program level delivery calendars are used to reconstruct annual spend tied to missiles and missile defense systems. Those totals are then corroborated with selective bottom-up approximations using sampled unit volumes multiplied by typical unit pricing ranges, plus channel checks on interceptor reloads, launcher batteries, and radar and fire control upgrades that are commonly bundled into system awards.
Key inputs in the model include announced procurement quantities and contract award values, regional defense spending direction, the mix shift toward air and missile defense versus offensive missile programs, delivery and acceptance timelines, and the pace of modernization programs for short range and medium range threats (including hypersonic tracking and intercept priorities where relevant). When a program has limited price visibility, we fill the gap using a range based on comparable program benchmarks and then narrow it after interview feedback.
For forecasting, scenario analysis is used because defense procurement is strongly influenced by budget cycles and geopolitical triggers. Variables such as multi year budget commitments, known replacement cycles, and announced force structure plans are projected forward, then adjusted through expert consensus on what is likely to slip, get accelerated, or be re-scoped.
Data Validation & Update Cycle
Outputs are checked through several layers so that the final series is consistent with how defense programs are planned and funded. We compare totals against independent signals like defense budget growth, publicly announced program counts, and implied spend per system for major categories, and then investigate outliers before sign off.
Anomaly checks include year to year jumps that are not supported by contract activity, double counting risks between missiles and supporting system elements, and currency conversion timing for multi currency awards. Reports are refreshed annually, with interim updates when material events occur, and a final pre-delivery pass is completed so clients receive the latest updated view.
Mordor Intelligence's Missiles and Missile Defense Systems Market Size Compared Against Other Published Estimates
Published numbers for this market often move apart because sources do not count the same things, and they also do not anchor the timing of spend in the same way. Differences usually come from whether the estimate is focused on missile defense only or includes offensive missiles, how platforms and system elements are bundled, and which year is treated as the current reference point.
Major procurement awards, budget justification books, and program delivery schedules are the evidence checks that keep Mordor Intelligence tied to what is actually contracted and delivered in missiles plus missile defense systems, instead of mixing in adjacent aerospace payloads or broad military electronics. Another frequent gap comes from ASP handling, where some publications use aggressive price escalation assumptions, or they use a long forecast window that smooths near term procurement waves and understates short cycle replenishment demand.
Benchmark comparison
| Source | Market Size | Gaps in Research Methodology |
|---|---|---|
| Mordor Intelligence | USD 17.45 B (2026) | |
| Global Research Publisher A | USD 25.66 B (2024) | Uses a different base year and broader category mapping that can blend missile defense with wider missile families and reported sales revenue, which can inflate totals versus a procurement and delivery aligned view. |
| Defense Analytics Firm B | USD 40.00 B (2024) | Appears to include a wider MMDS scope and may group more system level content into the headline figure, and the published number is presented as a threshold value which can bias the estimate upward. |
Looking across the three figures, the spread is mostly explained by scope boundaries and timing choices, not by a single demand disagreement. When the counted items stay tightly linked to identifiable programs and an annual delivery cadence, the market size becomes easier to reproduce, audit, and refresh as new contract and budget information becomes public.
Key Questions Answered in the Report
How large is the missiles and missile defense systems market in 2026?
The market stands at USD 17.45 billion in 2026 and is forecast to reach USD 22.89 billion by 2031.
Which range category leads current purchases?
Short-range systems hold 37.89% of 2025 revenue because armies need rapid-reaction interceptors for drones and cruise missiles.
What drives investment in space-based missile tracking?
Low-cost constellations such as the Tracking Layer cut per-satellite cost to about USD 15 million, giving middle-income states affordable access to global cueing data.
Why are interceptor programs so expensive?
Programs like the Glide Phase Interceptor involve new materials and guidance packages, pushing unit prices near USD 45 million and total R&D above USD 18 billion.
Which region is growing the fastest?
The Middle East and Africa record the highest CAGR at 6.78% as Gulf states add THAAD and Patriot batteries to counter regional ballistic threats.
How are export-control rules shaping competition?
Tightening ITAR and EU dual-use regulations divert some buyers toward suppliers in Turkey, South Korea, and China that impose fewer end-use restrictions.