Mexico Data Center Market Size and Share
Market Overview
| Study Period | 2020 - 2031 |
|---|---|
| Forecast Data Period | 2026 - 2031 |
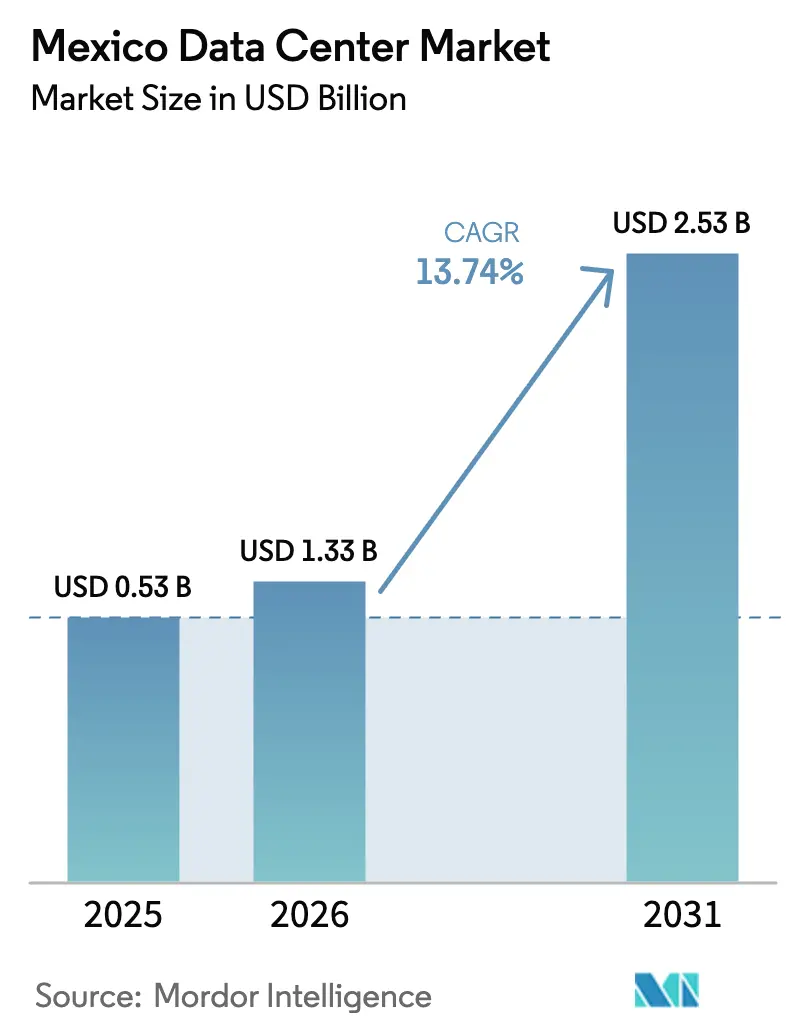
| Base Year Market Size (2025) | USD 0.53 Billion |
| Market Size (2026) | USD 1.33 Billion |
| Market Size (2031) | USD 2.53 Billion |
| Growth Rate (2026 - 2031) | 13.74% CAGR |
| Market Concentration | Medium |
Major Players *Disclaimer: Major Players sorted in no particular order Image © Mordor Intelligence. Reuse requires attribution under CC BY 4.0. | |
Mexico Data Center Market Analysis by Mordor Intelligence
The Mexico Data Center Market size was valued at USD 1.17 billion in 2025 and estimated to grow from USD 1.33 billion in 2026 to reach USD 2.53 billion by 2031, at a CAGR of 13.74% during the forecast period (2026-2031). In terms of IT load capacity, the market is expected to grow from 0.53 thousand megawatt in 2025 to 1.27 thousand megawatt by 2030, at a CAGR of 19.03% during the forecast period (2025-2030). The market segment shares and estimates are calculated and reported in terms of MW. Hyperscale commitments led by AWS (USD 5 billion) and Microsoft (USD 1.3 billion) are accelerating build-outs as U.S. cloud operators localize capacity to comply with Mexico’s stringent data-residency rules.[1]Jorge A. Rocha, “Amazon Announces $5 Billion Investment,” aa.com.tr Querétaro anchors the first wave of expansion; however, water scarcity and grid volatility are prompting operators to diversify their edge sites in border and Gulf Coast cities. Renewable-energy incentives, including self-supply wind projects, are reducing long-term PUE costs and enhancing investor interest in sustainable footprints. Meanwhile, hybrid-cloud demand from manufacturers, media platforms, and 68.7 million gamers is intensifying the need for low-latency links to U.S. networks.
Key Report Takeaways
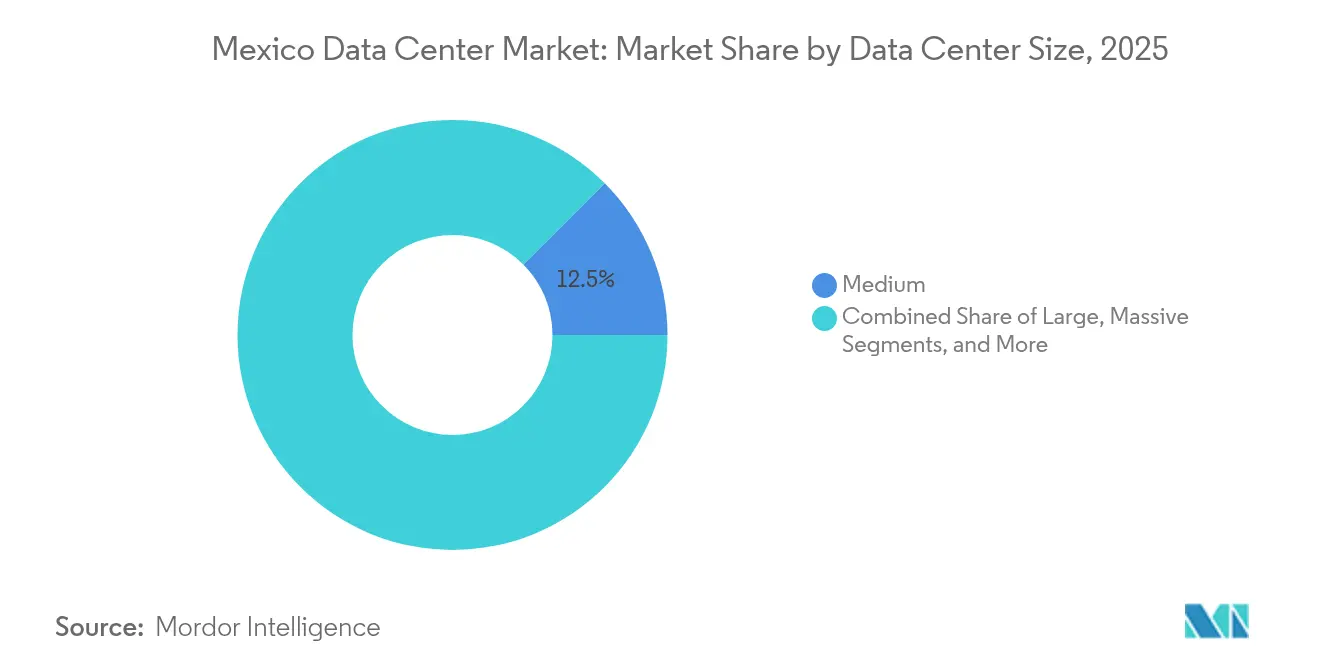
- By data center size, medium facilities accounted for 12.48% share of the Mexico data center market size in 2025 and large facilities are set to increase at 18.65% CAGR to 2031.
- By tier standard, Tier 3 facilities commanded 83.20% share of the Mexico data center market share in 2025 and Tier 4 facilities will expand at 19.15% CAGR through 2031.
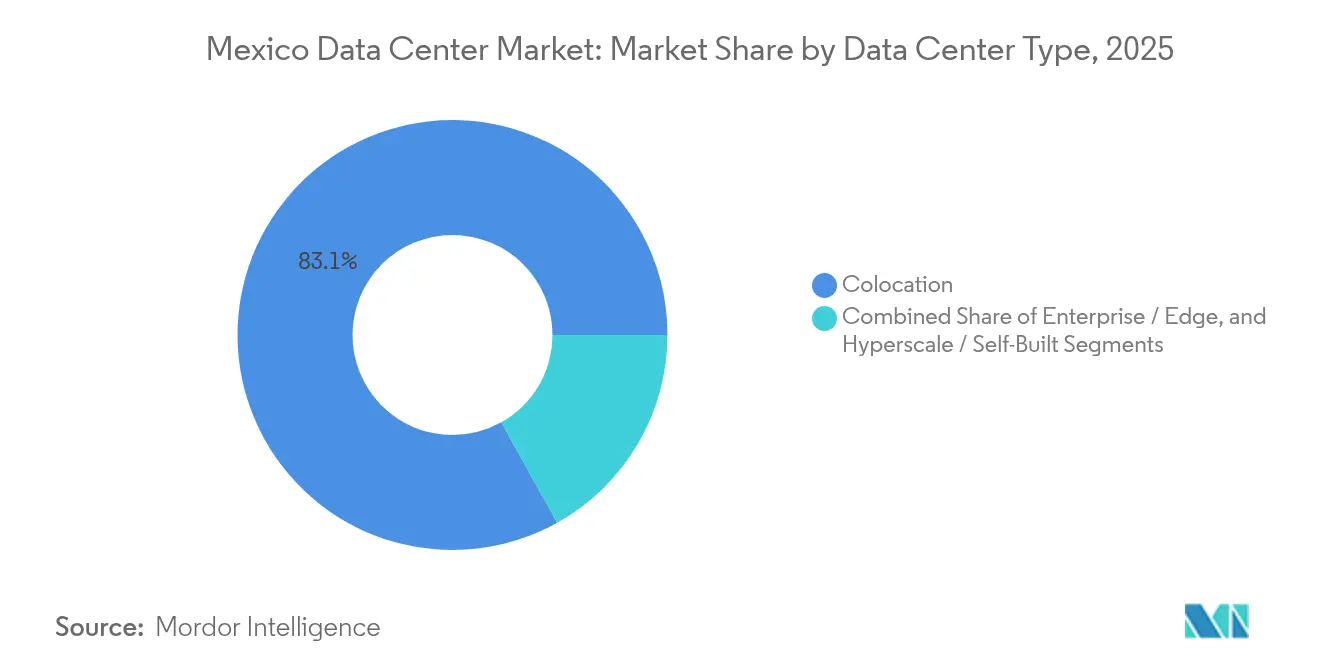
- By data center type, colocation services held 83.10% of Mexico data center market share in 2025, while enterprise and edge deployments are projected to grow at 20.05% CAGR to 2031.
- By end user industry, IT and telecom captured 48.02% share of the Mexico data center market size in 2025 and BFSI will advance at 19.25% CAGR through 2031.
- By hotspot, Querétaro led with 31.10% revenue share in 2025 in the Mexico data center market; Rest of Mexico is forecast to expand at 19.45% CAGR through 2031.
Note: Market size and forecast figures in this report are generated using Mordor Intelligence’s proprietary estimation framework, updated with the latest available data and insights as of 2026.
Mexico Data Center Market Trends and Insights
Drivers Impact Analysis*
| Driver | (~) % Impact on CAGR Forecast | Geographic Relevance | Impact Timeline |
|---|---|---|---|
| Surging hyperscale cloud expansion by U.S. tech giants | +4.2% | Querétaro, Guadalajara, Mexico City metro | Medium term (2-4 years) |
| Rising demand for low-latency edge nodes from OTT and gaming providers | +3.1% | Border cities, major metropolitan areas | Short term (≤ 2 years) |
| Data-residency mandates in fintech and telecom sectors | +3.8% | National, concentrated in financial centers | Short term (≤ 2 years) |
| Renewable-energy incentives lowering PUE costs | +2.9% | States with high solar/wind potential | Long term (≥ 4 years) |
| Mexico-U.S. interconnection tariffs enabling cheap renewable import | +2.7% | Northern border states, cross-border corridors | Medium term (2-4 years) |
| Gulf-Coast dark-fiber build-out unlocking new site locations | +2.5% | Gulf Coast states, Veracruz, Tamaulipas | Long term (≥ 4 years) |
| Source: Mordor Intelligence | |||


Surging Hyperscale Cloud Expansion by U.S. Tech Giants
AWS’s USD 5 billion region, Microsoft’s USD 1.3 billion AI hub, and Google Cloud’s 2025 launch are reshaping the Mexico data center market by anchoring hyperscale footprints that dwarf traditional colocation investments. These rollouts unlock economies of scale for fiber carriers and utilities while positioning Mexico as a near-shoring gateway for AI workloads that need sub-50 ms round-trip latency to U.S. users.[2]Jorge A. Rocha, “Amazon Announces $5 Billion Investment,” aa.com.trThe presence of all three cloud majors strengthens buyer confidence in sovereign-cloud compliance, spurring local SaaS adoption and edge build-outs. Manufacturing exporters are using these zones for real-time supply-chain analytics, boosting demand for adjacent colocation and interconnection space. The clustering effect around Querétaro is also elevating land prices, prompting operators to scout secondary corridors with equivalent fiber routes.
Rising Demand for Low-Latency Edge Nodes from OTT and Gaming Providers
Mexico’s USD 1.2 billion gaming ecosystem relies on sub-20 ms latency, forcing service providers to deploy distributed micro-data centers across Tijuana, Monterrey, and Mérida. OTT platforms are simultaneously localizing content following the 2024 digital media promotion scheme, driving cache nodes into Tier 2 cities.[3]U.S. International Trade Administration, “Mexico Media, Broadcasting and Film,” trade.gov Edge rollouts favor facilities within 30 km of cable landing points or cross-border peering sites, where bandwidth costs are 18% lower than the average in Mexico City. The resulting micro-hub network complements core hyperscale regions, creating a two-layer topology in the Mexico data center market that optimizes both cost and latency. ISPs are monetizing this shift by bundling edge hosting with managed network services tailored for streaming and cloud-gaming workloads.
Data-Residency Mandates in Fintech and Telecom Sectors
The March 2025 personal-data law requires Mexican storage for financial and telecom records, instantly converting compliance into a primary growth lever for the Mexico data center market. Banks and payment firms now procure turnkey vault-tier suites with dual-region redundancy, lifting BFSI demand at 19.89% CAGR. Telecom carriers must retain critical traffic domestically, stimulating peering-rich colocation builds in financial corridors. Hybrid-cloud adoption is rising, as regulated data stays on-prem while elastic workloads burst to North-American regions via new 400G cross-border links. Early-mover operators with ISO 27001 and PCI-DSS stamps capture premium pricing, while non-certified newcomers face elongated sales cycles and higher audit costs.
Renewable-Energy Incentives Lowering PUE Costs
Mexico’s 2025 Electricity Sector Law limits grid renewables yet allows private PPAs, enabling operators to bypass CFE tariffs through self-supply wind or solar farms. Scala Data Centers’ equity in Serena Energia secures sub-5 c/kWh pricing, reducing operating expenses per MW by 22% compared to grid benchmarks. Renewable sourcing aligns with global ESG mandates and provides a hedge against grid instability that frequently disrupts industrial zones around Mexico City. Locations in Baja California and Coahuila, endowed with 2,300 kWh/m² solar irradiance, now rank among the best-value parcels for hyperscale campuses. These incentives, therefore, shift site-selection calculus from pure fiber density toward a balanced energy-latency equation.
Restraints Impact Analysis*
| Restraint | (~) % Impact on CAGR Forecast | Geographic Relevance | Impact Timeline |
|---|---|---|---|
| Grid reliability issues and brownouts | -3.2% | National, acute in industrial zones | Short term (≤ 2 years) |
| Lengthy municipal permitting and land-zoning timelines | -2.8% | Major metropolitan areas, Querétaro | Medium term (2-4 years) |
| Scarcity of bilingual OandM talent outside CDMX | -2.1% | Secondary cities, interior regions | Long term (≥ 4 years) |
| High water-stress zones triggering cooling restrictions | -3.1% | Central Mexico, Querétaro, Bajío region | Medium term (2-4 years) |
| Source: Mordor Intelligence | |||
Grid Reliability Issues and Brownouts
Frequent voltage drops compel facilities to oversize UPS plants by 15% and diesel reserves by 36 hours, inflating capex and carbon footprints. Hyperscale builds exceeding 80 MW are queueing for dedicated substations, elongating delivery timelines by up to 18 months. Secondary cities with modern transmission upgrades, such as Monterrey, gain competitive traction over legacy hubs. Operators offset instability with modular gas-turbine arrays, though fuel hedging erodes cost savings from renewable PPAs. Persistent grid unreliability thus tempers the near-term growth outlook within the Mexico data center market despite robust demand.
High Water-Stress Zones Triggering Cooling Restrictions
CONAGUA classifies Querétaro in 100% drought, forcing local authorities to cap industrial groundwater draws and impose heat-rejection discharge limits. Hyperscale operators are pivoting to closed-loop adiabatic or direct-to-chip liquid cooling that trims water usage by 90% while marginally lifting power density. Edge-facility blueprints now prioritize air-cooled designs even in arid Bajío corridors, trading higher electricity load for regulatory certainty. Coastal sites near Veracruz are emerging as alternative landing zones, leveraging abundant municipal water and chilled-sea-water loops. Absent innovative cooling, future capacity pipelines risk throttling under environmental permit moratoriums, constraining scale-out momentum in the Mexico data center market.
*Our forecasts treat driver/restraint impacts as directional, not additive. The impact forecasts reflect baseline growth, mix effects, and variable interactions.
Segment Analysis
By Data Center Size: Balancing Mid-Scale Demand and Hyperscale Ambitions
Medium-scale facilities captured 12.48% of Mexico data center market share in 2025 as enterprises favored 5- to 15-MW halls that align with two-zone disaster-recovery layouts. Large-scale footprints are accelerating at 18.65% CAGR on the back of hyperscale self-builds that pursue economies of scale via 36-MW blocks. The Mexico data center market size for large facilities is therefore set to more than double by 2031 as cloud operators consolidate availability-zone capacity.
Consolidation drives better PUE but amplifies exposure to single-site utility risks, pushing site-selection toward dual-grid parcels or near-border solar corridors. Medium halls remain critical for latency-sensitive SaaS workloads that cannot tolerate long fiber back-hauls. The coexistence of both sizes indicates a barbell structure where hyperscale nodes coexist with localized distribution points for OTT delivery and industrial IoT streams.


By Tier Standard: Reliability Premiums Redefine Build Standards
Tier 3 inventories accounted for 83.20% of 2025 deployments, reflecting a historical preference for N+1 redundancy among enterprise colocation customers. Tier 4 builds, however, are growing at 19.15% CAGR as BFSI compliance frameworks and SLA-driven OTT platforms demand 2N fault tolerance.
Investment economics favor Tier 4 in regions where brownouts cost more than 4 minutes of outage per kVA annually. The Mexico data center market size attributable to Tier 4 halls is projected to triple by 2031, supporting mission-critical fintech workloads. Tier 2 edge pods serve caching and test-dev pipelines where cost sensitivity outweighs redundancy. This tier stratification forces operators to calibrate asset mix and pricing plans across campus-scale portfolios.
By Data Center Type: Colocation Dominance Faces Hyperscale Realignment
Colocation services accounted for 83.10% of 2025 revenue as enterprises outsourced non-core IT, but enterprise-edge builds are growing at a 20.05% CAGR, driven by 5G densification and cross-border content flows. Mexico data center market share for colocation is forecast to contract marginally as hyperscalers internalize capacity while retaining interconnection nodes within carrier-neutral meet-me rooms.
Wholesale suites above 3 MW command discounts that entice cloud operators to lease stepping-stone capacity before self-builds are energized. Retail racks stay resilient, servicing SME and SaaS rollouts that require multi-cloud on-ramps. Over the forecast horizon, successful operators will fuse colocation halls with modular edge pods to capture both sides of the demand curve.
By End User Industry: BFSI Compliance Upswing Remolds Demand Mix
IT and telecom led demand with 48.02% share of the Mexico data center market size in 2025, buoyed by telco virtualization and OTT capacity bursts. BFSI workloads are forecast to surge at 19.25% CAGR as data-localization statutes and ISO 20022 migration compel domestic hosting.
Manufacturing’s adoption of digital twin platforms, especially among near-shoring auto assemblers, sustains double-digit rack growth in Bajío states. Media-and-entertainment leverages burgeoning local production incentives, lifting GPU clusters for rendering and streaming pipelines. Government digitalization programs aim to migrate citizen-services to sovereign clouds, representing a latent catalyst starting in 2026.
Geography Analysis
Querétaro held 31.10% of national capacity in 2025 by leveraging low seismic risk, highway proximity to Mexico City, and an aerospace-driven technical labor pool. Yet, persistent drought has pushed water-usage permits into public scrutiny, prompting operators to retrofit with air-cooled temperate aisles even at the cost of 8% higher power draw. Querétaro’s pipeline of 73 announced sites through 2029 underscores its gravitational pull, but power and water constraints are accelerating contingency scouting in alternative corridors.
Guadalajara and Mexico City together represent the second tier of demand centers. Guadalajara’s electronics cluster, supported by fresh fiber laterals, attracts latency-sensitive chip-design environments, while Mexico City’s density of headquarters ensures stable colocation fill rates despite steeper land prices. Grid-hardening projects slated for 2026–2027 are expected to lower outage incidents by 25%, making both metros more attractive for Tier 4 upgrades.
Rest-of-Mexico markets, spanning Monterrey, Mérida, Veracruz, and Tijuana, are projected to grow at a 19.45% CAGR. Cross-border fiber, such as the 2,500 km Tikva route, is lowering transport unit costs by 30%, positioning northern cities as low-latency staging grounds for U.S. cloud failover workloads. Gulf-Coast metros benefit from planned subsea spur lines, offering resiliency against Pacific seismic disruptions. Collectively, these emerging clusters de-risk national capacity by distributing workloads across diverse utility and climatic profiles, reinforcing the resilience of the Mexico data center market.
Competitive Landscape
The Mexico data center market features moderate concentration, with Equinix, KIO Networks, and Scala Data Centers anchoring close to one-third of installed capacity. Equinix leverages its global Fabric interconnection layer to attract multinational SaaS tenants, while KIO extends reach through a multi-campus model spanning five Mexican states. Scala’s vertical-integration into wind assets locks in renewable supply, providing a 20-year hedge against grid volatility.
New entrants are intensifying the rivalry. EdgeConneX secured land in Monterrey to build a 50-MW edge-plus-core campus that pairs carrier-dense colo with 5-MW edge sheds for OTT caching. Layer 9’s plan for a 160-MW hyperscale build in Bajío targets power modules fed by adjacent solar farms, betting on cost advantages to lure U.S. AI workloads. CloudHQ has filed permits for a 200-MW project near Tijuana’s Mesa de Otay, capitalizing on the proximity of cross-border fiber to Silicon Valley routes.
Strategic moves trend toward energy security, advanced cooling, and scalable land banks. Operators rush to secure dual-feed substations, on-site gas turbines, and reclaimed-water systems that meet the growing scrutiny of emerging environmental regulations. Differentiation also hinges on ecosystem depth: providers offering direct cloud on-ramps and IX platforms report 18% faster rack absorption than stand-alone wholesale shells, underscoring interconnection as a revenue-multiplying lever within the Mexico data center market.
Mexico Data Center Industry Leaders
Google LLC
Oracle Cloud
Equinix Inc. (Axtel)
Telmex SA
Cirion Technologies
- *Disclaimer: Major Players sorted in no particular order


Recent Industry Developments
- April 2025: C3ntro Telecom unveiled the Tikva project, a 2,500 km fiber network linking Mexico and the U.S., expanding low-latency pathways for regional data centers.
- March 2025: Tampnet won a 200 km subsea fiber contract for Woodside’s Trion field, opening Gulf routes that will support edge compute for offshore energy operations.
- January 2025: AWS committed USD 5 billion to its Querétaro region, estimating 7,000 local jobs and 100% renewable operation once fully buill.
- September 2024: Microsoft confirmed a USD 1.3 billion AI infrastructure investment, marking its largest single-country commitment in Latin America.


Mexico Data Center Market Report Scope
Guadalajara, Querétaro are covered as segments by Hotspot. Large, Massive, Medium, Mega, Small are covered as segments by Data Center Size. Tier 1 and 2, Tier 3, Tier 4 are covered as segments by Tier Type. Non-Utilized, Utilized are covered as segments by Absorption.| Large |
| Massive |
| Medium |
| Mega |
| Small |
| Tier 1 and 2 |
| Tier 3 |
| Tier 4 |
| Hyperscale / Self-Built | ||
| Enterprise / Edge | ||
| Colocation | Non-Utilized | |
| Utilized | Retail Colocation | |
| Wholesale Colocation | ||
| BFSI |
| IT and ITES |
| E-Commerce |
| Government |
| Manufacturing |
| Media and Entertainment |
| Telecom |
| Other End Users |
| Guadalajara |
| Mexico |
| Rest of Mexico |
| By Data Center Size | Large | ||
| Massive | |||
| Medium | |||
| Mega | |||
| Small | |||
| By Tier Standard | Tier 1 and 2 | ||
| Tier 3 | |||
| Tier 4 | |||
| By Data Center Type | Hyperscale / Self-Built | ||
| Enterprise / Edge | |||
| Colocation | Non-Utilized | ||
| Utilized | Retail Colocation | ||
| Wholesale Colocation | |||
| By End User Industry | BFSI | ||
| IT and ITES | |||
| E-Commerce | |||
| Government | |||
| Manufacturing | |||
| Media and Entertainment | |||
| Telecom | |||
| Other End Users | |||
| By Hotspot | Guadalajara | ||
| Mexico | |||
| Rest of Mexico | |||


Market Definition
- IT LOAD CAPACITY - The IT load capacity or installed capacity, refers to the amount of energy consumed by servers and network equipments placed in a rack installed. It is measured in megawatt (MW).
- ABSORPTION RATE - It denotes the extend to which the data center capacity has been leased out. For instance, a 100 MW DC has leased out 75 MW, then absorption rate would be 75%. It is also referred as utilization rate and leased-out capacity.
- RAISED FLOOR SPACE - It is an elevated space build over the floor. This gap between the original floor and the elevated floor is used to accommodate wiring, cooling, and other data center equipment. This arrangement assist in having proper wiring and cooling infrastructure. It is measured in square feet (ft^2).
- DATA CENTER SIZE - Data Center Size is segmented based on the raised floor space allocated to the data center facilities. Mega DC - # of Racks must be more than 9000 or RFS (raised floor space) must be more than 225001 Sq. ft; Massive DC - # of Racks must be in between 9000 and 3001 or RFS must be in between 225000 Sq. ft and 75001 Sq. ft; Large DC - # of Racks must be in between 3000 and 801 or RFS must be in between 75000 Sq. ft and 20001 Sq. ft; Medium DC # of Racks must be in between 800 and 201 or RFS must be in between 20000 Sq. ft and 5001 Sq. ft; Small DC - # of Racks must be less than 200 or RFS must be less than 5000 Sq. ft.
- TIER TYPE - According to Uptime Institute the data centers are classified into four tiers based on the proficiencies of redundant equipment of the data center infrastructure. In this segment the data center are segmented as Tier 1,Tier 2, Tier 3 and Tier 4.
- COLOCATION TYPE - The segment is segregated into 3 categories namely Retail, Wholesale and Hyperscale Colocation service. The categorization is done based on the amount of IT load leased out to potential customers. Retail colocation service has leased capacity less than 250 kW; Wholesale colocation services has leased capacity between 251 kW and 4 MW and Hyperscale colocation services has leased capacity more than 4 MW.
- END CONSUMERS - The Data Center Market operates on a B2B basis. BFSI, Government, Cloud Operators, Media and Entertainment, E-Commerce, Telecom and Manufacturing are the major end-consumers in the market studied. The scope only includes colocation service operators catering to the increasing digitalization of the end-user industries.
| Keyword | Definition |
|---|---|
| Rack Unit | Generally referred as U or RU, it is the unit of measurement for the server unit housed in the racks in the data center. 1U is equal to 1.75 inches. |
| Rack Density | It defines the amount of power consumed by the equipment and server housed in a rack. It is measured in kilowatt (kW). This factor plays a critical role in data center design and, cooling and power planning. |
| IT Load Capacity | The IT load capacity or installed capacity, refers to the amount of energy consumed by servers and network equipment placed in a rack installed. It is measured in megawatt (MW). |
| Absorption Rate | It denotes how much of the data center capacity has been leased out. For instance, if a 100 MW DC has leased out 75 MW, then the absorption rate would be 75%. It is also referred to as utilization rate and leased-out capacity. |
| Raised Floor Space | It is an elevated space built over the floor. This gap between the original floor and the elevated floor is used to accommodate wiring, cooling, and other data center equipment. This arrangement assists in having proper wiring and cooling infrastructure. It is measured in square feet/meter. |
| Computer Room Air Conditioner (CRAC) | It is a device used to monitor and maintain the temperature, air circulation, and humidity inside the server room in the data center. |
| Aisle | It is the open space between the rows of racks. This open space is critical for maintaining the optimal temperature (20-25 °C) in the server room. There are primarily two aisles inside the server room, a hot aisle and a cold aisle. |
| Cold Aisle | It is the aisle wherein the front of the rack faces the aisle. Here, chilled air is directed into the aisle so that it can enter the front of the racks and maintain the temperature. |
| Hot Aisle | It is the aisle where the back of the racks faces the aisle. Here, the heat dissipated from the equipment’s in the rack is directed to the outlet vent of the CRAC. |
| Critical Load | It includes the servers and other computer equipment whose uptime is critical for data center operation. |
| Power Usage Effectiveness (PUE) | It is a metric which defines the efficiency of a data center. It is calculated by: (𝑇𝑜𝑡𝑎𝑙 𝐷𝑎𝑡𝑎 𝐶𝑒𝑛𝑡𝑒𝑟 𝐸𝑛𝑒𝑟𝑔𝑦 𝐶𝑜𝑛𝑠𝑢𝑚𝑝𝑡𝑖𝑜𝑛)/(𝑇𝑜𝑡𝑎𝑙 𝐼𝑇 𝐸𝑞𝑢𝑖𝑝𝑚𝑒𝑛𝑡 𝐸𝑛𝑒𝑟𝑔𝑦 𝐶𝑜𝑛𝑠𝑢𝑚𝑝𝑡𝑖𝑜𝑛). Further, a data center with a PUE of 1.2-1.5 is considered highly efficient, whereas, a data center with a PUE >2 is considered highly inefficient. |
| Redundancy | It is defined as a system design wherein additional component (UPS, generators, CRAC) is added so that in case of power outage, equipment failure, the IT equipment should not be affected. |
| Uninterruptible Power Supply (UPS) | It is a device that is connected in series with the utility power supply, storing energy in batteries such that the supply from UPS is continuous to IT equipment even during utility power is snapped. The UPS primarily supports the IT equipment only. |
| Generators | Just like UPS, generators are placed in the data center to ensure an uninterrupted power supply, avoiding downtime. Data center facilities have diesel generators and commonly, 48-hour diesel is stored in the facility to prevent disruption. |
| N | It denotes the tools and equipment required for a data center to function at full load. Only "N" indicates that there is no backup to the equipment in the event of any failure. |
| N+1 | Referred to as 'Need plus one', it denotes the additional equipment setup available to avoid downtime in case of failure. A data center is considered N+1 when there is one additional unit for every 4 components. For instance, if a data center has 4 UPS systems, then for to achieve N+1, an additional UPS system would be required. |
| 2N | It refers to fully redundant design wherein two independent power distribution system is deployed. Therefore, in the event of a complete failure of one distribution system, the other system will still supply power to the data center. |
| In-Row Cooling | It is the cooling design system installed between racks in a row where it draws warm air from the hot aisle and supplies cool air to the cold aisle, thereby maintaining the temperature. |
| Tier 1 | Tier classification determines the preparedness of a data center facility to sustain data center operation. A data center is classified as Tier 1 data center when it has a non-redundant (N) power component (UPS, generators), cooling components, and power distribution system (from utility power grids). The Tier 1 data center has an uptime of 99.67% and an annual downtime of <28.8 hours. |
| Tier 2 | A data center is classified as Tier 2 data center when it has a redundant power and cooling components (N+1) and a single non-redundant distribution system. Redundant components include extra generators, UPS, chillers, heat rejection equipment, and fuel tanks. The Tier 2 data center has an uptime of 99.74% and an annual downtime of <22 hours. |
| Tier 3 | A data center having redundant power and cooling components and multiple power distribution systems is referred to as a Tier 3 data center. The facility is resistant to planned (facility maintenance) and unplanned (power outage, cooling failure) disruption. The Tier 3 data center has an uptime of 99.98% and an annual downtime of <1.6 hours. |
| Tier 4 | It is the most tolerant type of data center. A Tier 4 data center has multiple, independent redundant power and cooling components and multiple power distribution paths. All IT equipment are dual powered, making them fault tolerant in case of any disruption, thereby ensuring interrupted operation. The Tier 4 data center has an uptime of 99.74% and an annual downtime of <26.3 minutes. |
| Small Data Center | Data center that has floor space area of ≤ 5,000 Sq. ft or the number of racks that can be installed is ≤ 200 is classified as a small data center. |
| Medium Data Center | Data center which has floor space area between 5,001-20,000 Sq. ft, or the number of racks that can be installed is between 201-800, is classified as a medium data center. |
| Large Data Center | Data center which has floor space area between 20,001-75,000 Sq. ft, or the number of racks that can be installed is between 801-3,000, is classified as a large data center. |
| Massive Data Center | Data center which has floor space area between 75,001-225,000 Sq. ft, or the number of racks that can be installed is between 3001-9,000, is classified as a massive data center. |
| Mega Data Center | Data center that has a floor space area of ≥ 225,001 Sq. ft or the number of racks that can be installed is ≥ 9001 is classified as a mega data center. |
| Retail Colocation | It refers to those customers who have a capacity requirement of 250 kW or less. These services are majorly opted by small and medium enterprises (SMEs). |
| Wholesale Colocation | It refers to those customers who have a capacity requirement between 250 kW to 4 MW. These services are majorly opted by medium to large enterprises. |
| Hyperscale Colocation | It refers to those customers who have a capacity requirement greater than 4 MW. The hyperscale demand primarily originates from large-scale cloud players, IT companies, BFSI, and OTT players (like Netflix, Hulu, and HBO+). |
| Mobile Data Speed | It is the mobile internet speed a user experiences via their smartphones. This speed is primarily dependent on the carrier technology being used in the smartphone. The carrier technologies available in the market are 2G, 3G, 4G, and 5G, where 2G provides the slowest speed while 5G is the fastest. |
| Fiber Connectivity Network | It is a network of optical fiber cables deployed across the country, connecting rural and urban regions with high-speed internet connection. It is measured in kilometer (km). |
| Data Traffic per Smartphone | It is a measure of average data consumption by a smartphone user in a month. It is measured in gigabyte (GB). |
| Broadband Data Speed | It is the internet speed that is supplied over the fixed cable connection. Commonly, copper cable and optic fiber cable are used in both residential and commercial use. Here, optic cable fiber provides faster internet speed than copper cable. |
| Submarine Cable | A submarine cable is a fiber optic cable laid down at two or more landing points. Through this cable, communication and internet connectivity between countries across the globe is established. These cables can transmit 100-200 terabits per second (Tbps) from one point to another. |
| Carbon Footprint | It is the measure of carbon dioxide generated during the regular operation of a data center. Since, coal, and oil & gas are the primary source of power generation, consumption of this power contributes to carbon emissions. Data center operators are incorporating renewable energy sources to curb the carbon footprint emerging in their facilities. |


Research Methodology
Mordor Intelligence follows a four-step methodology in all our reports.
- Step-1: Identify Key Variables: In order to build a robust forecasting methodology, the variables and factors identified in Step-1 are tested against available historical market numbers. Through an iterative process, the variables required for market forecast are set and the model is built on the basis of these variables.
- Step-2: Build a Market Model: Market-size estimations for the forecast years are in nominal terms. Inflation is not a part of the pricing, and the average selling price (ASP) is kept constant throughout the forecast period for each country.
- Step-3: Validate and Finalize: In this important step, all market numbers, variables and analyst calls are validated through an extensive network of primary research experts from the market studied. The respondents are selected across levels and functions to generate a holistic picture of the market studied.
- Step-4: Research Outputs: Syndicated Reports, Custom Consulting Assignments, Databases & Subscription Platforms


