
Kids Activity Centers Market Size and Share
Market Overview
| Study Period | 2022 - 2032 |
|---|---|
| Market Size (2027) | USD 37.38 Billion |
| Market Size (2032) | USD 48.16 Billion |
| Growth Rate (2027 - 2032) | 5.20 % |
| Fastest Growing Market | Middle East and Africa |
| Largest Market | Asia-Pacific |
| Market Concentration | Low |
Major Players *Disclaimer: Major Players sorted in no particular order Image © Mordor Intelligence. Reuse requires attribution under CC BY 4.0. | |
Kids Activity Centers Market Analysis by Mordor Intelligence
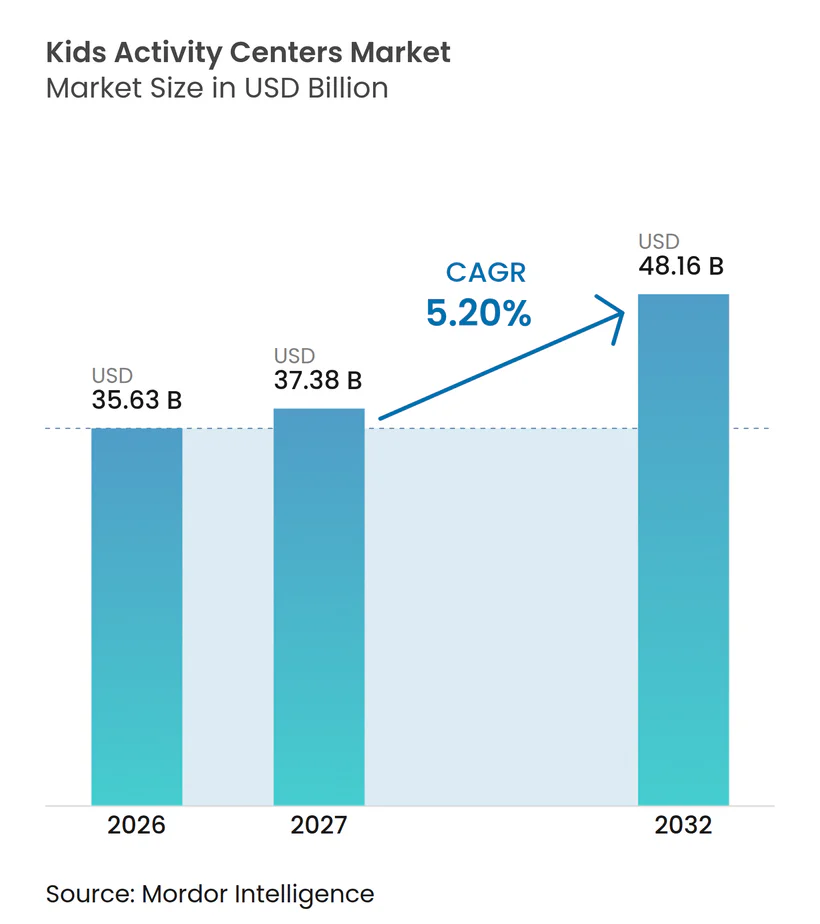
The global kids activity centers market size was valued at USD 35.63 billion in 2026 and is estimated to grow from USD 37.38 billion in 2027 to reach USD 48.16 billion by 2032, at a CAGR of 5.20% during the forecast period (2027–2032). The kids activity centers market is supported by household spending that increasingly favors shared out-of-home activities over discretionary goods. Organized play venues also provide a supervised setting for physical activity where dense urban areas offer limited safe outdoor space. Asia-Pacific accounted for 50.9% of global revenue in 2026, supported by large school-age populations and the use of entertainment venues as footfall anchors in malls. Physical and adventure formats remain central because they combine movement with social play, while technology-enabled formats help operators retain older visitors. The kids' activity centers market therefore rewards operators that can combine safety, repeat-visit programs, varied attractions, and local real estate partnerships.
Key Report Takeaways
By activity type, physical and adventure activities held 43.8% of revenue in 2026, while immersive and technology-enabled activities are projected to grow at a 5.5% CAGR through 2032.
By center format, mall-based centers held 32.7% of revenue in 2026, while adventure and trampoline centers are projected to grow at a 6.7% CAGR through 2032.
By visitor age group, children aged 6-9 years held 33.6% of revenue in 2026, while teenagers aged 13-17 years are projected to grow at a 5.6% CAGR through 2032.
By revenue source, entry fees and ticket sales held 55.4% of revenue in 2026, while advertising, sponsorships, and partnerships are projected to grow at a 5.4% CAGR through 2032.
By geography, Asia-Pacific held 50.9% of revenue in 2026, while the Middle East and Africa is projected to grow at an 8.4% CAGR through 2032.
Note: Market numbers in this report are based on Mordor Intelligence's proprietary estimation framework, which combines nine months of actuals with Q4 projections for base year 2026.
Market Trends and Insights
Drivers Impact Analysis of Kids Activity Centers Market*
| Driver | (~) % Impact on CAGR Forecast | Geographic Relevance | Impact Timeline |
|---|---|---|---|
| Experience-Led Family Leisure Spending | +1.5% | Global | Long term (≥ 4 years) |
| Urban Density and Limited Outdoor Play Space | +0.9% | Asia-Pacific core, spillover to MEA & South America | Long term (≥ 4 years) |
| Parent Demand for Active and Developmental Play | +0.8% | Global | Medium term (2-4 years) |
| Mall and Mixed-Use Retail Repurposing | +0.7% | North America & EU | Medium term (2-4 years) |
| Membership, Group-Booking, and Birthday-Party Programs | +0.6% | Global | Short term (≤ 2 years) |
| Localized Phygital Experiences and Social Play | +0.5% | Asia-Pacific, North America | Medium term (2-4 years) |
| Source: Mordor Intelligence | |||
Experience-Led Family Leisure Spending
The kids' activity centers market benefits when families protect spending on shared leisure occasions. IAAPA reported that admissions represented 40% of family entertainment center revenue, while attractions and rides represented 19%, food and beverage represented 16%, and birthday parties represented 14%. This revenue mix shows that a single visit can generate spending across several services rather than only at entry. CEC Entertainment stated that its Chuck E. Cheese network hosts more than 500,000 birthday parties each year, which keeps group celebrations important to venue utilization. Its USD 99.99 all-in birthday package also shows how transparent pricing can support family planning and reduce friction at booking. This model has relevance because malls and mixed-use destinations can pair children’s activities with dining and shopping for an extended family visit[1].
Urban Density and Limited Outdoor Play Space
The kids' activity centers market is gaining support from urban households that have less access to safe, nearby outdoor play areas. This need is especially visible in Indian metros, where high-density housing and traffic can limit independent play for children. Indoor venues can provide a supervised alternative for movement, social interaction, and family time. Their location within malls or accessible mixed-use properties can reduce travel and planning friction for parents. Operators can address this demand through layouts that serve family groups, school visits, and birthday celebrations in the same site. These conditions give the kids' activity centers market a practical role as a scheduled play destination instead of only a discretionary weekend outing.
Parent Demand for Active and Developmental Play
Parent demand is shifting toward formats that combine entertainment with visible physical and developmental value. The World Health Organization recommends at least 60 minutes of moderate-to-vigorous physical activity daily for children and adolescents aged 5-17 years. The organization also recommends that children under 5 years spend at least 180 minutes in varied physical activity spread throughout the day. These recommendations strengthen the rationale for climbing walls, soft-play structures, obstacle courses, and trampoline zones. CEC Entertainment planned to roll out Adventure Zones, combining trampolines and playground structures, to more than 250 North American Chuck E. Cheese locations during 2025. Merlin’s Peppa Pig Theme Park in Dallas-Fort Worth also received Autism Center certification through IBCCES, with quiet spaces, accessible paths, and sensory guidance that demonstrate the growing value of inclusive venue design[2].
Mall and Mixed-Use Retail Repurposing
Mall and mixed-use redevelopment is expanding the location options available to the kids' activity centers market. Former department store sites offer climate-controlled floor space, parking, and access to established shopping catchments. Urban Air stated that it had more than 200 locations by mid-2025 and regarded vacant retail space as an important opportunity for development. The company’s target of approximately 30 new locations a year illustrates the speed at which adaptable retail space can support network growth. This pattern is also relevant to developers seeking longer dwell times and repeat footfall at large malls. A well-designed activity center can support surrounding food, beverage, cinema, and retail tenants, which makes it more than a secondary amenity.
Restraints Impact Analysis of Kids Activity Centers Market*
| Restraint | (~) % Impact on CAGR Forecast | Geographic Relevance | Impact Timeline |
|---|---|---|---|
| High Real Estate, Staffing, and Attraction-Upgrade Costs | -1.2% | Global, most acute in North America & EU | Long term (≥ 4 years) |
| Competition from Home Digital Entertainment | -0.8% | North America, EU & developed Asia | Long term (≥ 4 years) |
| Insurance, Safety Compliance, and Liability Exposure | -0.5% | North America & EU | Medium term (2-4 years) |
| Import, Tariff, and Foreign-Exchange Pressure on Equipment | -0.4% | Global, most acute in Asia-Pacific & Americas | Short term (≤ 2 years) |
| Source: Mordor Intelligence | |||
High Real Estate, Staffing, and Attraction-Upgrade Costs
The kids' activity centers market faces a cost base that rises before attendance and ancillary spending are established. Operators need large sites, trained staff, safety systems, and regular attraction upgrades to preserve repeat demand. Dave & Buster’s reported USD 1,382.3 million in term loans and USD 170 million drawn under its revolving credit facility as of February 2026. The company identified wage inflation, minimum wage changes, commodity costs, and supply chain disruption as continuing risks. IAAPA placed typical family entertainment center profit margins between 10% and 20%, leaving limited room for several cost pressures to occur at the same time. In emerging markets, imported equipment and premium mall rents can make careful site selection, staged investment, and supplier management necessary from the start.
Competition from Home Digital Entertainment
Home gaming, streaming, and social platforms remain persistent substitutes for physical entertainment visits. This pressure is strongest among teenagers, who can select low-cost digital options without a family outing. Dave & Buster’s reported a 5% year-over-year decline in comparable store sales in fiscal 2025. Entertainment revenue fell from USD 1,391 million to USD 1,323.5 million, while food and beverage revenue rose from USD 741.7 million to USD 779.3 million. The result suggests that guests may continue to value social dining but can reduce spending on paid entertainment. Operators can respond by building group activities, seasonal events, and age-specific attractions that create a social experience not easily reproduced at home[3].
*Our forecasts treat driver/restraint impacts as directional, not additive. The impact forecasts reflect baseline growth, mix effects, and variable interactions.
Consumer Preferences & Spending Patterns
Parents increasingly assess activity centers through both developmental value and entertainment quality. WHO guidance on daily physical activity gives movement-based formats a clear health-related reference point. Urban households also value a supervised environment that reduces the coordination required for outdoor activities. Merlin’s Dallas-Fort Worth Peppa Pig Theme Park included quiet spaces, sensory guides, wheelchair-accessible pathways, and accessibility measures under its Autism Center certification. This design direction shows that inclusive environments can broaden the customer base while improving the quality of the visit. The kids' activity centers market is also responding to demand from older children through immersive and technology-enabled activities, which are forecast to grow at a 5.5% CAGR through 2032.
A visit to a family entertainment center can include spending on admission, attractions, food, birthday services, and merchandise. IAAPA reported a 40% revenue contribution from admissions, 19% from attractions and rides, 16% from food and beverage, and 14% from birthday parties. Dave & Buster’s food and beverage revenue increased from USD 741.7 million in fiscal 2024 to USD 779.3 million in fiscal 2025. Its total revenue fell 1.4% in the same period, showing that dining can be more resilient than games during softer entertainment demand. Operators that connect dining with play can therefore produce more opportunities for spending in a single visit. Membership users may spend less per visit, but their higher annual frequency can support customer lifetime value and more stable capacity utilization.
Market Performance Intelligence
Pricing is increasingly organized around memberships, day passes, group reservations, and all-inclusive party packages. CEC’s Fun Pass tiers ranged from USD 7.99 to USD 29.99 a month and included varying game allowances and discounts. Its USD 99.99 package for 6 children, plus USD 19.99 for each additional guest, illustrates the use of simple bundled pricing for celebrations. IAAPA’s revenue mix showed that birthday parties generated 14% of family entertainment center revenue. Average profit margins of 10% to 20% make predictable pre-booked volumes valuable for operators with fixed lease and labor costs. Pricing can be adapted through weekday school programs, off-peak passes, and birthday bundles rather than relying solely on weekend walk-ins.
Digital channels are becoming more relevant to ticket discovery, booking, and repeat engagement. IAAPA reported that operator websites accounted for 23% of total ticket sales in its 2025 entertainment center benchmark. The same source showed that 32% of passholders visited 10 or more times per year, compared with 11% of non-passholders. These figures favor retention programs that use membership benefits, personalized offers, and school partnerships. IAAPA also reported that some North American operators faced guest resistance to midseason price changes during 2025. The kids activity centers market can use first-party digital data to improve offers, but the underlying experience must still justify another visit.
Kids Activity Centers Market Segment Analysis
By Activity Type:
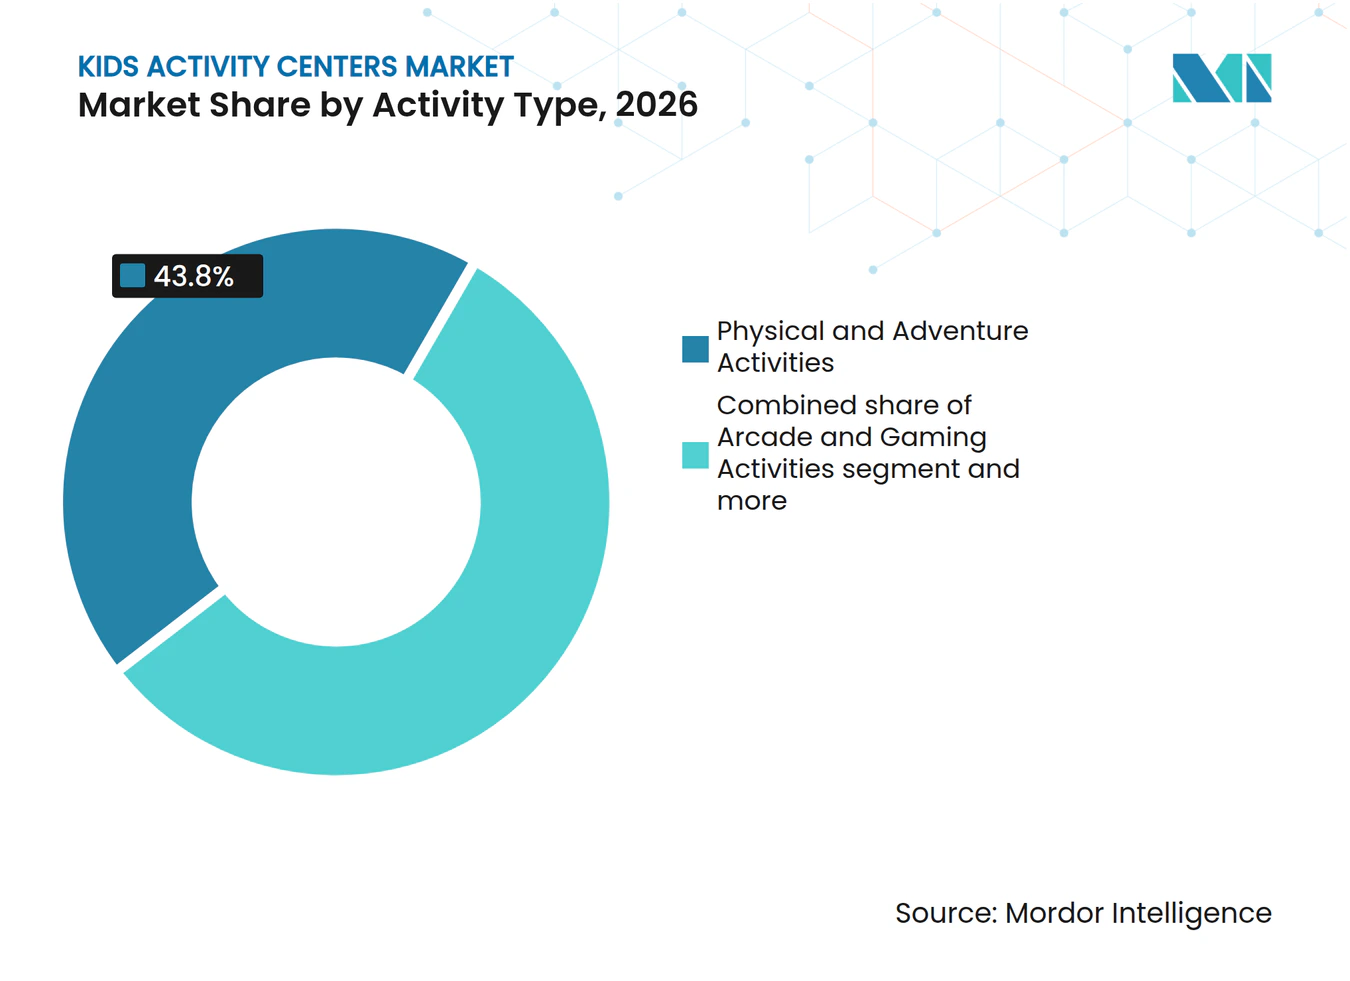
Physical Play Leads, Immersive Tech AcceleratesPhysical and adventure activities held 43.8% of kids activity centers market share in 2026. This segment includes climbing walls, trampoline arenas, obstacle courses, and soft-play structures. Its position reflects parental preference for formats that make physical movement visible and socially engaging. WHO guidance supports the importance of regular active play for children and adolescents. These formats can also serve a wide age range when operators vary difficulty levels and supervision. The kids activity centers market size for physical play is supported by venues that combine movement with a controlled indoor environment.
Immersive and technology-enabled activities are forecast to expand at a 5.5% CAGR through 2032. Operators use virtual reality, augmented reality, projection, and sensor-based games to keep older visitors engaged. LEGOLAND Shanghai opened in 2025 with more than 75 interactive rides and attractions, demonstrating the ability of established intellectual property to combine storytelling with technology. Arcade and gaming areas remain commercially important because IAAPA found that they occupy more than one-third of front-of-house floor space at surveyed centers. Educational and edutainment activities can add weekday demand through school programs and curriculum-linked visits. Sensory play and creative activities remain relevant for operators seeking more inclusive programming.



By Center Format:
Malls Anchor Volume, Trampoline Parks Drive GrowthMall-based centers held 32.7% of segment revenue in 2026. Their position benefits from planned shopping trips, existing parking, climate control, and nearby food options. Mall landlords can use children’s entertainment to improve dwell time and help nearby tenants capture family spending. Majid Al Futtaim’s AED 5 billion transformation of Mall of the Emirates includes 4 new entertainment concepts, showing how mall owners are investing in leisure-led redevelopment. Standalone centers can offer deeper programming, but they must generate traffic without the benefit of a retail catchment. Edutainment centers address a narrower need through organized school and learning-related programs.
Adventure and trampoline centers are forecast to grow at a 6.7% CAGR from 2027 to 2032. Their format is attractive because it can address a broad age range with movement-led activities and a more focused footprint than a large family entertainment center. Altitude Trampoline Park reported 3 new park openings in the first quarter of 2025 and additional openings later in the year. Franchise development can help these concepts expand without placing the full capital requirement on a single operator. Urban Air also used vacant retail sites to enlarge its network beyond 200 locations. In emerging markets, the expansion of trampoline parks reflects demand for indoor activity venues in dense urban catchments.
By Visitor Age Group:
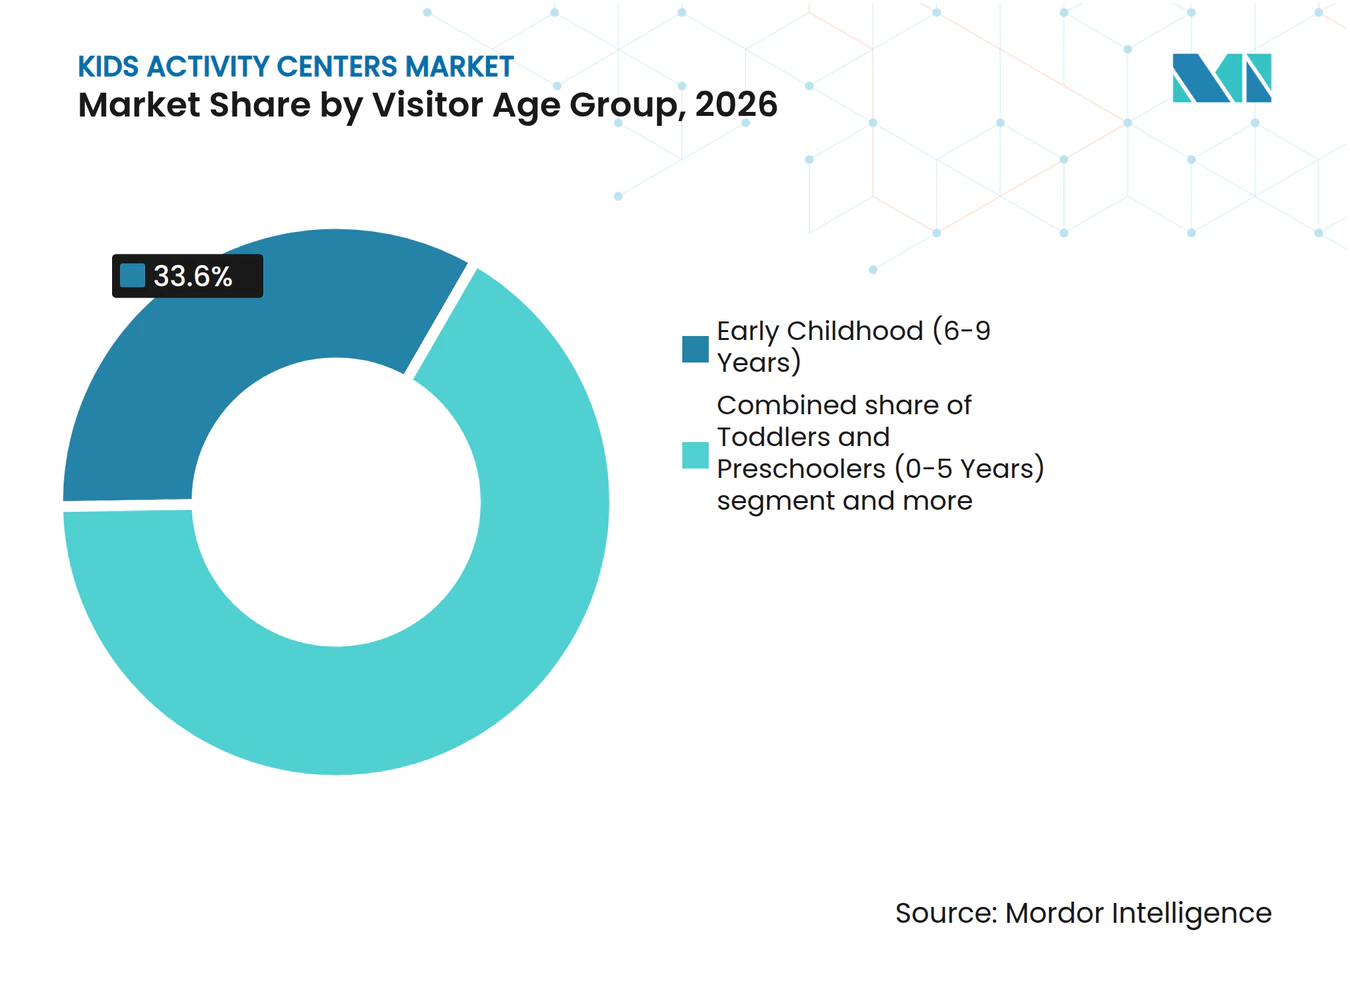
Early Childhood Anchors Revenue, Teens Are the Growth FrontierChildren aged 6-9 years accounted for 33.6% of segment revenue in 2026. This group fits the core offer of soft play, low-obstacle courses, trampolines, school holiday activities, and birthday parties. Parents still make most leisure decisions for this age group, which supports organized family outings and bookings. The cohort can create predictable seasonal demand during holidays and weekends. Activity centers that separate younger children from higher-intensity areas can improve parent confidence and safety. The operating model must remain flexible because families often attend with siblings from several age groups.
Teenagers aged 13-17 years are projected to grow at a 5.6% CAGR through 2032. Teen visitors require social relevance because they have greater control over their leisure choices than younger children. Esports bays, virtual reality, laser tag, competitive games, and social spaces can help retain this group. The segment also faces the strongest competition from gaming, streaming, and social platforms at home. Teen-focused programming must be distinct enough to encourage group participation without compromising the safety needs of younger visitors. Operators that fail to refresh their offer risk losing this group to other out-of-home entertainment formats.

By Revenue Source:
Entry Fees Dominate, Sponsorships Signal a New ModelEntry fees and ticket sales accounted for 55.4% of revenue in 2026. This shows that paid access remains the foundation of the kids' activity centers industry. Ticket revenue is also highly exposed to pricing sensitivity when household budgets become tighter. Dave & Buster’s entertainment revenue declined in fiscal 2025, illustrating the sensitivity of paid entertainment spending. Bundled packages and memberships can partly reduce this exposure by giving customers clearer value and repeat-visit reasons. Food, merchandise, and redemption can then raise spending beyond the initial ticket.
Advertising, sponsorships, and partnerships are forecast to expand at a 5.4% CAGR through 2032. This source can grow when operators can demonstrate family footfall, relevant visitor profiles, and measurable campaign outcomes. Consumer brands, children’s media properties, and education-focused businesses have reasons to seek visibility in supervised family settings. IAAPA’s benchmark shows the importance of diverse revenue streams, with food and beverage contributing 16% and birthday parties contributing 14% of revenue. CEC’s membership discounts on food and extra games illustrate how operators can link one spending line to another. Operators with strong brand partnerships and audience data may gain an advantage over venues that depend solely on admission.
Geography Analysis
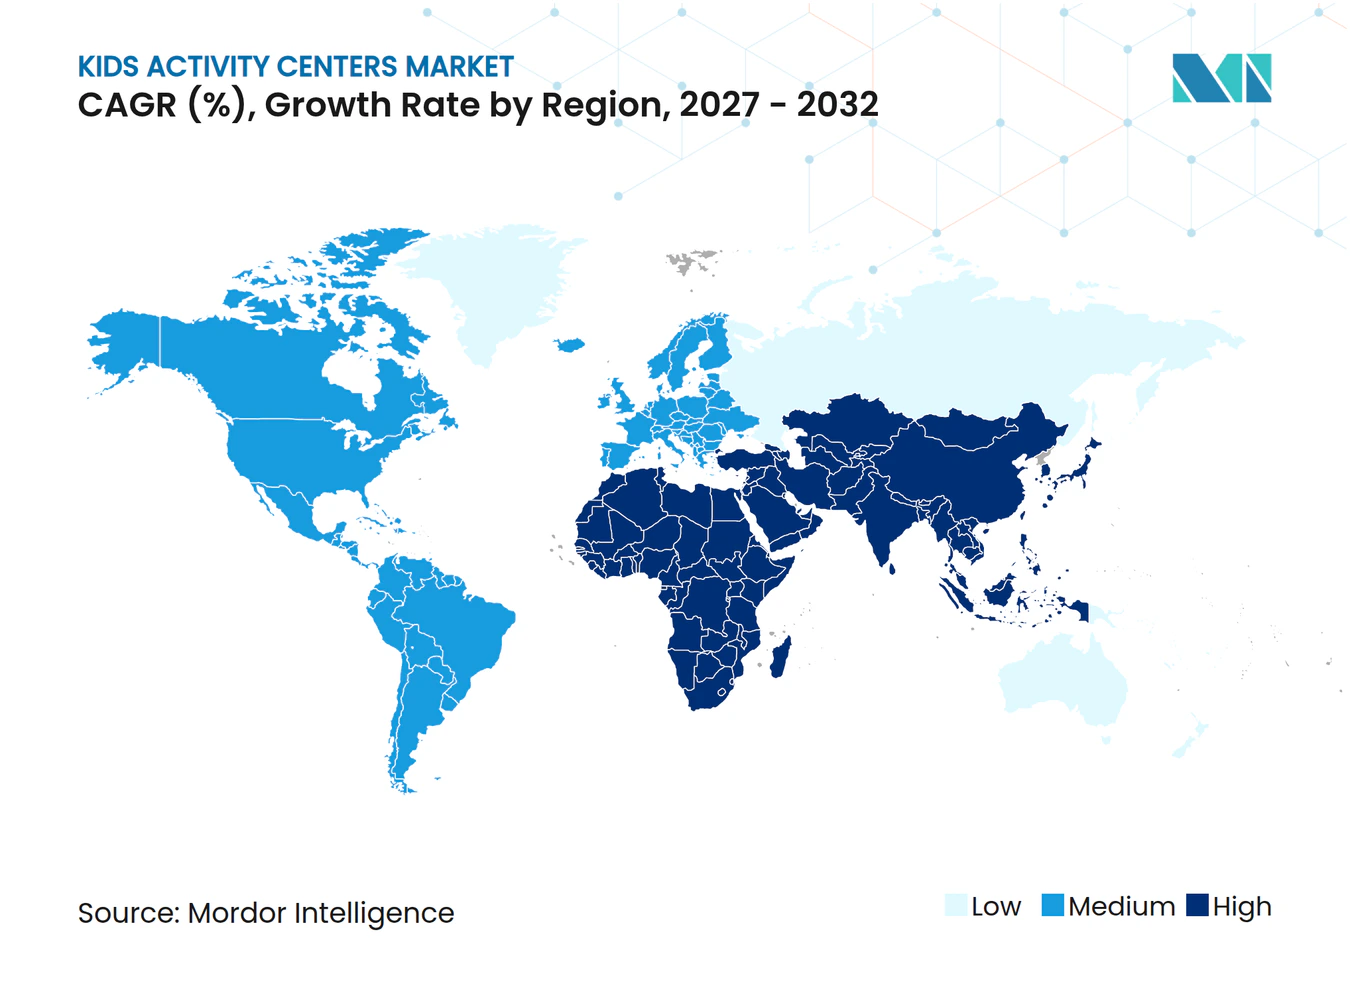
Asia-Pacific held 50.9% of kids activity centers market share in 2026. The regional position reflects large child populations, rapid urbanization, and the use of malls as family leisure destinations. In India, dense housing patterns and limited open space support the need for supervised indoor play. SkyJumper had 10 additional parks in its development pipeline by the end of 2025, indicating an active supply response. IAAPA reported that indoor facilities in India outperformed outdoor counterparts, while the source material cited India’s 7.8% GDP growth in the most recently measured quarter. China is also attracting large projects, including LEGOLAND Shanghai, which opened in July 2025 across 318,000 square meters and 8 themed lands.
The Middle East and Africa region is forecasted to expand at an 8.4% CAGR from 2027 to 2032. Young populations, high mall density, urbanization, and tourism investment support the regional opportunity. Majid Al Futtaim operates 32 Magic Planet locations across 9 countries, providing a broad regional network for family entertainment. Its Mall of the Emirates transformation includes 4 new entertainment concepts, which signals further investment in family and youth-oriented leisure. CEC Entertainment also announced a Turkey expansion plan in 2025, with up to 3 Istanbul locations planned by the end of 2026 and a long-term aim of 20 sites nationally.
Europe and other emerging markets are expected to grow significantly over the forecast period. Attendance was reported as flat in Scandinavian markets, but in-park spending was above 2024 levels. CEC Entertainment’s United Kingdom announcement in September 2025 introduced a franchise-led brand into a region with many local and independent operators. These mature markets show that expansion depends on site conversion, selective investment, and a stronger revenue mix rather than only new customer acquisition.
Service Provider Network & Expansion Intelligence
The global kids activity centers market includes multinational chains, regional franchise systems, and independent single-site operators. CEC Entertainment operated nearly 600 Chuck E. Cheese locations across 45 US states and 17 foreign countries and territories and welcomed more than 25 million guests annually. Dave & Buster’s maintained 243 venues as of February 2026, including 179 Dave & Buster’s locations and 64 Main Event locations. Its international franchise presence included locations in Bengaluru, Mumbai, Manila, and Santo Domingo, with 37 franchise locations in development. Majid Al Futtaim operated 32 Magic Planet locations across markets including the UAE, Oman, Bahrain, Kuwait, Jordan, Lebanon, Egypt, and Kenya. IAAPA also reported that redemption and non-redemption arcades occupied more than one-third of front-of-house floor space at surveyed family entertainment centers, underlining the importance of gaming to the service mix.
The pace of launches in 2025 showed that major operators continued to invest despite cost and demand risks. Merlin opened LEGOLAND Shanghai Resort on July 5, 2025, as China’s first LEGOLAND and the largest in its network. Merlin also opened a Peppa Pig Theme Park in Dallas-Fort Worth in March 2025 and a LEGO Discovery Center in Hamburg in June 2025. CEC Entertainment announced entry into the United Kingdom in September 2025 and Turkey in October 2025 through franchise arrangements. Altitude Trampoline Park reported 3 openings in the first quarter of 2025 and further openings in North Carolina and the San Francisco Bay Area later that year. These openings showed that operators were using a mix of owned concepts, licensing, and franchising to reach new geographies and formats[4].
Competitive Landscape
Market Concentration
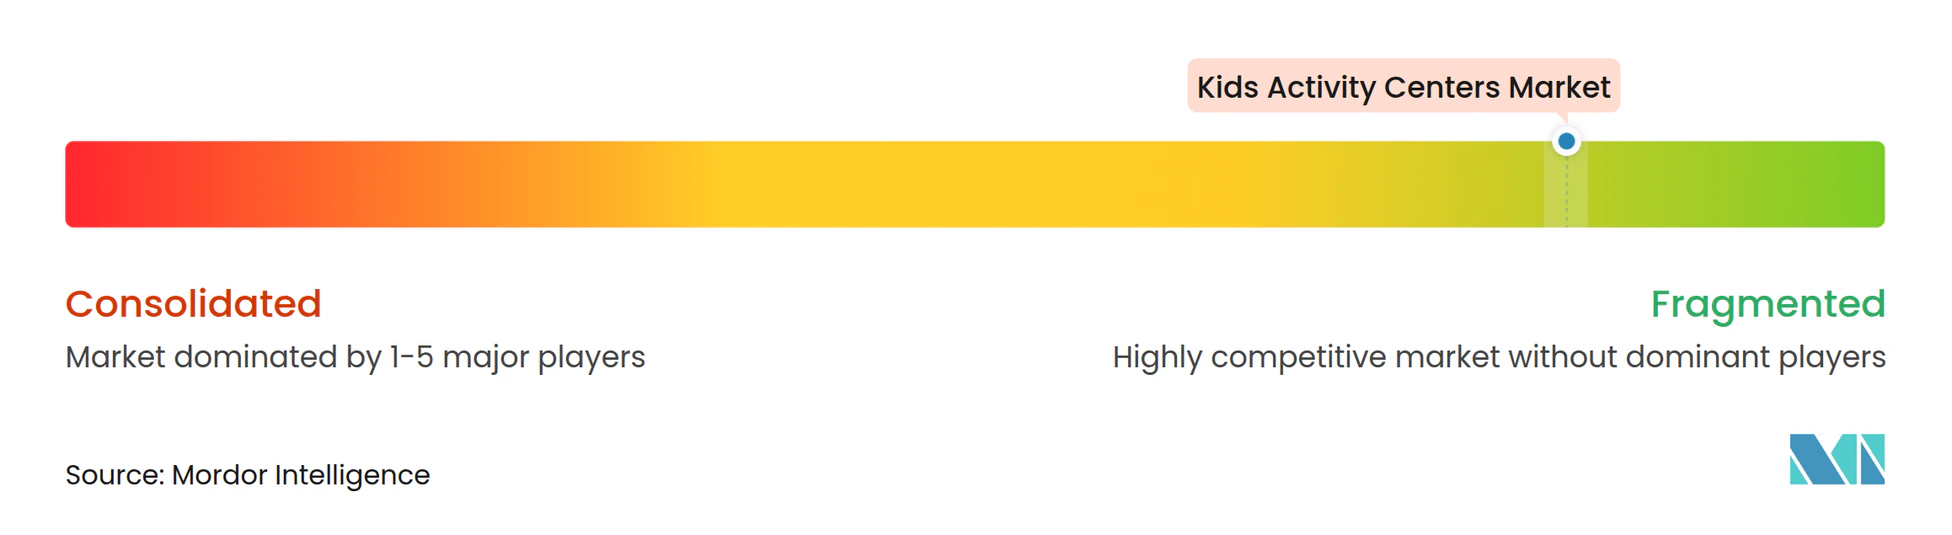
The kids activity centers market has a fragmented competitive structure. CEC Entertainment, Dave & Buster’s Entertainment, Merlin Entertainments, AEON Fantasy, and Kidz Holding are among the recognizable operators, but independent and regional businesses account for many venues. This structure limits the ability of any single company to set prices across markets. It also creates openings for well-capitalized franchise brands in cities with limited organized supply. CEC Entertainment uses a multi-format approach that includes traditional Chuck E. Cheese venues, Adventure Zones, and Chuck’s Arcade concepts. Its 2025 United Kingdom and Turkey announcements show how franchise agreements can support international reach without relying only on company-owned sites.
Merlin Entertainments relies on recognizable intellectual property through LEGOLAND, Peppa Pig, and LEGO Discovery Center formats. LEGOLAND Shanghai opened in July 2025 as the company’s largest LEGOLAND property and represented a major investment in China. Merlin also opened the Peppa Pig Theme Park in Dallas-Fort Worth in March 2025 with an Autism Center certification and inclusive design features. These moves show how licensed brands, immersive design, and accessibility can work together to differentiate a family entertainment offer. AEON Fantasy benefits from its parent group’s mall and retail presence in Asia, while Majid Al Futtaim benefits from a dense regional shopping center network. For Indian operators, the comparison highlights the value of trusted brands, local mall relationships, and a clear customer proposition rather than unstructured expansion.
Kids Activity Centers Industry Leaders
-
CEC Entertainment, LLC
-
Dave & Buster's Entertainment, Inc.
-
Merlin Entertainments Limited
-
AEON Fantasy Co., Ltd.
-
Kidz Holding S.A.L.
- *Disclaimer: Major Players sorted in no particular order
Kids Activity Centers Market Companies Covered in this Report
- Dave & Buster's Entertainment, Inc.
- CEC Entertainment, LLC
- Merlin Entertainments Limited
- Kidz Holding S.A.L.
- AEON Fantasy Co., Ltd.
- Round One Entertainment, Inc.
- Urban Air Adventure Park
- Altitude Trampoline Park
- Scene75 Entertainment Centers
- Lucky Strike Entertainment Corporation
- The Entertainment and Education Group (TEEG)
- NEOBIO
- Leo's Group
- Andretti Indoor Karting & Games
- Cinergy Entertainment Group
- The Little Gym International, Inc.
- Bandai Namco Holdings Inc.
- Majid Al Futtaim Holding LLC
- Funky Monkeys Play Centers Private Limited
- Great Wolf Resorts, Inc.
Recent Industry Developments in Kids Activity Centers Market
- October 2025: CEC Entertainment announced the entry of Chuck E. Cheese into Turkey, partnering with PNB Restoran and Unique Hospitality Company to open up to 3 Istanbul locations by the end of 2026, with a goal of 20 locations nationally before 2030.
- September 2025: Chuck E. Cheese confirmed its entry into the United Kingdom through a multi-unit franchise agreement, marking the brand’s first European presence in its nearly 50-year history.
- July 2025: Merlin Entertainments opened LEGOLAND Shanghai Resort on July 5, China’s first LEGOLAND and the largest in the global network at 318,000 square meters, featuring 8 themed lands, 75+ interactive rides, and more than 85 million LEGO bricks.
- March 2025: Merlin Entertainments opened the Peppa Pig Theme Park in Dallas-Fort Worth, Texas, the brand’s second US Peppa Pig park. The facility was certified as an Autism Center through IBCCES, incorporating sensory-friendly design elements including quiet spaces, wheelchair-accessible rides, and detailed Sensory Guides.
Key Questions Answered in the Report
What is the projected value of the kids activity centers market by 2032?
The kids activity centers market is projected to reach USD 48.16 billion by 2032, growing at a 5.20% CAGR from 2027.
Which activity type leads children’s activity centers?
Physical and adventure activities led with 43.8% of revenue in 2026, supported by demand for movement-based and social play.
Why are trampoline and adventure centers growing quickly?
Adventure and trampoline centers are projected to grow at a 6.7% CAGR through 2032 because they offer active play across a broad age range.
What is driving India’s indoor activity center demand?
Dense urban living, limited outdoor play space, mall development, and rising demand for supervised active play are supporting demand in India.
Which age group offers the strongest growth opportunity?
Teenagers aged 13-17 years are projected to grow at a 5.6% CAGR through 2032, supporting investment in immersive and social activities.
How can operators increase repeat visits?
Memberships, birthday packages, school programs, and refreshed attractions can support repeat attendance and reduce dependence on walk-in demand.