Market Overview
| Study Period | 2020 - 2031 |
|---|---|
| Forecast Data Period | 2026 - 2031 |
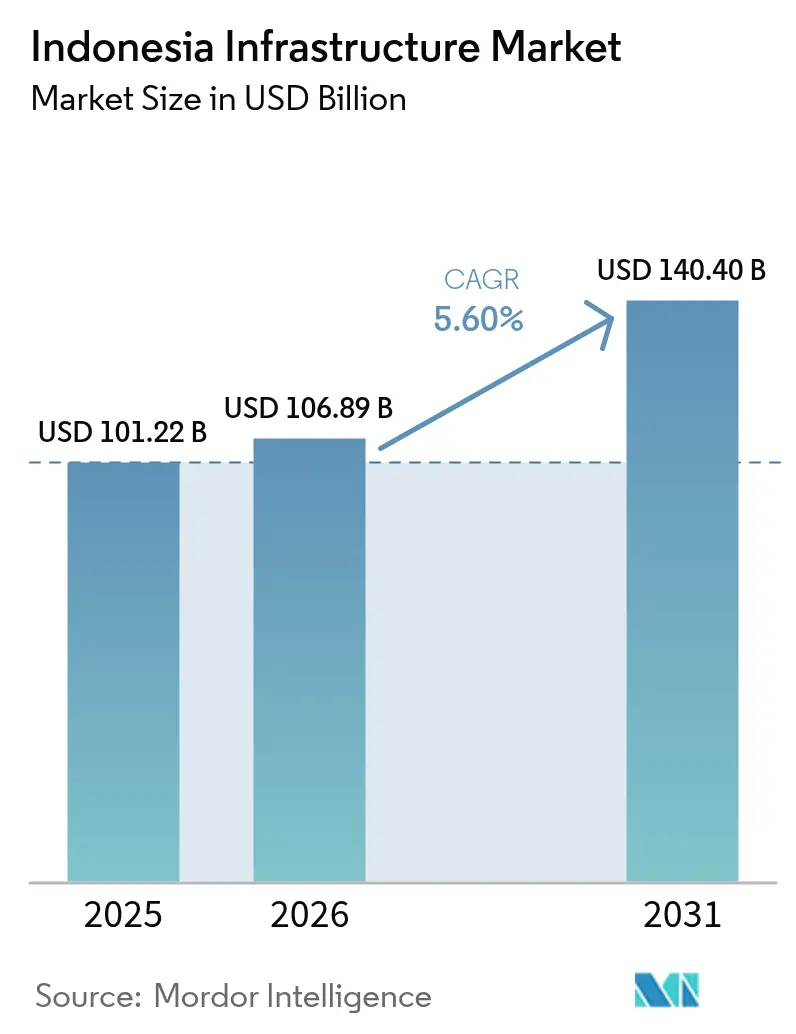
| Base Year Market Size (2025) | USD 101.22 Billion |
| Market Size (2026) | USD 106.89 Billion |
| Market Size (2031) | USD 140.4 Billion |
| Growth Rate (2026 - 2031) | 5.60% CAGR |
| Market Concentration | Low |
Major Players *Disclaimer: Major Players sorted in no particular order Image © Mordor Intelligence. Reuse requires attribution under CC BY 4.0. | |
Indonesia Infrastructure Market Analysis by Mordor Intelligence
The Indonesia infrastructure market size is expected to grow from USD 101.22 billion in 2025 to USD 106.89 billion in 2026 and is forecast to reach USD 140.4 billion by 2031 at 5.6% CAGR over 2026-2031. Robust population growth, rapid urbanization, and the National Medium-Term Development Plan (RPJMN 2025-2029) combine to keep project pipelines full, even as the state trims discretionary budgets to protect fiscal targets. Fresh equity from the Indonesia Investment Authority (INA), worth USD 10.3 billion in managed assets, signals deeper private participation, while new green-bond channels make renewable and climate-resilient projects bankable. Transportation remains the single-largest contributor to civil-works value because toll-road build-outs directly cut logistics costs that are still above regional peers. Digital-economy ambitions add an emerging layer: hyperscale data-center construction and fiber-optic corridors now account for a growing share of EPC contracts, creating a diversified demand profile[1]Kementerian Pekerjaan Umum dan Perumahan Rakyat, “Rencana Kerja 2025,” pupr.go.id.
Key Report Takeaways
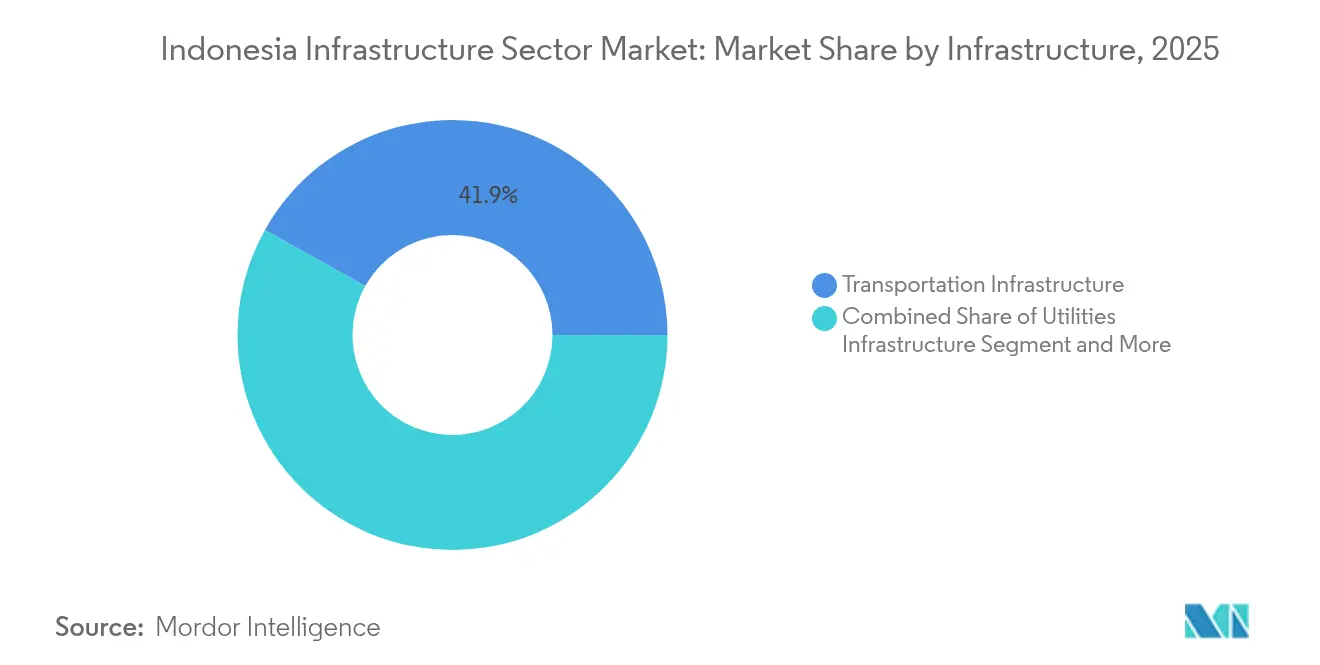
- By infrastructure type, transportation led with 41.87% Indonesia infrastructure market share in 2025, transportation is projected to post the fastest 6.88% CAGR through 2031.
- By construction type, new builds held 77.35% share of the Indonesia infrastructure market size in 2025, renovation is advancing at a 6.62% CAGR to 2031.
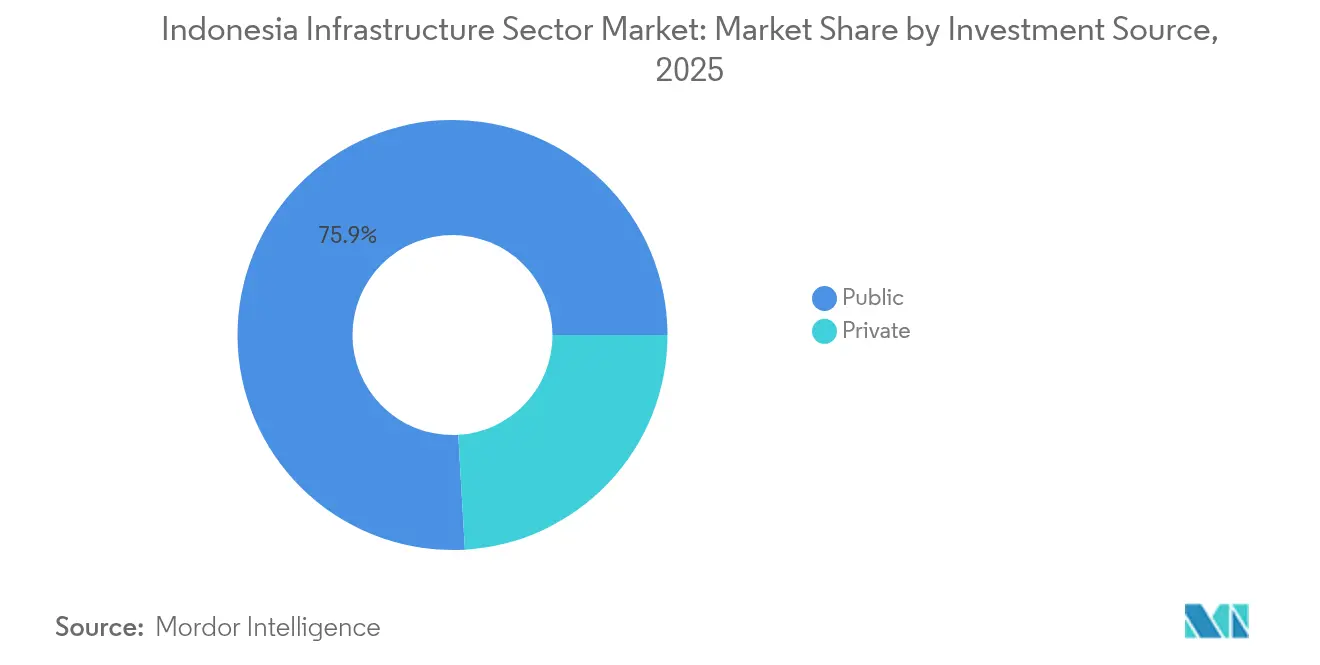
- By investment source, the public sector commanded 75.92% of spending in 2025, while private capital is set to expand at 7.45% CAGR through 2031.
- By geography, Java held 57.96% share of the Indonesia infrastructure market size in 2025, Kalimantan is advancing at a 6.42% CAGR to 2031.
Note: Market size and forecast figures in this report are generated using Mordor Intelligence’s proprietary estimation framework, updated with the latest available data and insights as of 2026.
Indonesia Infrastructure Market Trends and Insights
Drivers Impact Analysis*
| Driver | (~) % Impact on CAGR Forecast | Geographic Relevance | Impact Timeline |
|---|---|---|---|
| National Medium-Term Development Plan (RPJMN 2025-2029) | +1.2% | National; most funds flow to Java, Kalimantan | Long term (≥ 4 years) |
| Relocation of the new capital (Nusantara) | +1.1% | Kalimantan focus with regional spill-overs | Long term (≥ 4 years) |
| Sovereign wealth fund (INA) catalyzing PPP pipelines | +0.9% | Nationwide; early allocations in Java & Sumatra | Medium term (2-4 years) |
| Growing urbanization and middle-class expansion | +0.8% | Java core; spill-over to Sumatra, Sulawesi | Medium term (2-4 years) |
| Surge in data-center and fiber backbone build-outs | +0.6% | Java and Batam hubs; tier-two cities next | Short term (≤ 2 years) |
| Green-bond financed renewable and climate-resilient assets | +0.4% | Geothermal-rich regions; coastal zones | Long term (≥ 4 years) |
| Source: Mordor Intelligence | |||
National Medium-Term Development Plan (RPJMN 2025-2029)
The RPJMN commits USD 25.8 billion in 2025 for roads, mass transit, and energy transition assets, making infrastructure the policy centerpiece for escaping the middle-income trap. A pipeline of 210 strategic projects already enjoys presidential regulation backing, which reduces approval risk and standardizes PPP templates across ministries. Execution credibility is high because 153 legacy projects worth USD 67.1 billion reached completion between 2016-2023, demonstrating a functioning delivery apparatus. The plan explicitly targets logistics-cost reduction below 10% of GDP, a metric closely watched by manufacturing investors. By embedding climate resilience and digital connectivity targets, RPJMN provides visibility that encourages multidecade private capital commitments.
Relocation of the New Capital (Nusantara)
The USD 29 billion first-phase build of Nusantara turns Kalimantan into the largest construction site in Southeast Asia, sparking ancillary demand in ports, airports, and water systems. More than 61.7% of state-funded packages were physically complete by December 2024, a key confidence signal for institutional investors eyeing later-stage parcels. Design parameters call for carbon neutrality by 2045 and fully digital public services, positioning the city as a demonstration hub for smart, sustainable infrastructure. Foreign pledges reached USD 97 million by late 2024, with Russian, Chinese, and Australian participants, and are expected to accelerate once core civil works de-risk remaining phases. Spill-over effects already include road upgrades linking mineral-rich South Sulawesi to new logistics channels, underscoring the project’s national multiplier.
Sovereign Wealth Fund (INA) Catalyzing PPP Pipelines
INA grew from a USD 5 billion seed vehicle in 2021 to USD 10.3 billion in assets by 2024, proving institutional depths that global investors require before committing to greenfield risk. Its USD 2.7 billion toll-road platform attracted capital from APG and Abu Dhabi Investment Authority, mitigating currency and regulatory risks for pension funds that had previously stayed away. INA’s co-investment model now extends to a USD 1.2 billion technology-infrastructure program with Granite Asia that targets edge data centers and smart-city utilities. By standardizing due-diligence templates and offering minority equity structures, INA shortens deal timelines and lowers financing costs. The result is a robust PPP deal flow that plugs fiscal gaps without diluting sovereign oversight.
Growing Urbanization and Middle-Class Expansion
Urbanization hit 57.3% in 2024 and metropolitan areas generated 60% of national GDP, stretching transport, water, and social infrastructure beyond design capacity. Middle-income households, projected to total 141 million by 2030, demand higher-quality amenities such as mass rapid transit and smart-grid electrification. Greater Jakarta’s 34 million residents already drive daily mobility requirements that underpinned the launch of LRT Jabodebek and expansion of MRT Jakarta Phase 2. Passenger-car ownership growth sustains toll-road traffic, evidenced by the network’s expansion to 2,816 km after adding 217.8 km in 2023. Rising urban tax receipts give local governments more headroom for blended-finance projects, completing a feedback loop that channels consumer prosperity into long-term infrastructure demand[2]World Bank, “Indonesia Urbanization Review,” worldbank.org.
Restraints Impact Analysis*
| Restraint | (~) % Impact on CAGR Forecast | Geographic Relevance | Impact Timeline |
|---|---|---|---|
| Fiscal-deficit-driven cap-ex ceilings | -0.7% | Nationwide, hardest on secondary projects | Short term (≤ 2 years) |
| Protracted land-acquisition and permitting cycles | -0.5% | Mainly Java; emerging in peri-urban corridors | Medium term (2-4 years) |
| Climate-change-related cost escalations (flooding, sea-level) | -0.4% | Java core, coastal areas of Sumatra and Sulawesi | Long term (≥ 4 years) |
| Fragmented SME contractor ecosystem & low BIM adoption | -0.3% | National, with concentration in outer islands and rural areas | Medium term (2-4 years) |
| Source: Mordor Intelligence | |||
Fiscal-Deficit-Driven Cap-Ex Ceilings
The Ministry of Public Works budget plunged 73% to USD 1.9 billion for 2025 after a presidential efficiency mandate, forcing ministries to shelve new physical projects unless co-financed via PPPs. Although the deficit rule underpins macro stability, it shifts risk-sharing toward private investors who demand higher returns, raising project-level costs. State-owned builders now prioritize return-guaranteed toll roads over socially oriented works such as irrigation channels. The Nusantara build illustrates the tension: only 12.1% of allocated funds were spent by May 2024, compelling aggressive outreach to foreign partners. In the near term, financing scarcity may delay non-strategic assets, but it also accelerates market discipline that rewards efficient, well-structured projects.
Protracted Land-Acquisition and Permitting Cycles
Law No. 2/2012 standardized land procurement, yet inconsistent local implementation leaves 15% of owners unsatisfied with compensation, extending timelines by an average of two to three years. In Java, where land values soared up to 500% over a decade, negotiation stalemates frequently require court settlement, stalling high-profile roads and railways. Indirect costs mount quickly: contractors estimate overruns at 15-20% when access roads or utilities must be redesigned around disputed parcels. Attempts to streamline permits through a one-stop OSS system trimmed paperwork but did little to synchronize land and environmental clearances, creating new administrative chokepoints. Until procedural alignment reaches district levels, acquisition lag will remain a structural drag on the Indonesia infrastructure market.
*Our forecasts treat driver/restraint impacts as directional, not additive. The impact forecasts reflect baseline growth, mix effects, and variable interactions.
Segment Analysis
By Infrastructure: Transportation Extends the Connectivity Revolution
Transportation captured 41.87% of the 2025 project value within the Indonesia infrastructure market, reflecting its centrality to cost-of-goods reduction and regional integration. New corridors such as the 1,065.5 km Trans-Java network and the Lampung-Aceh Trans-Sumatra line shorten travel times and underpin commodity supply chains. The Jakarta–Surabaya high-speed rail feasibility stage indicates future passenger rail spending once financial close is reached. Simultaneously, 25 airports have been built or upgraded since 2015, facilitating tourism and e-commerce air-cargo flows, while the maritime “Tol Laut” program enhances port-to-port reliability across 115 ports. The Indonesia infrastructure market size for transportation projects will expand at a 6.88% CAGR through 2031 as public-sector concessional loans dovetail with private toll-road equity, positioning the segment for both volume and margin growth.
Growth potential extends beyond highways. State rail operator PT Kereta Api Indonesia now bundles station commercial rights with track upgrades, creating blended revenue streams attractive to pension funds. In aviation, Dhoho Kediri, the first unsolicited airport PPP at USD 567.7 million, sets a precedent for greenfield deals, while digital air-traffic-management systems enter procurement to raise throughput. Port operators, led by Pelindo, pursue dredging and crane automation to meet 24/7 shipping standards, and investors eye bond-financed refrigerated-container yards that link fisheries to export gateways. Together, these initiatives diversify construction orders and deepen skill requirements, reinforcing transportation’s role as the flagship of the Indonesia infrastructure market.


By Construction Type: New Builds Dominate but Renovation Gains Traction
New construction accounted for 77.35% of Indonesia infrastructure market share in 2025, underscoring the nation’s basic-facility deficit after decades of underinvestment. Greenfield megaprojects such as the Nusantara government precinct, edge data-center campuses, and multi-GW geothermal plants anchor the forward pipeline. Engineering firms deploy Building Information Modeling to compress design cycles, though adoption costs limit penetration among small subcontractors. Crucially, the push for net-zero public buildings generates demand for advanced materials and modular construction methods, opening niches for specialty suppliers.
Renovation is forecast to post a 6.62% CAGR, propelled by aging 1980s–1990s assets that require seismic retrofits and digital upgrades. Java’s dense urban fabric drives most of this spend as traffic volumes strain older bridges and tunnels. Regulation now mandates BIM for public buildings above 2,000 m², prompting owners to integrate predictive-maintenance sensors during retrofits. Financial vehicles such as energy-performance contracts help municipalities fund efficiency upgrades without upfront cash, inviting ESCOs into the Indonesia infrastructure market. As climate change intensifies rainfall and heat stress, retrofit scope increasingly includes green roofs, permeable pavements, and drainage expansions, blending civil works with environmental engineering.
By Investment Source: Private Capital Accelerates within a Public Framework
Public funds still underwrote 75.92% of 2025 disbursements, but private investment into the Indonesia infrastructure market is projected to grow 7.45% annually to 2031 as PPP structures mature. INA’s toll-road and digital-infrastructure platforms validate syndicated-equity models, while multilaterals de-risk geothermal and waste-to-energy plants through political-risk insurance. Ministerial Regulation No. 7/2023 codified 75:25 debt-to-equity norms, providing lenders with clarity on leverage ceilings. Domestic pension funds, capped at 45% infrastructure allocation, enter brownfield refinancing deals to match long-dated liabilities.
Foreign direct investment momentum is evident. The U.S. International Development Finance Corporation put USD 126 million into the Ijen geothermal field, and Nvidia teamed with Indosat for a USD 200 million AI center, signaling convergence of tech and infrastructure capital. Even mining infrastructure benefits: CIMIC’s USD 99.4 million (AUD 154 million) Pomalaa contract packages environmental offset works into EPC scope, meeting global nickel-supply ESG standards. Combined, these trends shift balance sheets away from fiscal dominance, embedding market discipline without sacrificing national-interest oversight.
Geography Analysis
Java retained 57.96% of 2025 spending thanks to dense population and the completed Trans-Java toll-road spine, which now links key industrial clusters in eight hours rather than 14. Mass-transit extensions to South Tangerang and the JORR 2 ring road unlock urban development tracts, while Jakarta’s proposed USD 10.5 billion sea wall awaits presidential sign-off amid rising flood risk. Mature assets now tilt toward capacity upgrades, such as 5G-ready fiber corridors and smart-traffic management. Private developers partner with local governments for transport-oriented complexes, broadening revenue beyond pure civil works.
Sumatra positions itself as the next logistics corridor. Completion of the 2,749 km Trans-Sumatra network draws bulk-commodity firms seeking lower shipping costs, while West Sumatra’s 83 MW geothermal expansion confirms renewable-energy potential. INA’s equity stake underwrites toll segments, and the Asian Development Bank finances connector roads to feeder ports, stitching the island into the national value chain. Secondary cities like Pekanbaru launch waste-to-energy tenders, offering EPC opportunities in urban services.
Kalimantan posts the fastest 6.42% CAGR through 2031, anchored by Nusantara and mining infrastructure upgrades. Port dredging and runway extensions precede the capital’s 2024-2029 construction schedule, ensuring materials flow without bottlenecks. Australian and Japanese firms sign MOUs for water-treatment plants sized for a projected population of 2 million. Simultaneously, South Sulawesi’s nickel corridor benefits from rail and power additions that enable downstream smelting. The region thus shifts from a resource frontier to an integrated industrial-urban ecosystem, providing a diversified workload for contractors.
Competitive Landscape
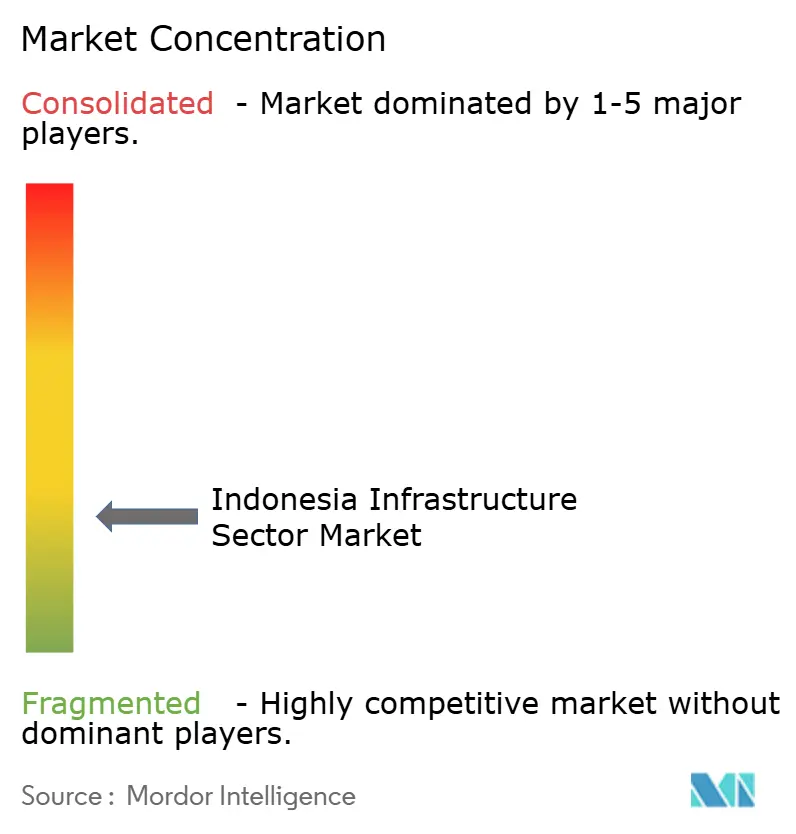
The Indonesia Infrastructure Market is fragmented. State-owned giants dominate headline projects, giving the market a moderate concentration. PT Hutama Karya leads strategic toll-road builds, while PT Wijaya Karya captured a USD 5.5 billion Terminal 2 contract at Hang Nadim Airport, reinforcing SOE dominance in aviation assets. Private firms gain share in segments requiring specialized skills data centers, hospital PPPs, and modular housing where speed and technology matter more than balance-sheet size.
Strategic alliances with foreign EPCs reshape competition. Korea Investment-Sinar Mas injects design automation into hyperscale builds, and CIMIC Group’s mining packages import Australian safety standards. These tie-ups transfer know-how to local subsidiaries, raising the industry’s average technical baseline. Digital adoption emerges as a competitive wedge: companies using BIM-to-field integration report 10-15% schedule savings, giving them an edge in bid evaluations that now score lifecycle cost.
Financing capability distinguishes winners from runners-up. SOEs capitalize on government guarantees but face leverage caps, encouraging divestment of mature assets to pension funds. Private contractors, meanwhile, bundle design-build-finance offers to shorten procurement cycles for cash-strapped municipalities. ESG credentials become a threshold rather than a bonus as lenders screen carbon footprints, forcing late adopters into costly retrofits just to stay in contention.
Indonesia Infrastructure Industry Leaders
PT Nusantara Infrastructure Tbk
PT Adhi Karya (Persero) Tbk
PT Brantas Abipraya (Persero)
PT Hutama Karya (Persero)
PT Indonesia Pondasi Raya Tbk
- *Disclaimer: Major Players sorted in no particular order

Recent Industry Developments
- January 2025: Indonesia Investment Authority and Granite Asia formed USD 1.2 billion strategic partnership focusing on digital transformation and technology ecosystem development.
- October 2024: CIMIC Group's Leighton Asia secured USD 98.93 million contract from PT Vale Indonesia for Indonesia Growth Project Pomalaa mine infrastructure in Southeast Sulawesi.
- August 2024: Korea Investment Real Asset Management and Sinar Mas formed joint venture to build USD 300 million hyperscale data center in Jakarta, with 18MW capacity and 44,195 square meters floor space.
- July 2024: Telin and BW Digital announced collaboration for Nongsa-Changi submarine cable system construction linking Batam and Singapore, featuring 24 fiber pairs across 50km.


Indonesia Infrastructure Market Report Scope
Infrastructure is the backbone of domestic and international commerce and industrial and agricultural production. It is the fundamental organizational and physical framework necessary to operate a firm successfully. Basic infrastructure in an organization or a nation comprises communication and transportation, sewage, water, a health and education system, safe drinking water, and a monetary system. A complete background analysis of the United Kingdom EV Charging Infrastructure Market, including the assessment of the economy and contribution of sectors in the economy, a market overview, market size estimation for key segments, emerging trends in the market segments, market dynamics, and geographical trends, and COVID-19 impact, is covered in the report.
The Infrastructure Sector in Indonesia is Segmented by the Infrastructure Segment (Social Infrastructure, Transportation Infrastructure, Extraction Infrastructure, Utilities Infrastructure and Manufacturing Infrastructure). The Market Size and Forecast Values (USD) for all the Above Segments.
By Infrastructure
| Transportation Infrastructure |
| Utilities Infrastructure |
| Social Infrastructure |
| Extraction Infrastructure |
By Construction Type
| New Construction |
| Renovation |
By Investment Source
| Public |
| Private |
By Geography
| Java |
| Sumatra |
| Kalimantan |
| Sulawesi |
| Rest of Indonesia |
| By Infrastructure | Transportation Infrastructure |
| Utilities Infrastructure | |
| Social Infrastructure | |
| Extraction Infrastructure | |
| By Construction Type | New Construction |
| Renovation | |
| By Investment Source | Public |
| Private | |
| By Geography | Java |
| Sumatra | |
| Kalimantan | |
| Sulawesi | |
| Rest of Indonesia |


Key Questions Answered in the Report
What is the forecast value of the Indonesia infrastructure market by 2031?
The market is projected to reach USD 140.4 billion by 2031 as planned projects under RPJMN and private PPPs move into execution.
Which segment holds the biggest share in Indonesian civil-works spending?
Transportation commands 41.87% of 2025 spending, led by toll-road and mass-transit build-outs.
Why is private capital expected to rise in Indonesian infrastructure?
Fiscal caps limit pure public funding, while standardized PPP regulations and INA co-investment platforms lower entry barriers for private investors.
Which region will grow the fastest through 2031?
Kalimantan leads with a 6.42% CAGR because of the new capital city and associated mining-logistics upgrades.
How are green bonds influencing Indonesian projects?
Sovereign and corporate green-bond issuance exceeds USD 3 billion, channeling funds into geothermal, mass transit, and flood-control assets while meeting investor ESG criteria.
Page last updated on:


