
Hydrogenated Vegetable Oil Market Size and Share
Market Overview
| Study Period | 2021 - 2031 |
|---|---|
| Market Size (2026) | USD 37.51 Billion |
| Market Size (2031) | USD 47.56 Billion |
| Growth Rate (2026 - 2031) | 7.42 % |
| Fastest Growing Market | Asia-Pacific |
| Largest Market | North America |
| Market Concentration | High |
Major Players *Disclaimer: Major Players sorted in no particular order Image © Mordor Intelligence. Reuse requires attribution under CC BY 4.0. | |
Hydrogenated Vegetable Oil Market Analysis by Mordor Intelligence
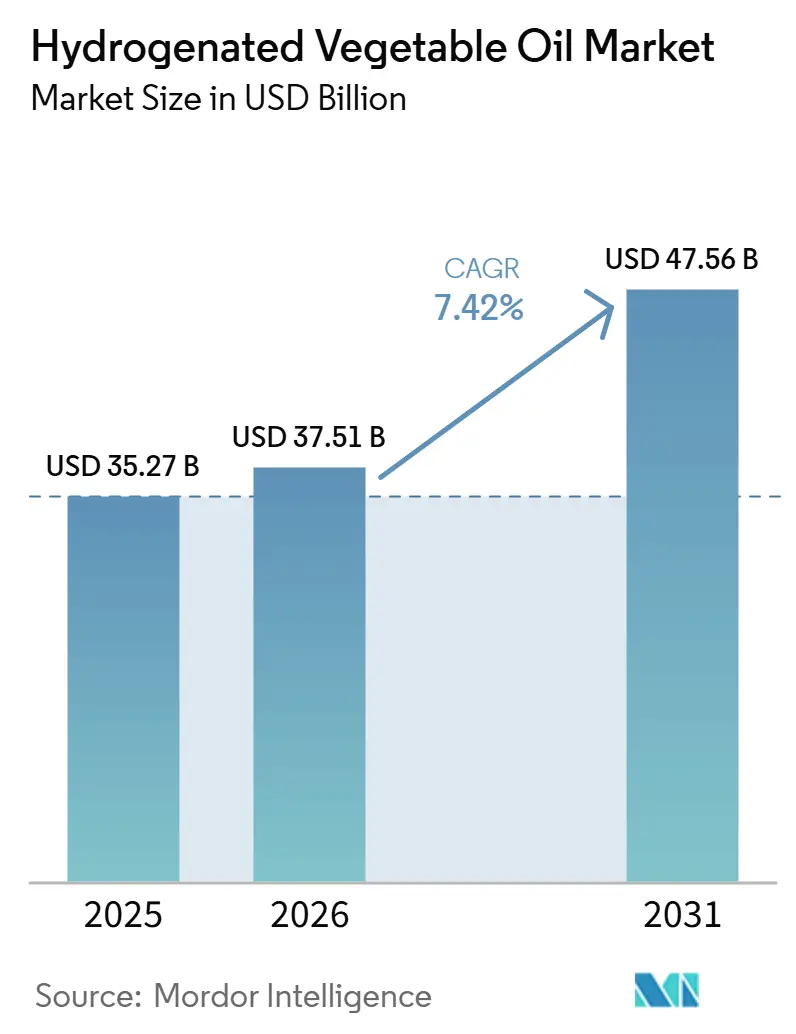
The hydrogenated vegetable oil market size was valued at USD 35.27 billion in 2025 and is estimated to grow from USD 37.51 billion in 2026 to reach USD 47.56 billion by 2031, at a CAGR of 7.42% during the forecast period (2026-2031). The hydrogenated vegetable oil market is being reshaped by food manufacturers replacing partially hydrogenated oils with fully hydrogenated and interesterified fats that can meet functional needs without industrial trans fats. Nearly 60 countries, representing 46% of the world’s population, had adopted best-practice trans-fat elimination policies by May 2025, which increased the need for verified reformulation and compliant supply chains. The hydrogenated vegetable oil market therefore has demand in two distinct settings, with affordable fats supporting processed foods in developing economies and specialized fats serving reformulation needs in developed economies. Integrated producers can use their refining scale and technical processing capabilities to serve both requirements. The hydrogenated vegetable oil market also faces greater scrutiny of feedstock traceability and finished-product compliance, which favors suppliers that can document their processes and raw materials.
Key Report Takeaways
- By product type, palm oil held 44.38% of the hydrogenated vegetable oil market share in 2025, while sunflower oil is forecast to grow at a CAGR of 8.86% through 2031.
- By application, food and beverages accounted for 56.43% of the hydrogenated vegetable oil market share in 2025, while industrial applications are projected to expand at a CAGR of 9.03% through 2031.
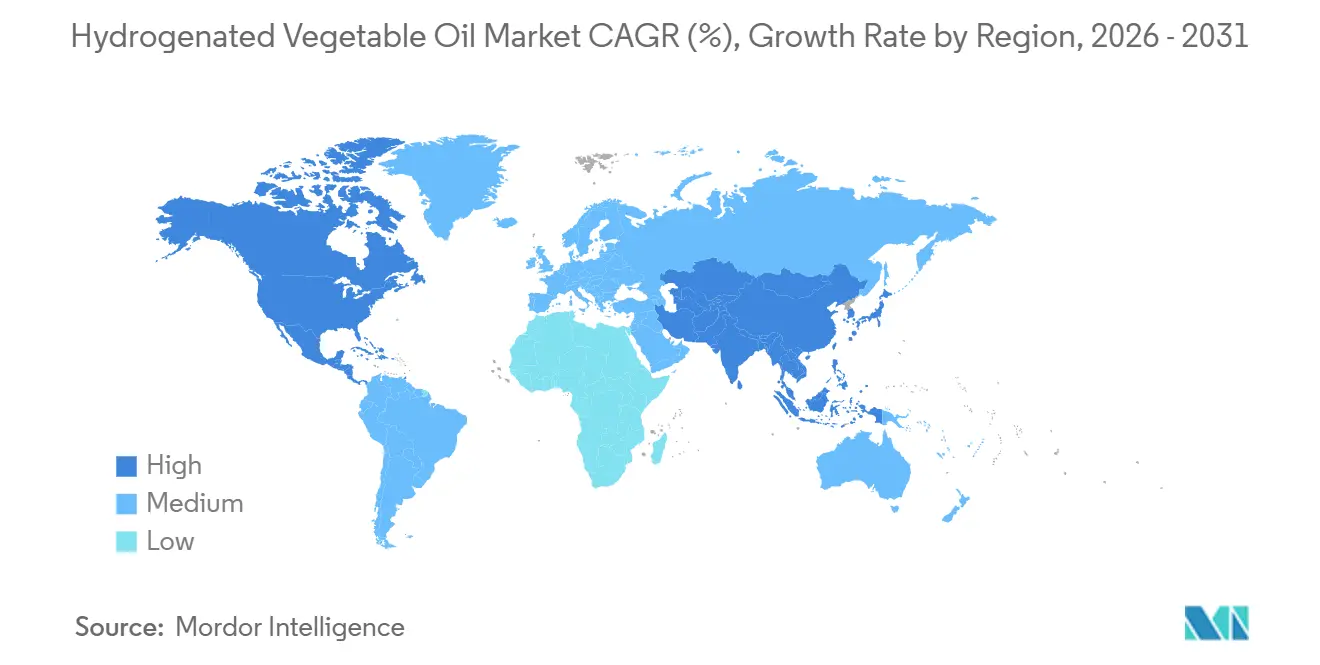
- By geography, North America held 35.68% of revenue in 2025, while Asia-Pacific is forecast to register a CAGR of 8.62% through 2031.
Note: Market size and forecast figures in this report are generated using Mordor Intelligence’s proprietary estimation framework, updated with the latest available data and insights as of January 2026.
Global Hydrogenated Vegetable Oil Market Trends and Insights
Drivers Impact Analysis*
| Driver | (~) % Impact on CAGR Forecasts | Geographic Relevance | Impact Timeline |
|---|---|---|---|
| Rising Expansion of Specialty and Functional Fats | +1.8% | Global, concentrated in North America, Europe, and APAC | Medium term (2–4 years) |
| Rising Demand for specialty fats from Processed Food Industry | +1.5% | Global, with Brazil, China, and India leading volume growth | Long term (≥ 4 years) |
| Growing Demand for Cost-Effective Fat Ingredients | +1.2% | APAC and MEA, spill-over to South America | Long term (≥ 4 years) |
| Increasing Demand from Industrial Frying Applications | +0.8% | North America and APAC core markets | Medium term (2–4 years) |
| Advancements in Fat Modification Technologies | +0.9% | Global, early gains in EU and North America R&D hubs | Medium term (2–4 years) |
| Rising Inclination Towards Plant-Based Fats | +0.6% | North America and EU, early spill-over to urban APAC | Long term (≥ 4 years) |
| Source: Mordor Intelligence | |||
Rising Expansion of Specialty and Functional Fats
Specialty and functional fats are changing the way the hydrogenated vegetable oil market serves food manufacturers. U.S. requirements have removed partially hydrogenated oils from food uses, encouraging food producers to use fully hydrogenated and interesterified alternatives where solid-fat performance is required[1]Source: World Health Organization, “WHO Recognizes Four Countries With Life-Saving Trans Fat Elimination Policies,” World Health Organization, who.int. . These alternatives can provide controlled melting behavior while avoiding industrially produced trans fats. Cargill announced a multiyear expansion of its Port Klang, Malaysia, edible oils facility in March 2026, adding specialty fats production technology to serve confectionery, bakery, and dairy customers. This type of investment raises the operational standard for suppliers that want to participate in complex customer formulations. Cocoa butter equivalents remain important because chocolate coatings require closely controlled crystallization, melting, and sensory performance.
Rising Demand for Specialty Fats from the Processed Food Industry
Processed food production remains a central source of demand for the hydrogenated vegetable oil market. Bakeries and confectionery producers use shortenings, margarines, and filling fats because these ingredients offer texture, consistency, and shelf stability. A 2026 review of alternatives to vegetable-oil hydrogenation identified interesterification, oleogelation, and sonocrystallization as relevant approaches for maintaining functional fat properties while reducing trans-fat exposure. The hydrogenated vegetable oil market continues to serve applications where these technologies complement, rather than fully replace, established processing methods. Affordable margarine and shortening remain relevant to food manufacturers in South and Southeast Asia and Sub-Saharan Africa. Codex guidance on vegetable fat content in chocolate products also provides a common framework for manufacturers that procure vegetable fat ingredients across markets.
Advancements in Fat Modification Technologies
Fat modification technologies are becoming more important as food companies seek compliant and consistent products. Enzymatic interesterification provides an alternative to partial hydrogenation and helps processors develop fats for applications that require specific melt profiles. The 2026 scientific review described interesterification, oleogelation, and sonocrystallization as established technical routes for preserving functional characteristics in food fats[2]Source: U.S. Food and Drug Administration, “Trans Fat,” U.S. Food and Drug Administration, fda.gov.. This technical shift favors companies that combine hydrogenation capacity with specialty processing knowledge. Fuji Oil has developed SOS fat technologies for cocoa butter alternatives and is expanding its Malaysia-based specialty refining presence through its venture with Johor Plantations Group. The hydrogenated vegetable oil market is consequently moving toward products that are defined more by application performance and documentation than by bulk volume alone.
Rising Inclination Towards Plant-Based Fats
Plant-based food development is widening the range of fat systems considered by food formulators. AAK received a No Questions Letter from the U.S. Food and Drug Administration in July 2024 for its shea stearin GRAS notification, enabling use in plant-based meat, poultry, and dairy alternatives. This approval gave manufacturers another option for solid-fat applications outside tropical feedstocks. The hydrogenated vegetable oil market can respond through traceable sunflower, canola, and rapeseed-based ingredients for selected premium applications. FranceAgriMer reported interest in fully hydrogenated rapeseed oil as an option for reducing reliance on exotic fats in French food applications that need a solid texture. Feedstock choice is therefore increasingly connected to labeling, origin, and customer formulation requirements. These considerations are most significant where manufacturers want both plant-based positioning and dependable physical performance.
Restraints Impact Analysis*
| Restraint | (~) % Impact on CAGR Forecasts | Geographic Relevance | Impact Timeline |
|---|---|---|---|
| Stringent regulations on trans fat content | -1.2% | North America and EU (primary), with global spill-over via WHO REPLACE initiative | Short term (≤ 2 years) to Medium term (2–4 years) |
| Rising consumer preference for healthier oils | -0.8% | North America and Europe primarily; urban APAC increasingly | Long term (≥ 4 years) |
| Availability of alternative fats | -0.5% | Global, concentrated in developed markets | Medium term (2–4 years) |
| Environmental and sustainability concerns | -0.4% | EU and North America (primary), with spill-over via RSPO certification pressure globally | Long term (≥ 4 years) |
| Source: Mordor Intelligence | |||
Stringent Regulations on Trans Fat Content
Trans-fat regulations constrain partially hydrogenated oils, while creating a reformulation requirement for other fat systems. European Union Regulation 2019/649 limits industrial trans fatty acids to 2.00 g per 100.00 g of fat in food products, requiring manufacturers to validate formulations and maintain compliance documentation[3]Source: European Commission, “Trans Fat in Food,” European Commission, ec.europa.eu.. The World Health Organization had validated 9 countries as having best-practice elimination policies by May 2025, including Austria, Norway, Oman, and Singapore. The hydrogenated vegetable oil market must therefore supply ingredients that can meet the rules of destination markets, not only those of the producing country. Finished-goods testing increases the exposure of food companies that buy unverified intermediates. This condition tends to favor certified suppliers with established quality systems.
Rising Consumer Preference for Healthier Oils
Consumer interest in minimally processed and high-oleic oils affects retail-facing food categories. Sunflower, canola, and olive oils have gained attention in applications that historically relied on fats selected for texture and shelf life. Fully hydrogenated oils can be free of industrial trans fats, but the term hydrogenated may still be associated with partially hydrogenated products by consumers. This perception can limit the appeal of products even when their formulation meets modern trans-fat requirements. High-oleic sunflower oil is also used in commercial frying, where longer fry life can support foodservice operations. The hydrogenated vegetable oil market must therefore compete on both functional evidence and understandable product communication.
*Our forecasts treat driver/restraint impacts as directional, not additive. The impact forecasts reflect baseline growth, mix effects, and variable interactions.
Segment Analysis
By Product Type: Palm Oil Leads While Sunflower Oil Gains Ground
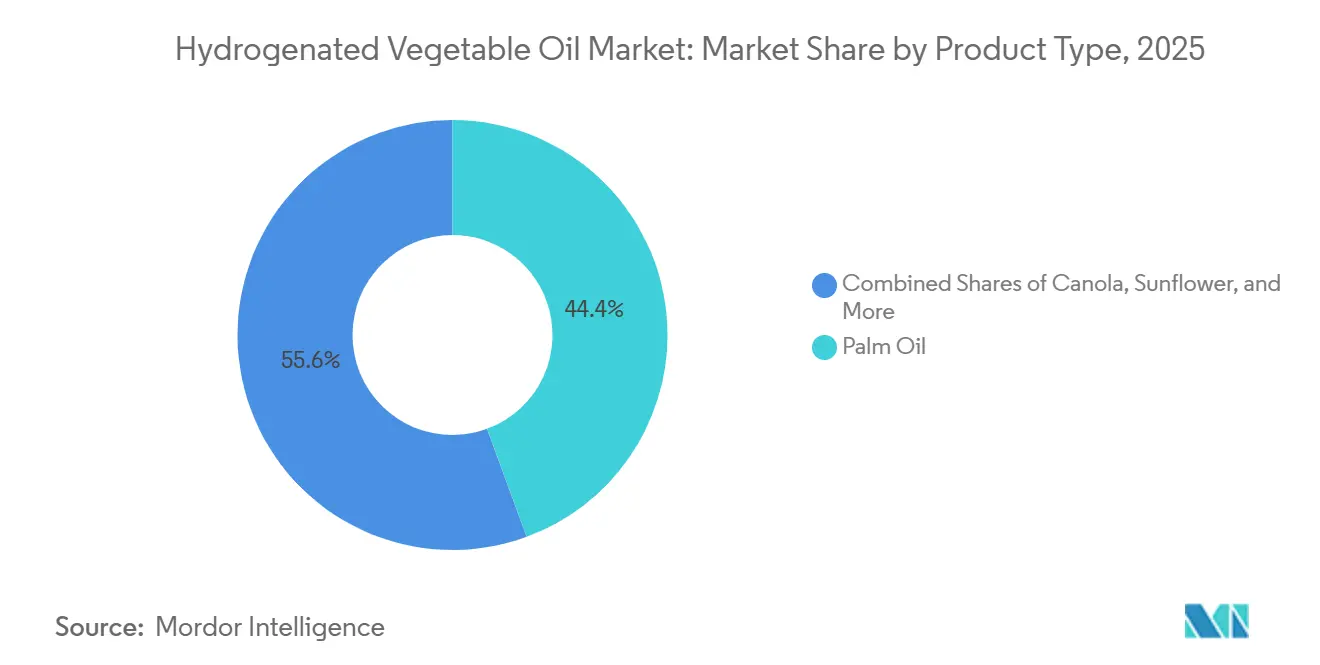
Palm oil accounted for 44.38% of global revenue in 2025. Its position reflects a cost advantage, a neutral flavor profile, and its broad suitability for bakery, confectionery, and foodservice frying. Its semi-solid form at room temperature and oxidation resistance support use in margarine and shortening. These characteristics remain valuable for processors operating at an industrial scale, even as European due diligence expectations increase attention to palm-related traceability and sourcing. Suppliers must show sustainable practices without removing the technical role of palm-based fats.
Soybean oil held the second-largest position, particularly in North American and Latin American markets where established oilseed crushing capacity supports a cost-effective shortening base for nearby food manufacturers. Canola-based products are gaining attention in premium applications in Canada, Germany, and France, where non-GMO positioning can support product differentiation. Coconut-derived and other tropical fat variants remain relevant in selected confectionery and personal care uses. Sunflower oil is forecast to grow at a CAGR of 8.86% through 2031. The hydrogenated vegetable oil market size for sunflower oil is supported by demand for clean-label formulations and trans-fat-compliant alternatives. USDA data placed global high-oleic sunflower oil production at 3.20 million metric tons in the 2024/25 marketing year, while concentration of supply in Ukraine and Eastern Europe encourages dual sourcing and forward contracts.



By Application: Food and Beverages Lead While Industrial Uses Expand
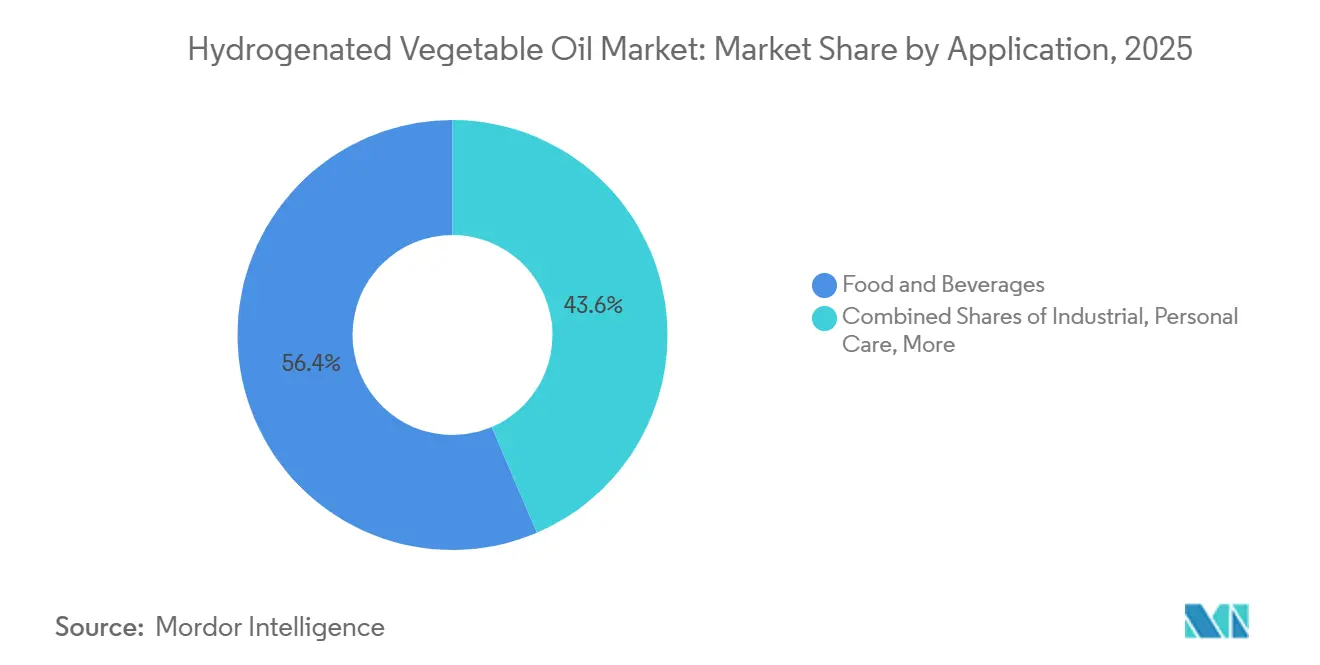
Food and beverages represented 56.43% of global revenue in 2025. The segment includes dairy products, bakery and confectionery, snacks and savory foods, and meat products. Bakery and confectionery applications rely on controlled melting behavior, crystallization, and compatibility with cocoa butter systems. Coffee creamers, cheese analogs, whipped toppings, instant noodles, and seasoned crackers use structured vegetable fat systems for texture, stability, shelf life, and product consistency. Plant-based meat products are a smaller but developing use because structured fats can help create the desired mouthfeel.
Industrial applications are projected to grow at a CAGR of 9.03% through 2031. Lubricants, candles, and industrial surfactants use hydrogenated vegetable oils for thermal stability and wax-like properties. Personal care and cosmetics are another application area, where these ingredients act as emollients, consistency agents, and carrier bases in lipstick, skin creams, and hair conditioners. Animal feed is a smaller and stable application, especially in aquaculture and livestock formulations where fat contributes energy density. Food-grade compliance requirements also raise the cost of participation for smaller suppliers. The hydrogenated vegetable oil market provides an input for both consumer formulations and industrial processes, which broadens the sources of demand.
Geography Analysis
North America held 35.68% of global revenue in 2025. The United States supports this position through a large processed-food manufacturing base and its transition from partially hydrogenated oils to fully hydrogenated alternatives. The Food and Drug Administration removed the generally recognized as safe status for partially hydrogenated oils, and subsequent regulatory changes eliminated the remaining references in food standards. Canada and Mexico add demand through packaged foods and foodservice activity, while cross-border supply relationships support standardized fat ingredients. Foodservice and industrial frying remain important because commercial kitchens require reliable shelf-stable products.
Europe has a mature reformulation environment shaped by trans-fat limits and demand for specialized products. The European Union’s 2.00 g per 100.00 g limit has made compliant formulations an established requirement for food manufacturers. Germany is forecast to register a CAGR of 4.71% through 2031, supported by baking, confectionery, and plant-based food production. Demand also reflects interest in certified and traceable fat ingredients, while OMV launched an Austrian co-processing facility in June 2024 with capacity for 160,000.00 metric tons of liquid biomass annually. Spain, the Netherlands, Poland, and Belgium provide additional processing and trading links for the region.
Asia-Pacific is forecast to grow at a CAGR of 8.62% through 2031, making it the fastest-growing regional part of the hydrogenated vegetable oil market size. Malaysia and Indonesia are major palm and soybean oil processing centers, while India, China, Vietnam, and Thailand have expanding bakery, instant-noodle, and foodservice demand. India’s food regulator has enforced trans-fat limits for processed foods, supporting a shift toward fully hydrogenated and interesterified fats. South America benefits from Brazil and Argentina’s oilseed base and growing domestic food sector, while the Middle East and Africa remain important import regions with high processed-food imports and increasing domestic production. Sub-Saharan African markets have longer-term potential as urbanization, incomes, and food processing capacity develop.

Competitive Landscape
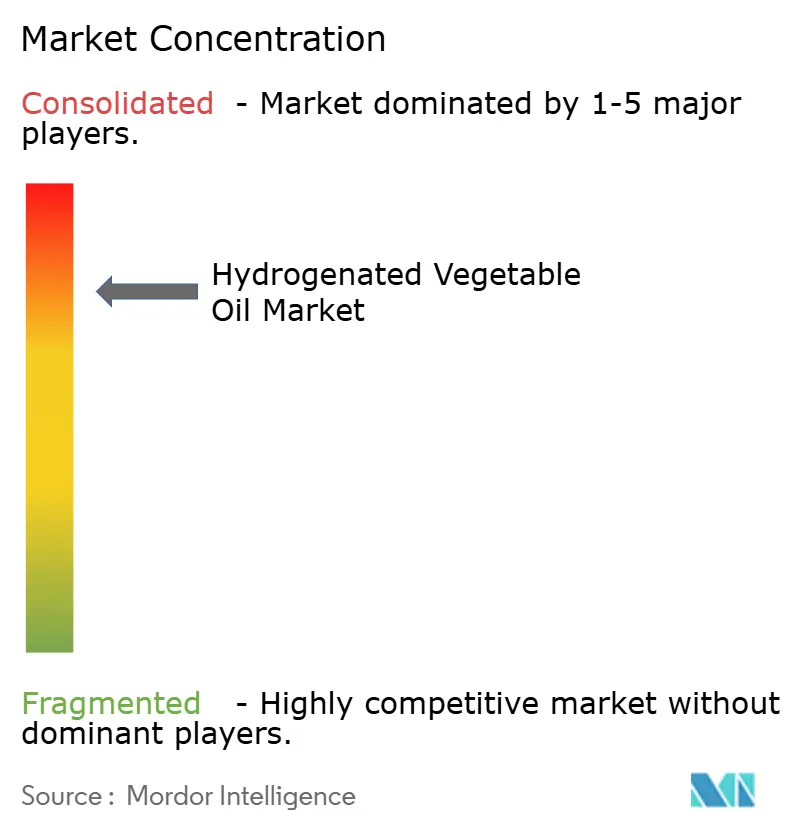
The hydrogenated vegetable oil market has a concentrated structure because integrated processors can combine plantations, crushing operations, refining, and specialty fat processing. Wilmar International, Cargill, Bunge, AAK, and ADM have manufacturing and supply networks that reach feedstock-producing regions and major consumption markets. Their scale supports reliable procurement, technical support, and compliance systems as the hydrogenated vegetable oil market moves from commodity-grade products toward specialty fractions. This change favors suppliers that can develop customized solutions and verify product performance. Smaller producers can still compete where they offer local supply, tailored formulations, or lower minimum order quantities.
Cargill’s March 2026 Port Klang expansion is an example of investment in specialty fats capacity for customers in Asia-Pacific, Europe, the Middle East, and Africa. IOI’s associate company, Bunge Loders Croklaan, completed its second New Orleans specialty fats plant in early 2026 and continued work on an energy-efficient Amsterdam refinery, according to IOI’s 2025 integrated report. AAK and Kuala Lumpur Kepong formed Nura Specialty Oils and Fats in October 2025 to produce specialty palm fractions for cocoa butter alternatives. These projects place capacity close to key feedstock and customer regions, while increasing the availability of specialty fractions for confectionery applications. The competitive advantage lies in connecting feedstock access with refining, application knowledge, and quality assurance.
Sustainability and traceability requirements add another competitive factor for the hydrogenated vegetable oil market. RSPO certification and European Union deforestation-related requirements are increasingly relevant to suppliers serving European buyers. These requirements can make verified supply chains more valuable than unverified low-cost sourcing, although Oleo-Fats in the Philippines and Mewah International in Singapore can serve smaller customers with tailored fat systems. The planned JPG-Fuji Oil specialty refinery in Malaysia adds specialty palm processing capacity tied to a sustainably certified supply chain.
Hydrogenated Vegetable Oil Industry Leaders
AAK AB
Archer Daniels Midland Company
Bunge Limited
Cargill, Incorporated
Fuji Oil Holdings Inc.
- *Disclaimer: Major Players sorted in no particular order

Recent Industry Developments
- March 2026: Cargill announced a multi-million-dollar expansion of its edible oil plant in Port Klang, Malaysia, adding a new specialty fats production line, the first specialty fats processing technology deployment in Cargill's global edible oils network. The expansion serves customers across Asia-Pacific, Europe, the Middle East, and Africa with chocolate confectionery, bakery, and dairy fat solutions, building on a prior USD 20.00 million investment at the same facility in 2020.
- March 2026: IOI Corporation's associate company Bunge Loders Croklaan completed its second specialty fats plant in New Orleans, increasing production capacity for cocoa butter equivalents and cocoa butter replacers by 5.00-10.00% year-on-year. A new energy-efficient refinery in Amsterdam is progressing, with phase 1 scheduled for completion by September 2026, consolidating BLC's European operations and reducing carbon emissions from its Rotterdam-era infrastructure.
- October 2025: AAK and Kuala Lumpur Kepong Berhad established Nura Specialty Oils and Fats, a joint venture in Pasir Gudang, Malaysia, focused on specialty palm fraction production for cocoa butter alternatives. AAK's total investment is SEK 300.00 million (USD 28.00 million at 2025 exchange rates) over 3 years, the plant is expected to ramp up in 2028 and reach full utilization in 2029.


Global Hydrogenated Vegetable Oil Market Report Scope
| Palm Oil |
| Soyabean Oil |
| Canola Oil |
| Sunflower Oil |
| Others |
| Food and Beverages | Dairy products |
| Bakery and Confectionery | |
| Snacks and Savory Products | |
| Meat Products | |
| Other Types | |
| Personal Care and Cosmetics | |
| Animal Feed | |
| Industrial | |
| Other Applications |
| North America | United States |
| Canada | |
| Mexico | |
| Rest of North America | |
| Europe | Germany |
| United Kingdom | |
| France | |
| Italy | |
| Spain | |
| Netherlands | |
| Sweden | |
| Poland | |
| Belgium | |
| Rest of Europe | |
| Asia-Pacific | China |
| India | |
| Japan | |
| Australia | |
| South Korea | |
| Vietnam | |
| Indonesia | |
| Thailand | |
| Singapore | |
| Rest of Asia-Pacific | |
| South America | Brazil |
| Argentina | |
| Chile | |
| Peru | |
| Colombia | |
| Rest of South America | |
| Middle East and Africa | United Arab Emirates |
| Saudi Arabia | |
| South Africa | |
| Nigeria | |
| Egypt | |
| Morocco | |
| Turkey | |
| Rest of Middle East and Africa |
| Product Type | Palm Oil | |
| Soyabean Oil | ||
| Canola Oil | ||
| Sunflower Oil | ||
| Others | ||
| Application | Food and Beverages | Dairy products |
| Bakery and Confectionery | ||
| Snacks and Savory Products | ||
| Meat Products | ||
| Other Types | ||
| Personal Care and Cosmetics | ||
| Animal Feed | ||
| Industrial | ||
| Other Applications | ||
| By Geography | North America | United States |
| Canada | ||
| Mexico | ||
| Rest of North America | ||
| Europe | Germany | |
| United Kingdom | ||
| France | ||
| Italy | ||
| Spain | ||
| Netherlands | ||
| Sweden | ||
| Poland | ||
| Belgium | ||
| Rest of Europe | ||
| Asia-Pacific | China | |
| India | ||
| Japan | ||
| Australia | ||
| South Korea | ||
| Vietnam | ||
| Indonesia | ||
| Thailand | ||
| Singapore | ||
| Rest of Asia-Pacific | ||
| South America | Brazil | |
| Argentina | ||
| Chile | ||
| Peru | ||
| Colombia | ||
| Rest of South America | ||
| Middle East and Africa | United Arab Emirates | |
| Saudi Arabia | ||
| South Africa | ||
| Nigeria | ||
| Egypt | ||
| Morocco | ||
| Turkey | ||
| Rest of Middle East and Africa | ||


Key Questions Answered in the Report
What is the forecast for hydrogenated vegetable oil demand through 2031?
The hydrogenated vegetable oil market is forecast to grow from USD 37.51 billion in 2026 to USD 47.56 billion by 2031 at a CAGR of 7.42%.
Why do food manufacturers use hydrogenated vegetable oils?
Food manufacturers use these fats for texture, melting behavior, shelf stability, and process consistency in bakery, confectionery, dairy, and snack products.
Which product type leads global demand?
Palm oil led with 44.38% share in 2025 because of its cost, neutral flavor, stability, and broad use in shortenings and frying fats.
Which application is growing fastest?
Industrial applications are forecast to grow at a CAGR of 9.03% through 2031, supported by lubricants, candles, and industrial surfactants.
Page last updated on:





