
Grain and Seed Optical Sorting Systems Market Size and Share
Market Overview
| Study Period | 2020 - 2031 |
|---|---|
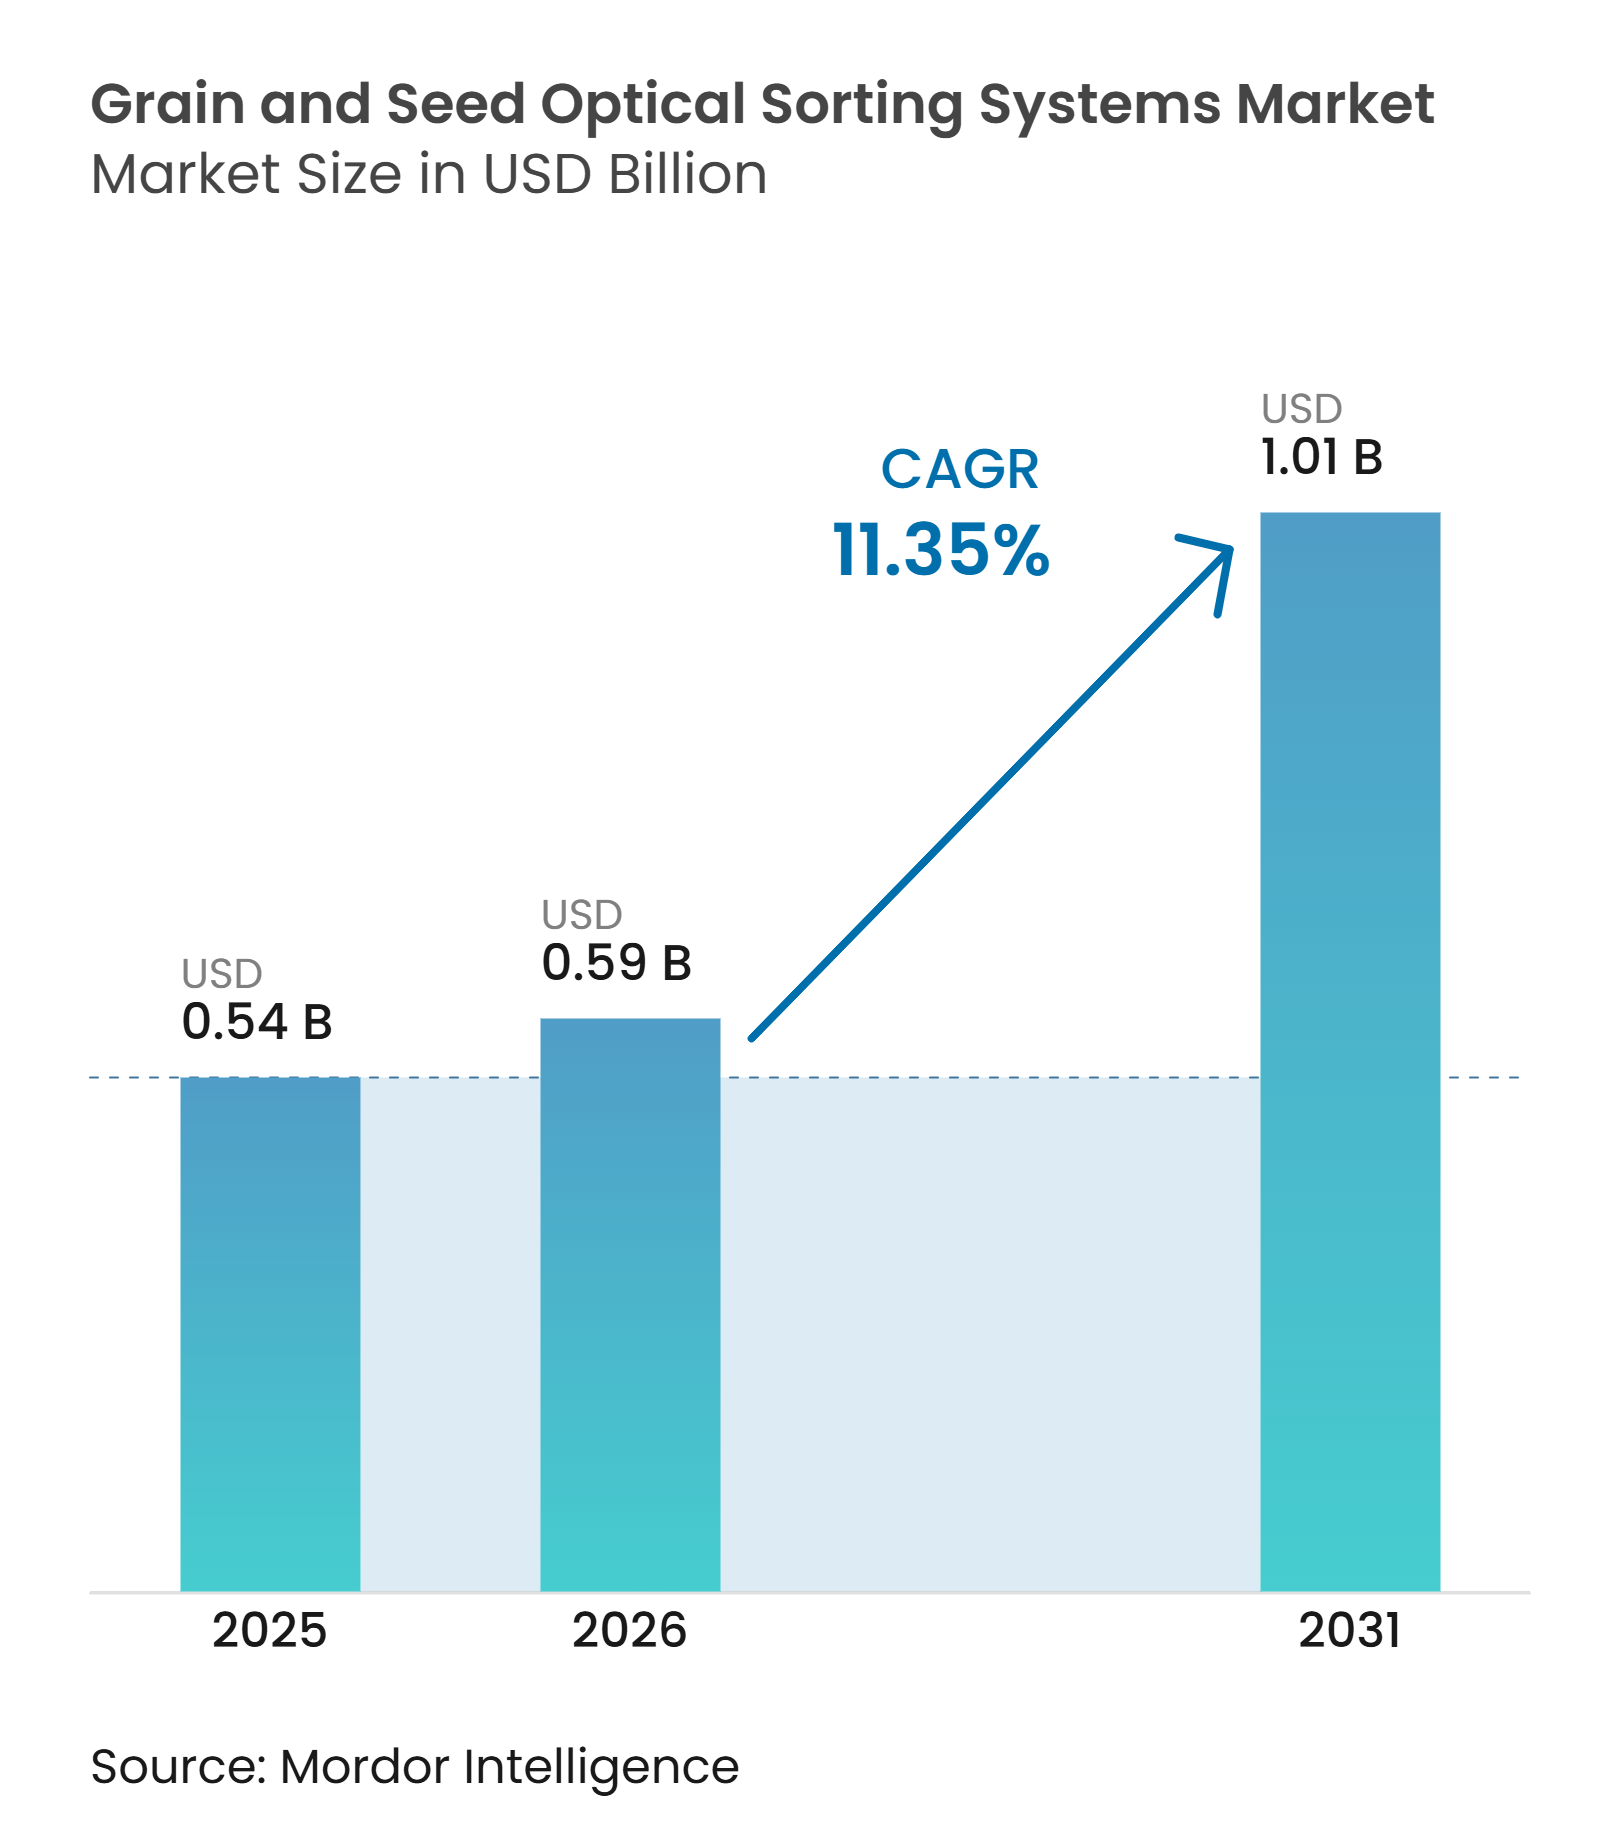
| Market Size (2026) | USD 0.59 Billion |
| Market Size (2031) | USD 1.01 Billion |
| Growth Rate (2026 - 2031) | 11.35 % |
| Fastest Growing Market | Asia-Pacific |
| Largest Market | Asia-Pacific |
| Market Concentration | Medium |
Major Players *Disclaimer: Major Players sorted in no particular order Image © Mordor Intelligence. Reuse requires attribution under CC BY 4.0. | |
Grain and Seed Optical Sorting Systems Market Analysis by Mordor Intelligence
The grain and seed optical sorting systems market size is projected to expand from USD 0.54 billion in 2025 to USD 0.59 billion in 2026, and to USD 1.01 billion by 2031, registering a CAGR of 11.35% between 2026 and 2031. Food safety rules, lower post-harvest losses, and limited processing labor are increasing the demand for automated inspection. Requirements under the Food Safety Modernization Act and EU food law are making sorting accuracy a standard procurement requirement across export supply chains. Buyers also seek reliable quality records, which broadens the role of sorting equipment from process control to supplier qualification. Asia-Pacific combines a large installed base of rice and grain mills with modernization programs in China, India, and Southeast Asia. Equipment suppliers are responding with AI-based defect detection, modular designs, local service, and connected quality data tools.
Key Report Takeaways
- By product type, grain optical sorting systems held 72.33% of the grain and seed optical sorting systems market share in 2025, while seed optical sorting systems are projected to expand at an 11.76% CAGR through 2031.
- By application, final product purity sorting accounted for 27.77% of the grain and seed optical sorting systems market size in 2025, while seed grading and germination quality protection is projected to expand at a 12.31% CAGR through 2031.
- By end user, grain and seed processors held 28.89% of the market in 2025, while seed processing companies are projected to expand at a 12.74% CAGR through 2031.
- By capacity, the 2 to 5 metric tons per hour tier held 29.91% of the market in 2025, while systems above 10 metric tons per hour are projected to expand at a 12.13% CAGR through 2031.
- By geography, Asia-Pacific held 35.51% of the market in 2025 and is projected to expand at a 12.28% CAGR through 2031.
Note: Market size and forecast figures in this report are generated using Mordor Intelligence’s proprietary estimation framework, updated with the latest available data and insights as of January 2026.
Market Trends and Insights
Drivers Impact Analysis of Grain and Seed Optical Sorting Systems Market*
| Driver | (~) % Impact on CAGR Forecast | Geographic Relevance | Impact Timeline |
|---|---|---|---|
| Tightening Food Safety and Grain Quality Requirements | +3.0% | Global | Short term (≤ 2 years) |
| Labor Shortages and Rising Sorting Costs | +2.1% | North America, Europe, Asia-Pacific | Short term (≤ 2 years) |
| Expansion of Automated Grain and Seed Processing Capacity | +1.8% | Asia-Pacific, South America | Medium term (2-4 years) |
| AI-Enabled Detection of Low-Contrast and Complex Defects | +1.5% | Global | Medium term (2-4 years) |
| Traceable Quality Data for Export and Contract Compliance | +0.8% | Global, with early gains in major exporting nations | Medium term (2-4 years) |
| Reduced Sensor Costs and Modular Retrofit Availability | +0.5% | Asia-Pacific, South America, Middle East and Africa | Long term (≥ 4 years) |
| Source: Mordor Intelligence | |||
Tightening Food Safety and Grain Quality Requirements
Food safety agencies have reduced acceptable contaminant thresholds for cereal products. The Food Safety Modernization Act places preventive-control obligations on grain handlers. European requirements for mycotoxins similarly raise the value of dependable inspection. These requirements make the grain and seed optical sorting systems market more relevant to processors that serve export channels. Private buyers also review sorting performance during supplier qualification. Cimbria states that UV illumination can identify Aspergillus-infected kernels that are difficult to distinguish by sight.
Labor Shortages and Rising Sorting Costs
Labor constraints are changing the case for automated sorting in processing facilities. Washington State University reported that the US farmworker population declined 23% from 2017 to 2022. It also reported a 37% contraction in the migrant labor force over the same period.[1] Operators cannot always be incentivized to fill inspection and handling roles with higher pay. As a result, equipment is increasingly used to maintain coverage across shifts. This supports demand among country elevators and cooperatives that previously delayed capital purchases.
Expansion of Automated Grain and Seed Processing Capacity
New processing plants in Asia-Pacific and South America create a clear outlet for high-throughput sorters. Agroholding Volyn-Grain-Product commissioned a 12-metric-ton-per-hour automated seed plant in Ukraine in 2025. The plant integrated Satake multispectral cameras with AI support, achieving finished-product uniformity of up to 99.99%. Larger sites need equipment that can maintain output while applying consistent rejection criteria. Consolidated processing hubs also make local installation and service capability more important. This setup favors suppliers with regional support teams and experience across crop types.
AI-Enabled Detection of Low-Contrast and Complex Defects
AI tools improve detection when conventional color thresholds cannot distinguish between similar materials. A 2025 study found that LSTM neural networks applied to hyperspectral seed images reached classification accuracy above 99% for wheat and barley. This capability matters for grains with similar spectral signatures and for low-contrast defects. Bühler launched the SORTEX AI700 in May 2025 with deep learning trained on millions of labeled grain images. The equipment can also provide feedback that helps operators correct upstream processes. Quality records produced by the machines can support compliance documents used in export trade.
Restraints Impact Analysis of Grain and Seed Optical Sorting Systems Market*
| Restraint | (~) % Impact on CAGR Forecast | Geographic Relevance | Impact Timeline |
|---|---|---|---|
| High Capital Expenditure for Hyperspectral and Multisensor Systems | -1.9% | South America, Middle East and Africa, emerging Asia-Pacific | Medium term (2-4 years) |
| Limited Technical Skills for Calibration and Maintenance | -1.3% | Middle East and Africa, South America, Southeast Asia | Short term (≤ 2 years) |
| Variable Grain Quality and Inconsistent Feed Presentation | -0.8% | South America, Middle East and Africa | Short term (≤ 2 years) |
| Limited Digital Infrastructure in Small and Mid-Sized Processing Facilities | -0.5% | Middle East and Africa, Central and South Asia | Long term (≥ 4 years) |
| Source: Mordor Intelligence | |||
High Capital Expenditure for Hyperspectral and Multisensor Systems
Hyperspectral and multisensor sorters cost more than entry-level RGB equipment. They are used for mycotoxin detection, allergen exclusion, and variety-purity assessment. That cost limits adoption among smaller processors in emerging economies. Financing options for agricultural equipment remain less available in parts of South America and Africa. Retrofit systems can add sensing channels to installed conveyors and reduce the size of a full replacement project. However, these projects still require capital and technical integration.
Limited Technical Skills for Calibration and Maintenance
Advanced equipment requires regular calibration against certified reference standards. NIR, InGaAs, and hyperspectral cameras can lose detection accuracy when calibration is not maintained. Operators may not recognize performance drift without appropriate training. Bühler describes automated sensitivity controls and recipe-based settings in its SORTEX J SpectraVision platform. These features reduce some operating complexity but do not remove the need for technical literacy. Remote diagnostics and AI-guided maintenance can help facilities that have stable connectivity.
*Our forecasts treat driver/restraint impacts as directional, not additive. The impact forecasts reflect baseline growth, mix effects, and variable interactions.
Grain and Seed Optical Sorting Systems Market Segment Analysis
By Product Type:
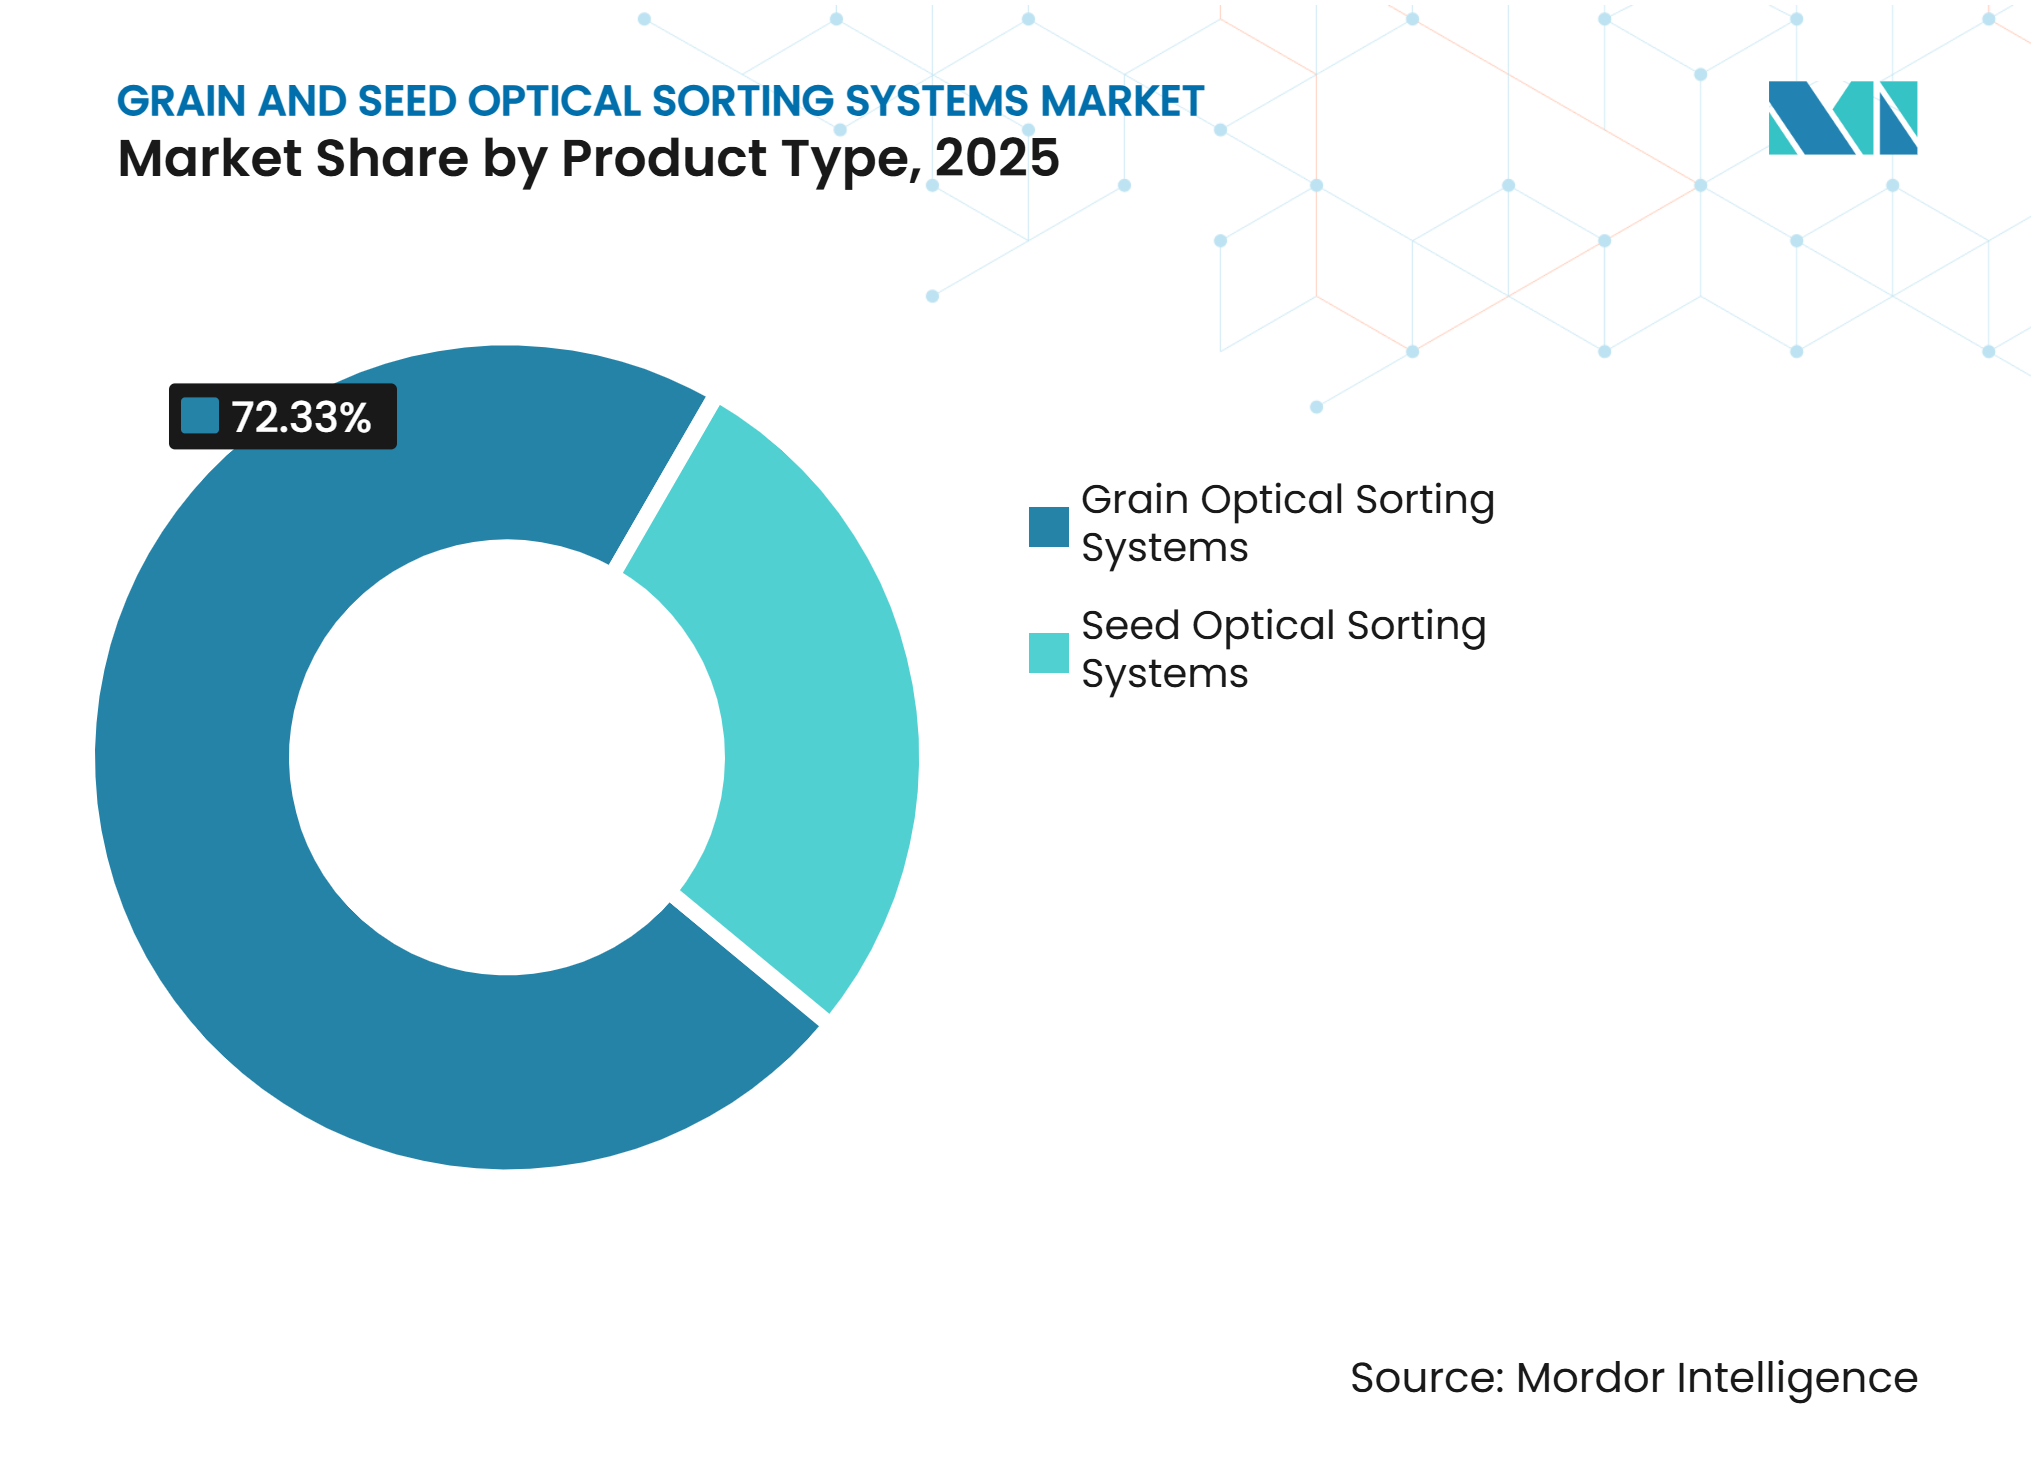
Grain Systems Lead While Seed Systems Expand FasterGrain optical sorting systems held 72.33% of the grain and seed optical sorting systems market share in 2025. Their position reflects the scale of commercial processing of rice, wheat, corn, and coarse grains. Large plants typically require throughput-oriented equipment and established operating practices. Grain processing is also geographically broader than specialized seed treatment. China published GB/T 46296-2025 in October 2025, and the standard became effective in May 2026. It specifies requirements for detecting discolored kernels in sorghum, oats, mung beans, and broad beans. This extends the role of color sorting in domestic grain processing. It also supports equipment replacement where existing systems do not meet the new requirements.
Seed optical sorting systems are projected to expand at an 11.76% CAGR from 2026 to 2031. Seed producers need documented germination quality for regulated seed trade. This need is stronger for hybrid seed producers serving Europe and North America. Seed equipment increasingly uses hyperspectral and NIR sensing rather than RGB-only cameras. Moisture gradients, chlorophyll residues, and embryo integrity are not consistently visible through color imaging. US Patent 12196671 describes a hyperspectral multi-camera system that compares per-seed reflectance against health-standard thresholds to enable automatic rejection. Suppliers are building species-specific algorithm libraries and calibration settings. These capabilities help them compete where precision is more important than raw throughput.


By Application:
Final Product Purity Leads While Seed Grading Advances FasterFinal product purity sorting accounted for 27.77% of the grain and seed optical sorting systems market size in 2025, making it the largest application segment during the base year. This application category held the highest share among the applications covered in the supplied metrics. Its leading position reflects the importance of optical sorting systems in ensuring the purity and quality of finished grain and seed products. The category led the application comparison in 2025 and represented the largest application share in the market.
Seed grading and germination quality protection is projected to expand at a 12.31% CAGR from 2026 to 2031, representing the fastest growth rate among the application categories provided. This forecast indicates that demand for systems supporting seed grading and germination quality protection is expected to grow more rapidly than demand in other application areas over the forecast period. While final-product purity sorting accounted for the largest share in 2025, seed grading and germination quality protection is expected to lead application growth through 2031.
By End User:
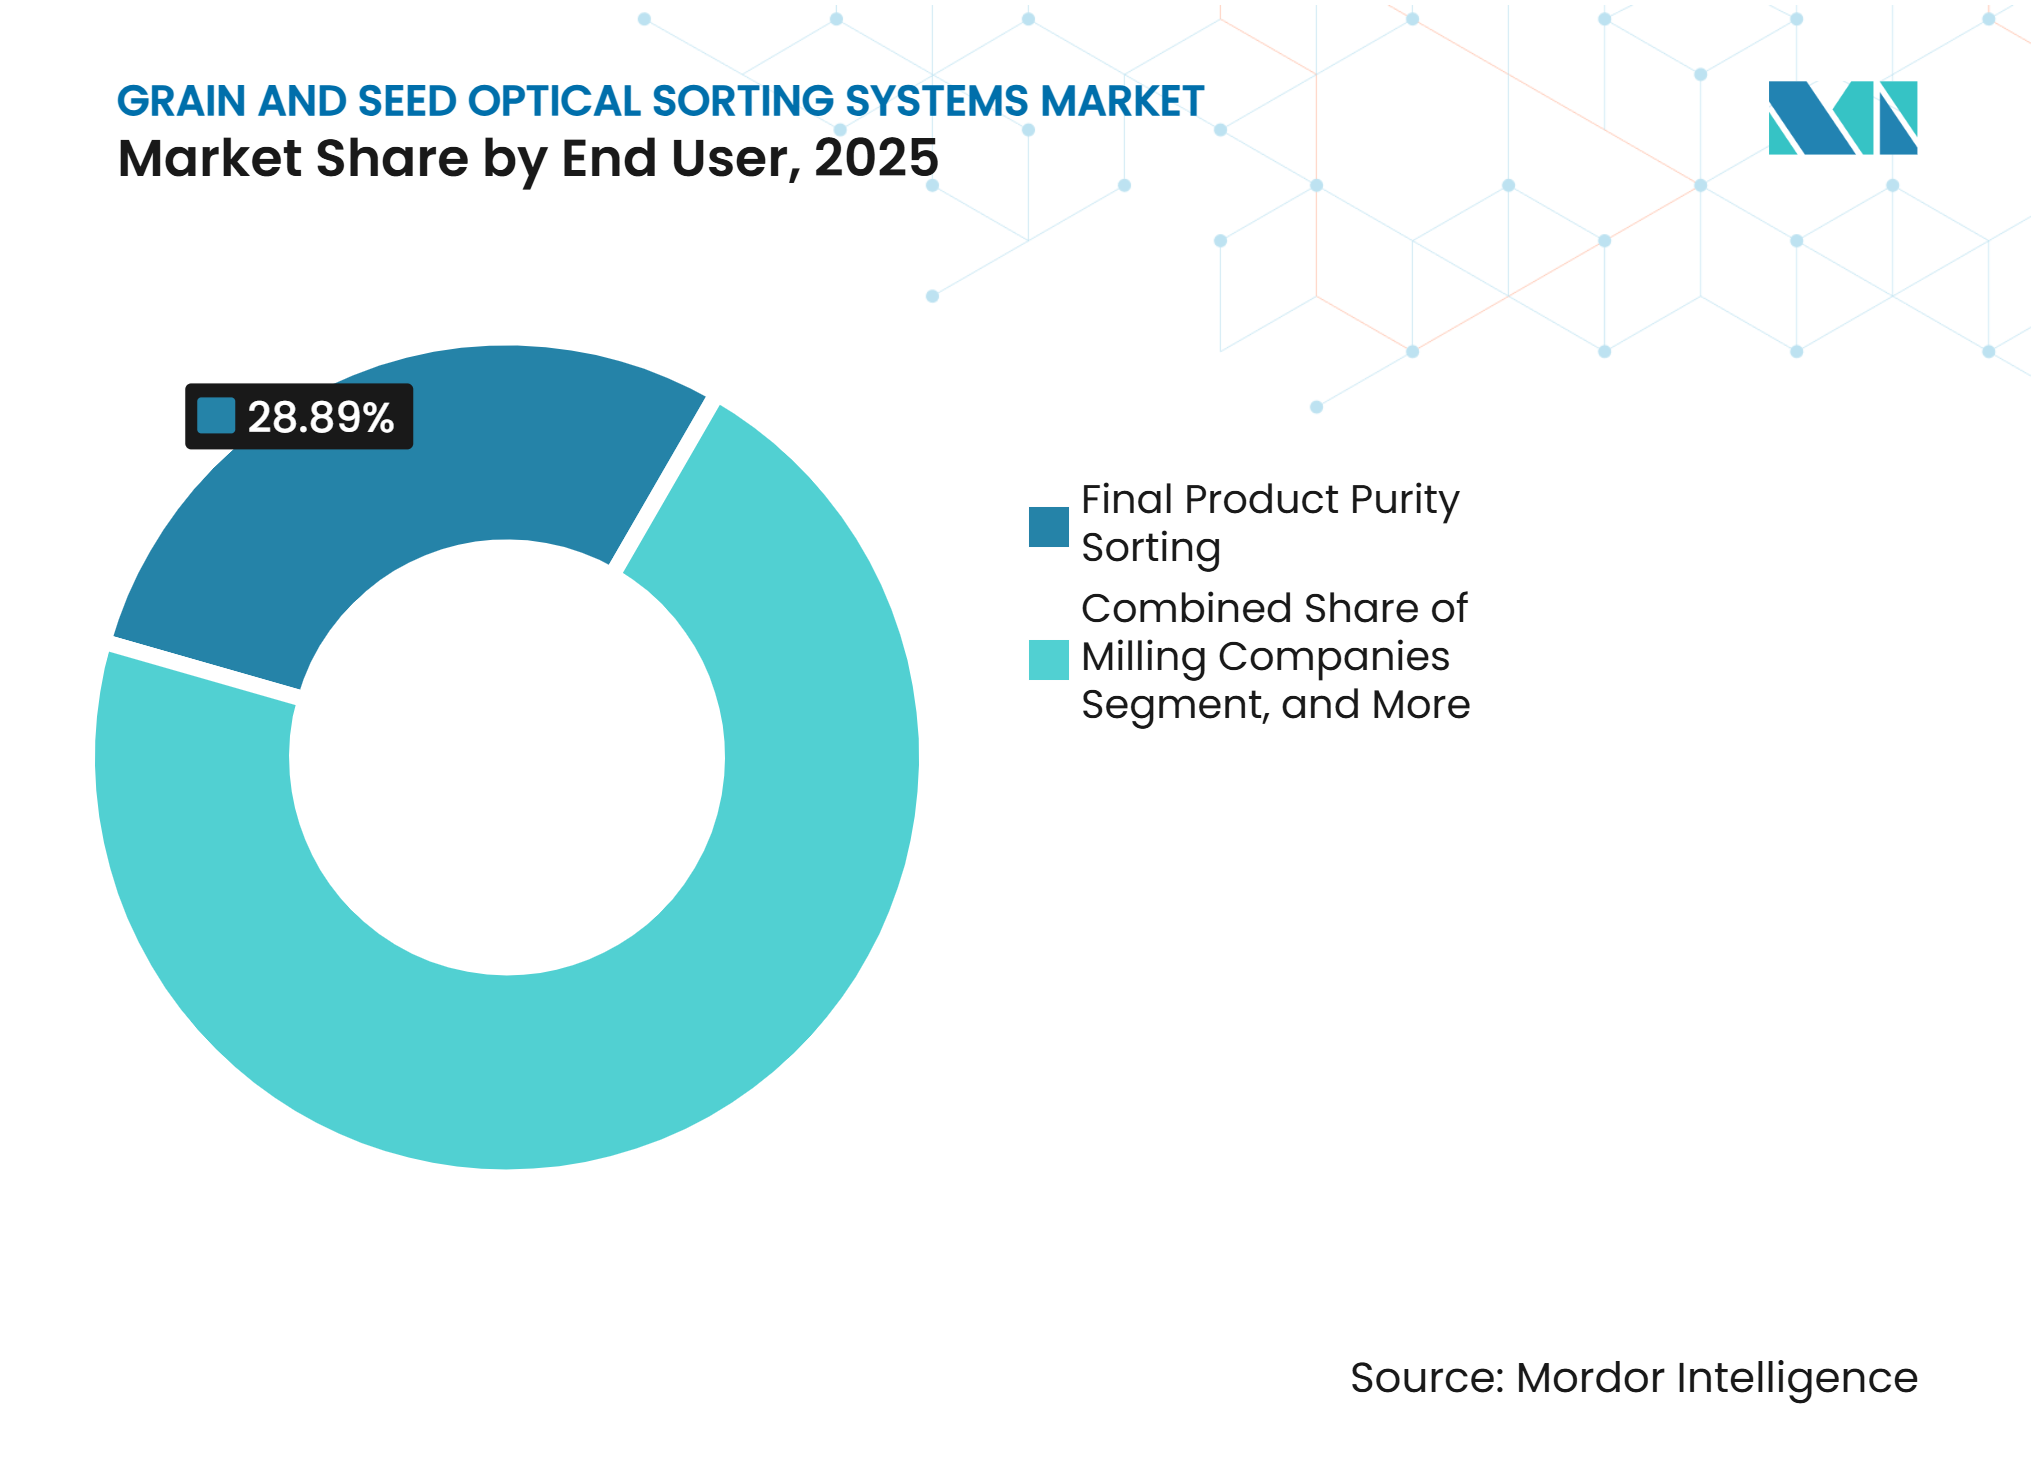
Processors Hold The Largest Share While Seed Companies Lead GrowthGrain and seed processors held 28.89% of the market in 2025, making them the largest end-user group during the year. This share represented the highest proportion among all end-user categories covered in the analysis and established the group as the leading end-user segment based on its current market presence. The 28.89% share indicates that grain and seed processors accounted for more than one-fourth of the market in 2025. Within the supplied metrics, this group was the largest end-user cohort and ranked ahead of the other end-user categories in market share for the year.
Seed processing companies are projected to expand at a 12.74% CAGR from 2026 to 2031. This rate represents the highest growth forecast among the end-user categories provided for the forecast period, positioning seed processing companies as the fastest-expanding end-user group. Although grain and seed processors held the leading market share in 2025, seed processing companies are expected to record stronger growth over the 2026-2031 period. The forecast, therefore, indicates a distinction between the current market leadership of grain and seed processors and the faster projected expansion of seed processing companies during the forecast period.


By Capacity:
Mid-Range Systems Support The Installed Base While High Throughput LeadsThe 2 to 5 metric tons per hour tier held 29.91% of the grain and seed optical sorting systems market share in 2025. It reflects the large installed base of mid-scale processors in Asia-Pacific and Europe. These facilities adopted this configuration during earlier investment cycles. It offers a balance between capacity, system cost, and available operating space. The up to 2 metric tons per hour segment serves artisan mills, small cooperatives, and seed breeders. Lower entry prices from Chinese suppliers are making this category more accessible to first-time buyers. The 5 to 10 metric tons per hour tier serves established commercial mills and export processors. In this tier, verified results and local after-sales support are often decisive factors in the selection process.
Systems above 10 metric tons per hour are projected to expand at a 12.13% CAGR from 2026 to 2031. Greenfield processing hubs in South America and South and Southeast Asia are a central source of demand. High-throughput sites need uniform sorting performance across large volumes. The 12-metric-ton-per-hour Ukrainian seed plant illustrates the use of multispectral cameras and AI support in a large automated facility. Larger installations also create a need for dependable commissioning, maintenance, and spare parts support. Equipment selection consequently includes lifecycle support as well as capacity. The grain and seed optical sorting systems market can benefit from where consolidated infrastructure replaces fragmented local processing.
Geography Analysis
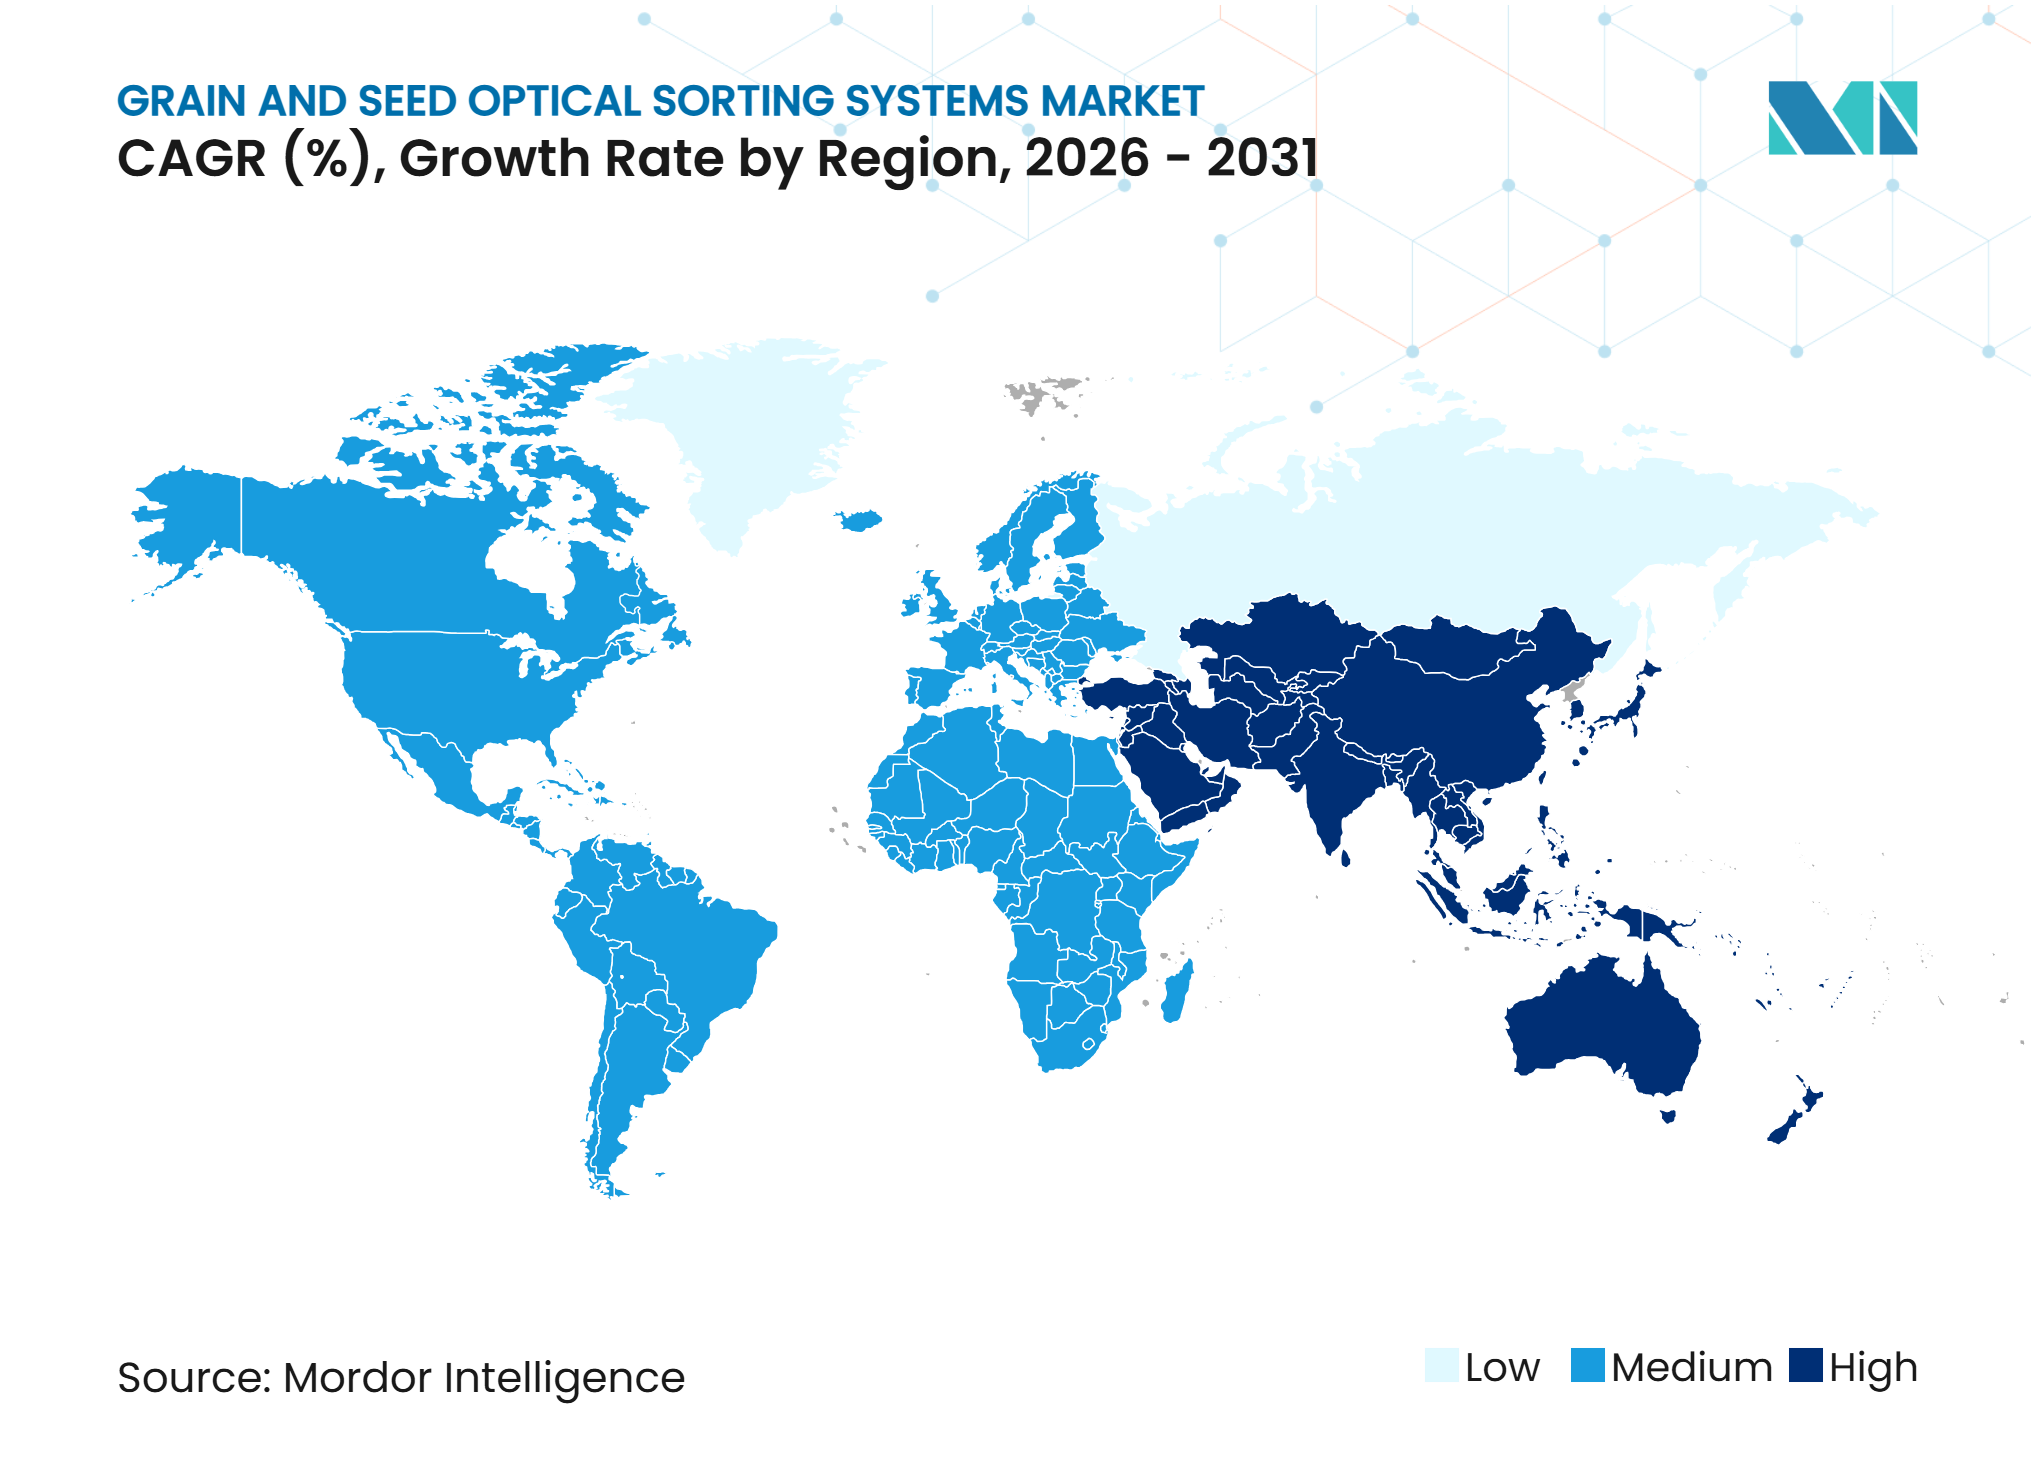
Asia-Pacific held 35.51% of the grain and seed optical sorting systems market share in 2025 and is projected to expand at a 12.28% CAGR through 2031. The region combines a dense base of rice mills with diverse grain-processing operations. China is a major source of demand because new standards require processors to assess whether installed systems meet defined equipment requirements. GB/T 46296-2025 became effective in May 2026 for multigrain color sorters. India drives demand through commercial milling of rice and wheat, while government support under the PM-FME scheme encourages food-processing modernization.
North America and Europe form a second major demand cluster for the grain and seed optical sorting systems market. Mature food safety rules support spending on reliable inspection systems. High labor costs further reinforce the case for automation in facilities that require consistent operating coverage. North American buyers value accessible technical support, testing, and operator training. Bühler and West-Link opened an optical sorting research and training center in Stockton, California, in March 2025.
South America is an emerging region, with Brazil and Argentina as major exporters of soybeans, corn, and wheat. Verifiable contaminant documentation matters for their access to premium export destinations. Bühler reported 2025 portfolio growth in optical sorting, especially in South America and Europe.[2] The Middle East and Africa are at an earlier stage of adoption because facilities face barriers to financing, infrastructure, and technical training.
Competitive Landscape
Market Concentration
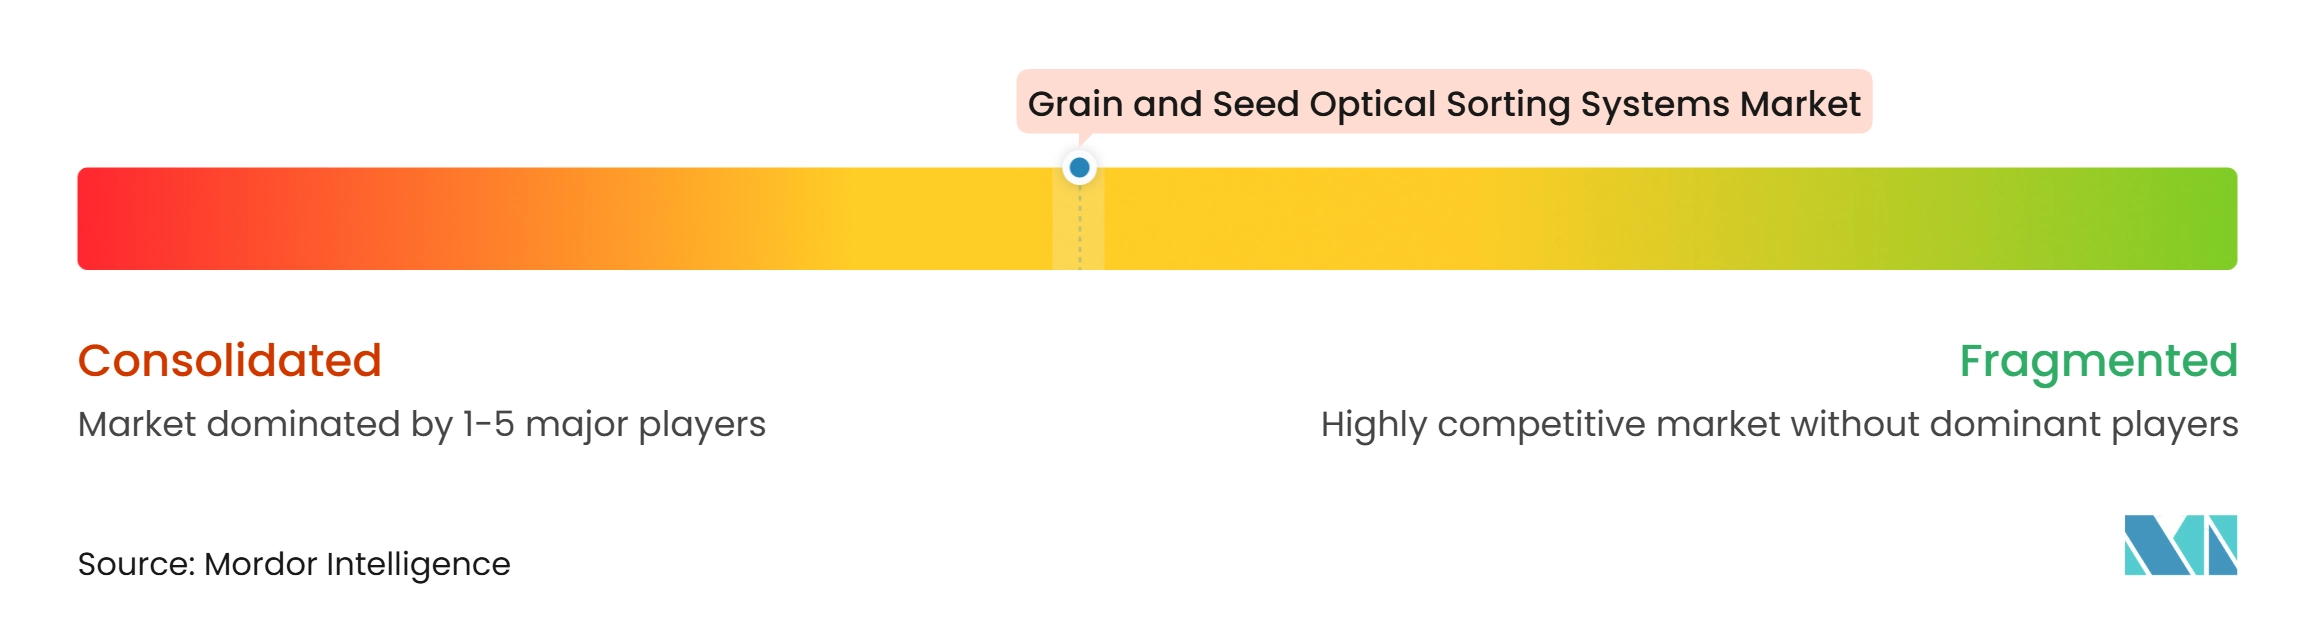
The grain and seed optical sorting systems market has a moderately concentrated premium tier. Bühler AG, TOMRA Systems ASA, and Satake Corporation compete in high-specification installations. European specialists include Cimbria, Key Technology, Sesotec, Raytec Vision, and Pellenc Selective Technologies. Chinese suppliers include Hefei Meyer Optoelectronic, Techik Instrument, Hefei Angelon, Hefei Baite, Anhui Zhongke, and Zhejiang Wanguan. The wider mid-tier remains fragmented, which gives buyers multiple equipment and service options.
Competition increasingly depends on AI-supported detection, software, and service capability. Hefei Meyer launched Meyer Master 4.0 in April 2025 with a multimodal AI engine and a swarm-intelligence collaboration network. TOMRA unveiled the TOMRA 4C at Interpack 2026, where the system ran multiple AI models through LUCAi deep learning. Bühler launched the SORTEX AI700 in May 2025 for advanced grain sorting applications. These moves place greater value on application expertise, training, and reliable processing results.
Satake expanded its mid-tier offering with the SLASH series in April 2026, which features a modular design and a compact footprint. Hefei Meyer topped out its 3rd Intelligent Factory in May 2026 to support quality-consistent output for international distribution.[3] CE marking, NRTL certification, and NR-12 certification create entry requirements across Europe, North America, and Brazil. Suppliers therefore compete through distribution reach, specific crop applications, and the ability to support complex equipment after installation.
Grain and Seed Optical Sorting Systems Industry Leaders
-
Bühler AG
-
TOMRA Systems ASA
-
Satake Corporation
-
Cimbria A/S
-
Key Technology, Inc
- *Disclaimer: Major Players sorted in no particular order
Grain and Seed Optical Sorting Systems Market Companies Covered in this Report
- Bühler AG
- TOMRA Systems ASA
- Satake Corporation
- Cimbria A/S
- Key Technology, Inc.
- Hefei Meyer Optoelectronic Technology Inc.
- Sesotec GmbH
- Binder+Co AG
- Techik Instrument Co., Ltd.
- Hefei Angelon Electronics Co., Ltd.
- Hefei Baite Optoelectronic Technology Co., Ltd.
- Raytec Vision S.p.A.
- Pellenc Selective Technologies SAS
- Steinert GmbH
- Körber AG
- Orange Sorting Machines Pvt. Ltd.
- Anzai Manufacturing Co., Ltd.
- Daewon GSI Co., Ltd.
- Anhui Zhongke Optic-electronic Color Sorter Machinery Co., Ltd.
- Zhejiang Wanguan Electric Co., Ltd.
Recent Industry Developments in Grain and Seed Optical Sorting Systems Market
- July 2026: USDA APHIS updated its Import Equipment Biosecurity Assessment Guide to classify AI-enabled optical grain sorting systems with physical isolation-based rejection as low-risk agricultural equipment, shortening the import approval cycle for such equipment into the US market.
- June 2026: Satake Corporation launched the SLASH β PLUS (Model: EMS-01B) globally from Hiroshima, a compact optical sorter for grains, seeds, beans, and plastics succeeding the widely recognized PikaSen α series, with automatic sensitivity setting and tool-free structure.
- May 2026: Bühler Group presented multiple new solutions and major upgrades to its Grains and Food portfolio at Interpack 2026 in Düsseldorf, incorporating AI, hygiene-design, and digital innovations across its sorting and milling lines.
- May 2026: Hefei Meyer Optoelectronic's 3rd Intelligent Factory capacity expansion was successfully topped out, enabling full-process intelligent and digital manufacturing aimed at scaling quality-consistent output for global distribution.
Global Grain and Seed Optical Sorting Systems Market Report Scope
The Grain and Seed Optical Sorting Systems Market comprises revenue generated from the sale, installation, integration, software, maintenance, and related services for automated optical sorting equipment used to inspect, classify, grade, and separate grains, seeds, and associated agricultural commodities. These systems use cameras, optical sensors, controlled lighting, image-processing software, and precision air-ejection or mechanical-rejection mechanisms to remove discolored, damaged, diseased, immature, off-type, contaminated, or foreign particles from product streams. Optical sorting can improve product purity and consistency by identifying defects that conventional screens, gravity separators, and mechanical graders may not reliably detect.
The Grain and Seed Optical Sorting Systems Market Report is Segmented by Product Type (Grain Optical Sorting Systems and Seed Optical Sorting Systems), Sorting Technology (RGB/Color Vision, NIR (Near-Infrared), Multispectral Imaging, Hyperspectral Imaging, and Other Sorting Technologies), Application (Pre-Cleaning and Incoming Quality Inspection, Final Product Purity Sorting, Seed Grading and Germination Quality Protection, Foreign Material and Contaminant Removal, and Other Applications), End User (Grain and Seed Processors, Milling Companies, Seed Processing Companies, Agricultural Cooperatives, Food and Ingredient Manufacturers, Traders and Grain Handlers, and Other Industrial Users), Capacity (Up to 2 Metric Tons per Hour, 2 to 5 Metric Tons per Hour, 5 to 10 Metric Tons per Hour, and Above 10 Metric Tons per Hour), and Geography (North America, South America, Europe, Asia-Pacific, and Middle East and Africa). The Market Forecasts are Provided in Terms of Value (USD).
Segmentation Overview
| Grain Optical Sorting Systems |
| Seed Optical Sorting Systems |
| RGB / Color Vision |
| NIR (Near-Infrared) |
| Multispectral Imaging |
| Hyperspectral Imaging |
| Other Sorting Technologies |
| Pre-Cleaning and Incoming Quality Inspection |
| Final Product Purity Sorting |
| Seed Grading and Germination Quality Protection |
| Foreign Material and Contaminant Removal |
| Other Applications |
| Grain and Seed Processors |
| Milling Companies |
| Seed Processing Companies |
| Agricultural Cooperatives |
| Food and Ingredient Manufacturers |
| Traders and Grain Handlers |
| Other Industrial Users |
| Up to 2 Metric Tons per Hour |
| 2 to 5 Metric Tons per Hour |
| 5 to 10 Metric Tons per Hour |
| Above 10 Metric Tons per Hour |
| North America | United States | |
| Canada | ||
| Mexico | ||
| South America | Brazil | |
| Argentina | ||
| Rest of South America | ||
| Europe | Germany | |
| United Kingdom | ||
| France | ||
| Italy | ||
| Spain | ||
| Rest of Europe | ||
| Asia-Pacific | China | |
| Japan | ||
| India | ||
| South Korea | ||
| ASEAN | ||
| Rest of Asia-Pacific | ||
| Middle East and Africa | Middle East | Saudi Arabia |
| Turkey | ||
| United Arab Emirates | ||
| Rest of the Middle East | ||
| Africa | South Africa | |
| Egypt | ||
| Rest of Africa | ||
| By Product Type | Grain Optical Sorting Systems | ||
| Seed Optical Sorting Systems | |||
| By Sorting Technology | RGB / Color Vision | ||
| NIR (Near-Infrared) | |||
| Multispectral Imaging | |||
| Hyperspectral Imaging | |||
| Other Sorting Technologies | |||
| By Application | Pre-Cleaning and Incoming Quality Inspection | ||
| Final Product Purity Sorting | |||
| Seed Grading and Germination Quality Protection | |||
| Foreign Material and Contaminant Removal | |||
| Other Applications | |||
| By End User | Grain and Seed Processors | ||
| Milling Companies | |||
| Seed Processing Companies | |||
| Agricultural Cooperatives | |||
| Food and Ingredient Manufacturers | |||
| Traders and Grain Handlers | |||
| Other Industrial Users | |||
| By Capacity | Up to 2 Metric Tons per Hour | ||
| 2 to 5 Metric Tons per Hour | |||
| 5 to 10 Metric Tons per Hour | |||
| Above 10 Metric Tons per Hour | |||
| By Geography | North America | United States | |
| Canada | |||
| Mexico | |||
| South America | Brazil | ||
| Argentina | |||
| Rest of South America | |||
| Europe | Germany | ||
| United Kingdom | |||
| France | |||
| Italy | |||
| Spain | |||
| Rest of Europe | |||
| Asia-Pacific | China | ||
| Japan | |||
| India | |||
| South Korea | |||
| ASEAN | |||
| Rest of Asia-Pacific | |||
| Middle East and Africa | Middle East | Saudi Arabia | |
| Turkey | |||
| United Arab Emirates | |||
| Rest of the Middle East | |||
| Africa | South Africa | ||
| Egypt | |||
| Rest of Africa | |||
Key Questions Answered in the Report
What is the size of the grain and seed optical sorting systems market?
The market was valued at USD 0.54 billion in 2025, is USD 0.59 billion in 2026, and is projected to reach USD 1.01 billion by 2031 at an 11.35% CAGR.
What is driving demand for grain and seed optical sorting systems?
Food safety requirements, labor shortages, automation of processing plants, and demand for traceable quality records support equipment adoption.
Which product category leads this sector?
Grain optical sorting systems led with a 27.77% share in 2025, reflecting their use across large rice, wheat, corn, and coarse-grain processing operations.
Which application is expected to expand fastest?
Seed grading and germination quality protection is projected to expand at a 12.31% CAGR through 2031 as certified seed programs increase quality requirements.
Which region leads demand for optical sorting equipment?
Asia-Pacific led with a 35.51% share in 2025 and is projected to expand at a 12.28% CAGR through 2031.
What limits adoption of advanced optical sorting systems?
High costs for hyperspectral systems, limited calibration skills, variable feed quality, and weak digital infrastructure can constrain adoption.