Market Overview
| Study Period | 2019 - 2031 |
|---|---|
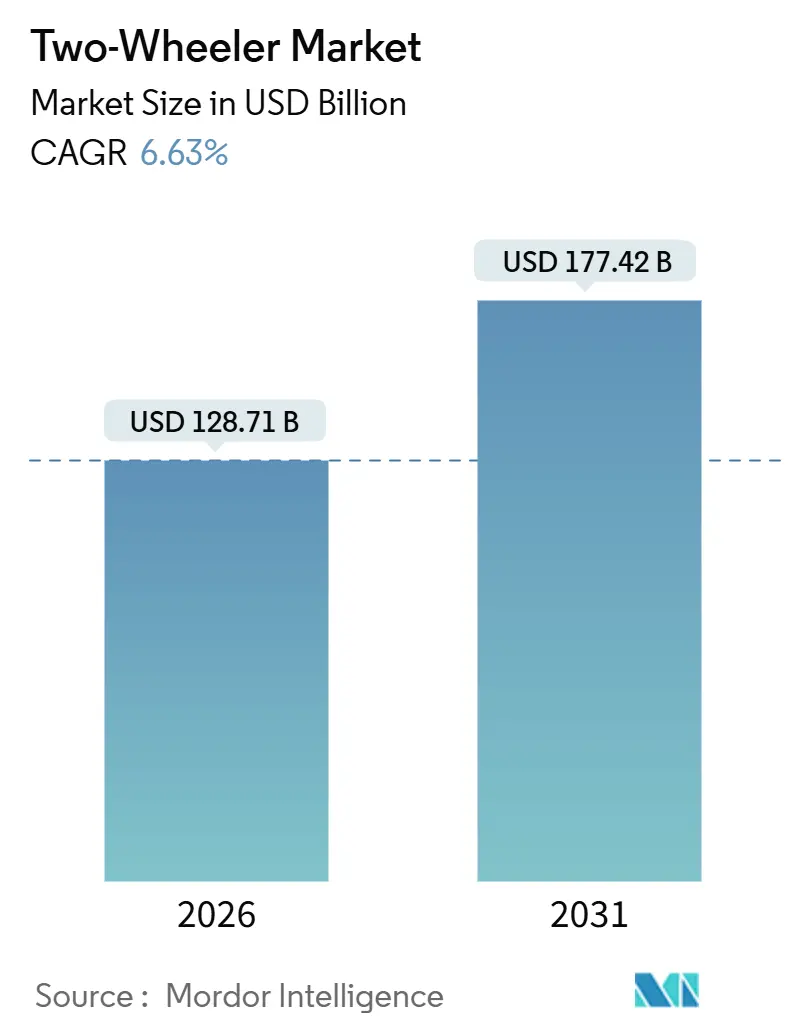
| Market Size (2026) | USD 128.71 Billion |
| Market Size (2031) | USD 177.42 Billion |
| Growth Rate (2026 - 2031) | 6.63% CAGR |
| Fastest Growing Market | Asia Pacific |
| Largest Market | Asia Pacific |
| Market Concentration | Medium |
Major Players*Disclaimer: Major Players sorted in no particular order Image © Mordor Intelligence. Reuse requires attribution under CC BY 4.0. | |
Two-Wheeler Market Analysis by Mordor Intelligence
The Two-Wheeler Market size is estimated at USD 128.71 billion in 2026, and is expected to reach USD 177.42 billion by 2031, at a CAGR of 6.63% during the forecast period (2026-2031). Urban congestion charges, parking scarcity, and increasing last-mile delivery volumes are redirecting commuters and fleet operators toward compact vehicles that reduce both ownership costs and travel time. Asia Pacific retains leadership through cost-competitive manufacturing, supportive local-content rules, and rapid electrification, while Europe pushes technology upgrades through stringent Euro 5 norms. Ongoing battery chemistry innovation is compressing pack costs, narrowing the price gap between electric and gasoline variants, and expanding the addressable base of first-time purchasers. Competitive rivalry is intense because no single brand controls more than a single-digit volume in every central region, encouraging continuous product refreshes, modular platform sharing, and strategic localization of supply chains.
Key Report Takeaways
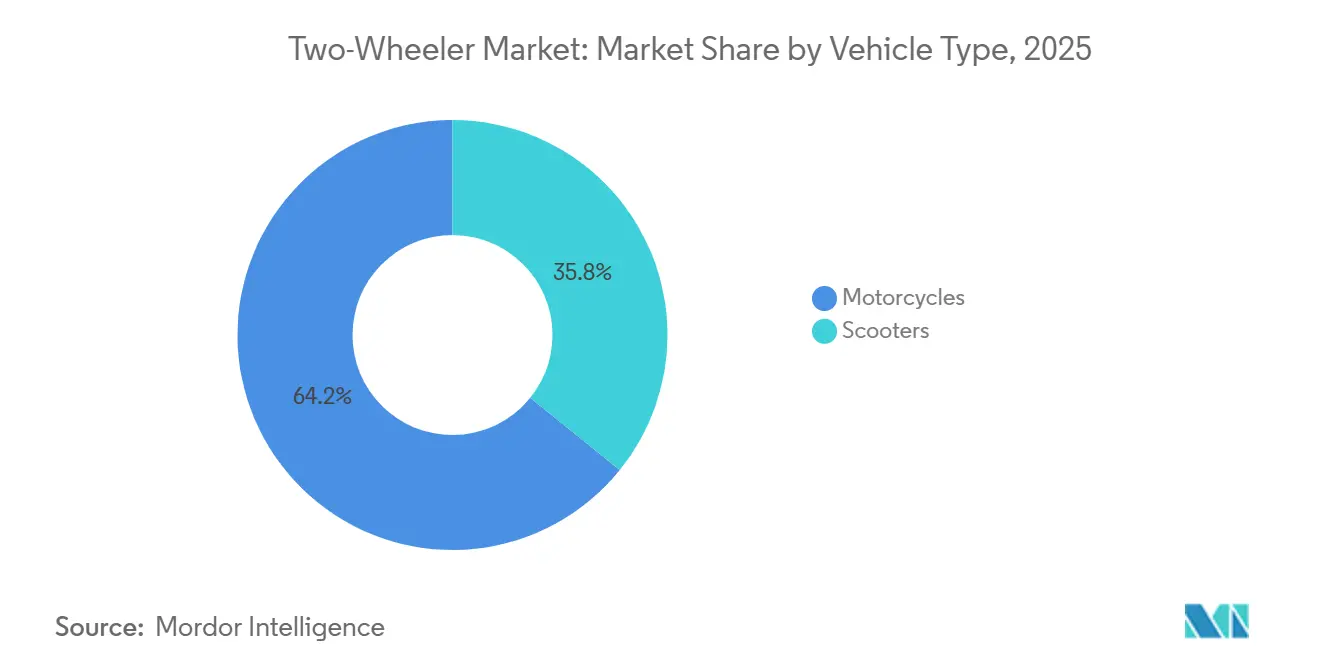
- By vehicle type, motorcycles captured 64.16% of the two-wheeler market share in 2025, while scooters are advancing at a 6.66% CAGR through 2031.
- By propulsion, internal combustion engines dominated 73.47% of the global fleet in 2025, yet battery electric models are rising at a 6.73% CAGR to 2031.
- By engine capacity, motorcycles below 110 cc commanded 46.51% of volume in 2025; the 126–150 cc bracket is projected to grow at a 6.75% CAGR through 2031.
- By price band, the sub-USD 1,000 tier accounted for 53.36% of 2025 sales; models priced above USD 5,000 are forecast to advance at a 6.79% CAGR to 2031.
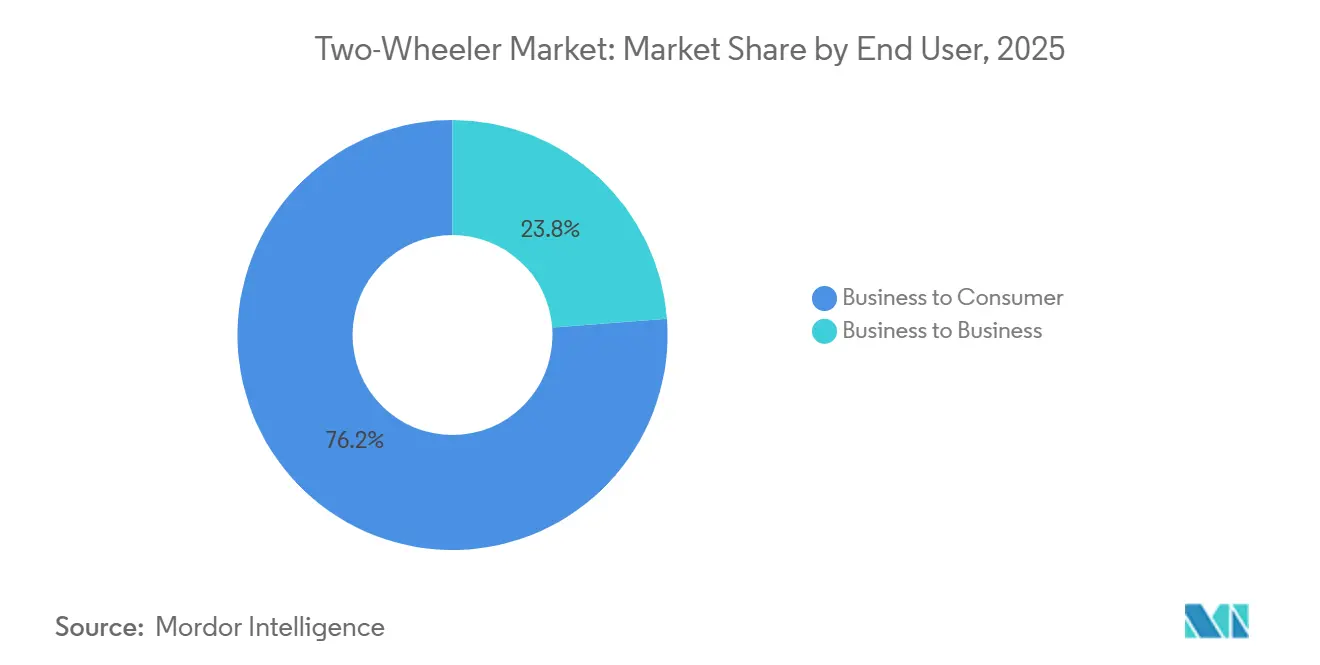
- By end user, business-to-consumer purchases represented 76.16% of volume in 2025; business-to-business channels are expected to expand at a 6.69% CAGR through 2031.
- By sales channel, offline dealerships managed 83.27% of transactions in 2025; online direct-to-consumer sales are set to rise at a 6.77% CAGR to 2031.
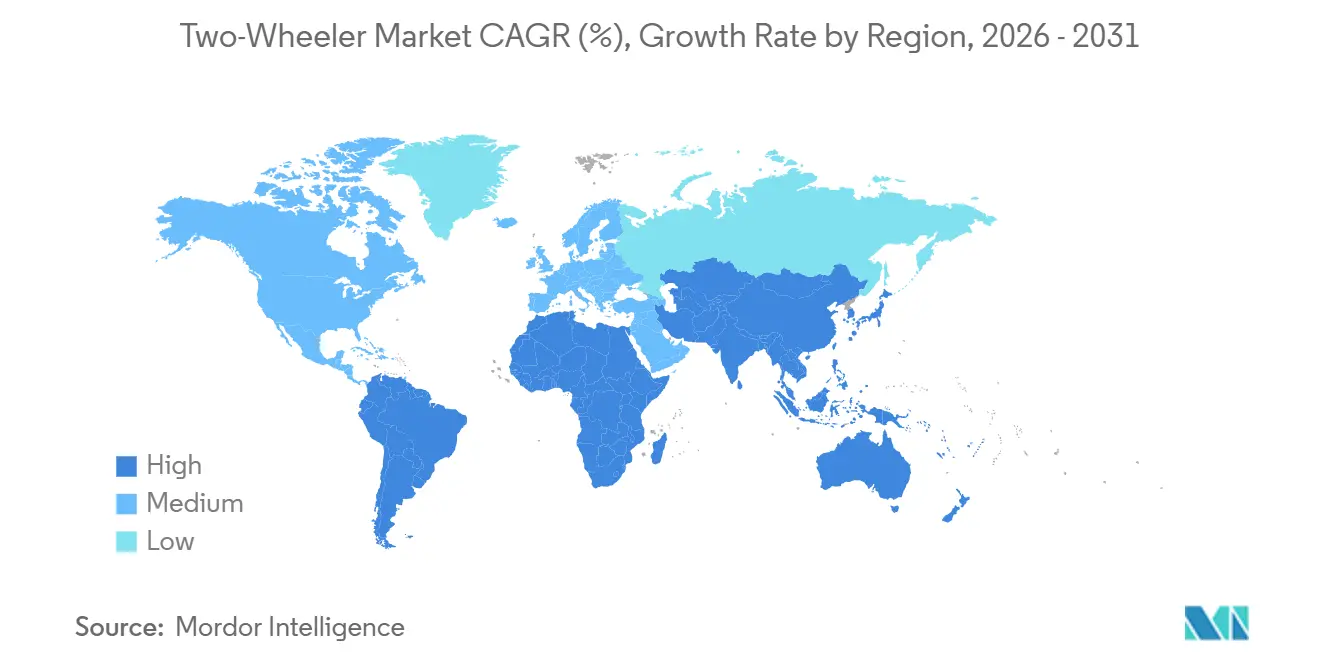
- By geography, Asia Pacific led with 38.16% market value in 2025; the region is also anticipated to post the quickest regional growth at a 6.71% CAGR to 2031
Note: Market size and forecast figures in this report are generated using Mordor Intelligence’s proprietary estimation framework, updated with the latest available data and insights as of January 2026.
Global Two-Wheeler Market Trends and Insights
Drivers Impact Analysis
| Driver | (~) % Impact on CAGR Forecast | Geographic Relevance | Impact Timeline |
|---|---|---|---|
| Falling Battery & Sodium-Ion Costs Accelerate E-2W Adoption | +1.5% | Asia Pacific core (China, India, Indonesia), spill-over to Europe | Short term (≤2 years) |
| Growth of Gig-Economy Delivery Fleets | +1.3% | Asia Pacific, Latin America urban corridors, selective North America metros | Short term (≤2 years) |
| Rapid Urban Congestion & Shift to Two-Wheelers | +1.2% | Global, peak intensity in Asia Pacific megacities, secondary effects in Latin America | Medium term (2-4 years) |
| OEM Pivot to Mid-Premium 125-150 CC & 3-5 kW Models | +0.9% | Asia Pacific, Europe, North America niche segments | Medium term (2-4 years) |
| ASEAN Localisation Mandates | +0.7% | ASEAN core (Indonesia, Thailand, Vietnam, Philippines), spill-over to South Asia | Medium term (2-4 years) |
| Embedded Connectivity & OTA Upgrades Monetisation | +0.5% | Global, led by Asia Pacific and Europe, emerging in North America | Short term (≤2 years) |
| Source: Mordor Intelligence | |||
Understand The Key Trends Shaping This Market
Download PDF
Falling Battery & Sodium-Ion Costs Accelerate E-2W Adoption
In recent years, sodium-ion cells achieved a significant milestone in commercial production with improved energy density, leading to a substantial reduction in costs. This price drop makes sodium-ion cells notably more affordable compared to lithium iron phosphate. The reduction in costs addresses the purchase-premium challenge, which previously limited many electric models to regions reliant on subsidies. Chinese manufacturers introduced highly affordable scooters, and when factoring in fuel savings, the payback period became considerably shorter. The International Energy Agency anticipates further cost reductions in the near future, driven by advancements in cathode chemistries that are becoming more manganese-focused, which will further enhance cost efficiency [1]“Global EV Outlook 2025,” International Energy Agency, iea.org . Additionally, sodium-ion's improved thermal stability alleviates fire-safety concerns, aligning with the certification standards that are increasingly being adopted across Europe and North America.
Growth of Gig-Economy Delivery Fleets
Food-delivery and parcel platforms are scaling electric two-wheeler fleets to shrink per-mile expenses and comply with zero-emission zones. Indian operators run hundreds of thousands of battery-swap-enabled scooters that refill in under two minutes, filing telematics data that proves lower energy cost versus gasoline units at urban mileages. Brazilian fleets adopted similar models, demonstrating monthly fuel savings of USD 150 per rider and attracting investor backing for domestic assembly plants. Southeast Asian ride-hailers use swap stations to maximize driver income by lifting daily utilization above 300 km, strengthening the business case for fleet electrification. The resulting demand shields the segment from retail-buyer subsidy fluctuations and locks in high replacement cycles every two to three years.
Rapid Urban Congestion & Shift to Two-Wheelers
Regulated access to central business districts is intensifying across Jakarta, São Paulo, Mumbai, and Mexico City, where four-wheelers face alternating license-plate schemes or per-entry tolls that do not apply to two-wheelers. Parking rates topping USD 200 per month in many Asian and Latin American capitals add further incentive for commuters to choose compact vehicles over cars. Policy incentives are funneling first-time buyers toward 110 cc commuters and 1.5 kW electric scooters that cost less than half of entry-level hatchbacks. OEMs are able to supply modular frames because the localization of plastics, wheels, and wiring harnesses meets ASEAN rules that require 40% domestic content. The cumulative effect increases two-wheeler penetration as city planners seek quick congestion relief [2]“Urban Transport Sector Update 2025,” World Bank, worldbank.org .
OEM Pivot to Mid-Premium 125-150 CC & 3-5 kW Models
Manufacturers have shifted development funds away from sub-100 cc lines toward 125–150 cc motorcycles and 3–5 kW scooters that command higher gross margins. In India, the launch of new 125 cc models captured nearly one-fifth of the segment within a single year, due to their performance, branding, and youthful styling. Hybrid formats that combine small gasoline engines with 48-V assist systems offer improved fuel economy and position brands for future Euro 6 requirements. Electric equivalents in the 4–5 kW band match city acceleration targets of sports commuters, reinforcing the segment pivot. European demand exhibits a parallel trend, as premium scooters outsell older gasoline-powered designs, confirming a global appetite for mid-premium products.
Restraints Impact Analysis
| Restraint | (~) % Impact on CAGR Forecast | Geographic Relevance | Impact Timeline |
|---|---|---|---|
| Subsidy Roll-Backs in China & India | -0.8% | China, India, selective Southeast Asia markets | Short term (≤2 years) |
| Supply-Chain Volatility in Critical Battery Minerals | -0.6% | Global, acute in regions dependent on single-source lithium or cobalt | Medium term (2-4 years) |
| High Rider-Fatality Perception Curbs Premium Uptake | -0.4% | Global, acute in emerging markets with weak helmet enforcement and road infrastructure | Medium term (2-4 years) |
| Dealer-Network Decline in Rural Africa Limits Access | -0.3% | Sub-Saharan Africa, concentrated in Nigeria, Kenya, Tanzania rural corridors | Long term (≥4 years) |
| Source: Mordor Intelligence | |||
Subsidy Roll-Backs in China & India Post-2025
China ended its national electric two-wheeler incentive in late 2025, and India trimmed support under FAME-III, removing up to USD 60 per unit from entry-level retail prices. These reductions exposed the sector’s reliance on fiscal support, particularly below USD 1,000, where margins are thin. Leading electric brands absorbed part of the delta to protect market share, but unit volumes slid during the immediate months that followed. Sales recovered gradually in cities with robust battery-swap networks, yet smaller manufacturers lacking financial buffers saw dealer stock stretch to ninety days, straining working capital. Regional programs in Indonesia and Vietnam still ease adoption, though policymakers signal eventual tapering once domestic supply chains mature.
Supply-Chain Volatility in Critical Battery Minerals
Lithium carbonate spot quotes doubled between 2024 and 2025 before retreating, while cobalt supply fluctuates due to artisanal mining curbs in the Democratic Republic of Congo. Nickel prices spiked following Indonesia’s ore-export restrictions, encouraging a pivot toward chemistries that omit cobalt and nickel. Pack costs account for up to two-fifths of electric two-wheeler bills of materials, so raw-material swings translate almost directly into retail pricing pressure. Major OEMs have begun signing multi-year sourcing deals with Australian and Canadian miners, but smaller brands remain exposed to commodity cycles that can compress gross margins during price spikes. Diversification into sodium-ion and lithium iron phosphate is a strategic hedge now baked into most product roadmaps.
Segment Analysis
By Vehicle Type: Scooters Gain on Automatic Convenience
Scooters accounted for 35.84% of global shipments in 2025 and are predicted to climb steadily with a 6.66% CAGR through 2031. Automatic transmissions, step-through frames, and under-seat storage make scooters attractive to daily commuters navigating stop-and-go traffic. Motorcycles still command a large volume due to entrenched commuter habits in India and Indonesia, yet their relative share is tapering in dense cities where parking slots shrink every year. Electric scooter rollouts that feature swappable batteries and smartphone integration further tilt preference toward this layout. In Europe, maxi-scooters offer weather protection and cargo space, reinforcing adoption in year-round commuting climates.
Scooters benefit from simpler licensing in several ASEAN nations, allowing younger riders to enter earlier, while insurers price premiums lower than for performance motorcycles. The two-wheeler market frequently sees first-time buyers graduate from bicycles directly to 125 cc scooters rather than motorcycles, compressing purchase cycles. OEMs respond with shared platforms that lower tooling costs and speed variant launches. Fleet operators also favor scooters because top-box mounting is straightforward for delivery use. This momentum suggests the scooter sub-segment will keep outpacing the broader two-wheeler market and increase its revenue contribution beyond 38% by 2031.
Get Detailed Market Forecasts at the Most Granular Levels
Download PDF
By Propulsion: Battery Electric Surges Despite ICE Dominance
Internal combustion products represented 73.47% of the global fleet in 2025, yet electric models are on a faster 6.73% CAGR trajectory through 2031. Declining pack prices and dense charging or swap networks in China and India have narrowed the total cost of ownership gaps. Euro 5 rules added USD 200–300 to gasoline motorcycle prices, shrinking the upfront differential in Europe. Range anxiety lingers outside urban cores, so gasoline engines retain popularity for touring and rural use. Hybrid scooters remain niche because added components raise weight without proportionate cost savings on short commutes.
Electric market penetration improves every quarter as manufacturers introduce 3–5 kW models capable of highway speeds. Government tenders for postal and municipal fleets specify zero-emission requirements that tilt awards toward electric bidders. The two-wheeler market size for battery electric variants could surpass USD 60 billion by 2031 if current policy trajectories hold. Safety standards such as ISO 13063 and advanced thermal management reduce concerns over battery-related fires, further supporting adoption among risk-averse buyers. This multifaceted progress underscores a structural shift even while gasoline engines remain dominant in absolute numbers.
By Engine Capacity: Mid-Displacement Gains Traction
The 126–150 cc category posted the highest forecast growth at 6.75% CAGR, reflecting riders who want highway-legal speeds without the cost and insurance burden of large engines. Entry-level commuters below 110 cc retain volume leadership with 46.51%, especially in price-sensitive rural segments, yet their share is inching down as disposable incomes rise. Latin American markets prefer 150–200 cc flex-fuel models that can run on ethanol blends, a competitive edge against rising gasoline prices. Premium engines above 350 cc sell mainly in North America and Europe, targeting enthusiasts and lifestyle riders. Electric drivetrains expressed in 3–5 kW ratings give comparable torque to 150 cc gasoline units, accelerating cross-over interest.
Mid-displacement motorcycles often come with modern safety aids like dual-channel ABS and smartphone connectivity, raising perceived value. Leasing and subscription programs bundle insurance and service for this bracket, easing the upgrade decision. Component suppliers are localizing cast-aluminum swing arms and LED lighting to keep prices competitive. The two-wheeler market size associated with the 126–150 cc tier is expected to widen as emerging middle classes seek versatile commuting options that also serve weekend recreation. OEMs able to flex between gasoline and electric offerings in this range stand to capture incremental share.
By Price Band: Premium Segment Accelerates
Units priced above USD 5,000 grew at a 6.79% CAGR and formed the fastest-expanding value pool in 2025–2031. Affluent urban riders in North America, Europe, and Tier-1 Asian cities gravitate toward differentiated styling, traction control, and connected dashboards that come standard in premium models. Volume remains concentrated under USD 1,000 and is composed mostly of Chinese electric scooters designed for mass-market affordability, with 53.36% market share in 2025. The mid-range USD 1,001–1,500 slot is fiercely contested in India, where LED headlamps and TFT clusters have become must-have features. Southeast Asian consumers stretch budgets into the USD 2,001–3,000 band for sport-naked motorcycles that carry aspirational branding.
The premium slice benefits from limited price sensitivity, allowing OEMs to offset R&D outlays on electrification. Licensing rules like Europe’s A2 category cap displacement yet allow premium electric motorcycles, creating an opening for high-margin offerings. Dealer financing packages extend terms up to seven years for high-end units, reducing monthly payment gaps relative to small cars. As battery costs fall, more electric entries will populate the USD 3,000–5,000 corridor, closing the chasm between value and premium. This convergence will accentuate the bifurcation already visible within the two-wheeler market.
By End User: B2B Fleets Drive Electrification
Business-to-business demand expanded at a 6.69% CAGR, faster than household purchases. Delivery networks favor electric two-wheelers because they lower per-kilometer energy spend by over half and minimize downtime through battery swapping. Bike-taxi services test similar models to keep vehicles on the road for twelve hours daily, lifting driver income. Corporate field-service fleets remain early in adoption cycles but show interest as telematics integrates maintenance forecasting. The consumer channel still generated 76.16% of units in 2025, underpinned by favorable financing and a cultural affinity for personal ownership in South Asia.
Fleet buyers negotiate bulk prices and service contracts that stabilize residual values, an attraction for manufacturers hoping to build scale quickly. Battery-swap operators monetize energy subscriptions, turning propulsion into a recurring revenue stream. Insurance underwriters offer discounted rates when telematics proves safe riding behavior, further tilting economics in favor of fleet electrification. The two-wheeler market, therefore, sees B2B influences ripple into specification sheets and after-sales arrangements that were traditionally retail-oriented. Suppliers able to integrate fleet-grade telematics and fast-swap compatibility are well placed for the next growth phase.
Get Detailed Market Forecasts at the Most Granular Levels
Download PDF
By Sales Channel: Online Direct-to-Consumer Models Emerge
Online transactions recorded a 6.77% CAGR to 2031, reflecting consumer comfort with e-commerce and transparent pricing. Pioneering brands handle the entire purchase journey on mobile apps, from configuration to doorstep delivery, cutting physical inventory costs. Hybrid models combine flagship experience centers with online contracting to satisfy test-ride expectations while preserving pricing clarity. Legacy OEMs respond with omnichannel portals that allow financing pre-approvals before handover at a local dealer, easing the transition for traditional networks. Offline showrooms still processed 83.27% of transactions in 2025, bolstered by established service infrastructure and trade-in facilitation.
Direct digital engagement improves customer data capture, enabling personalized maintenance reminders and accessory upselling. Financing partners integrate APIs that allow instant credit decisions, shortening purchase cycles. Rural connectivity gaps and consumer habits keep pure-online share modest outside Tier-1 cities, yet momentum is unmistakable. The two-wheeler industry is therefore adjusting supply-chain planning, with some plants shipping units directly to end customers instead of central warehouses. Over time, margin structures will shift as online sales reduce dealer commissions and encourage price competition.
Geography Analysis
Asia Pacific generated 38.16% of global value in 2025 and is projected to grow at a 6.71% CAGR to 2031. China rolls out a significant number of electric vehicles, with new sodium-ion launches boosting demand even after subsidies ended. In India, the gig-delivery sector has introduced a substantial fleet of electric scooters, with individual riders quickly adopting them due to plentiful charging options. Indonesia mandates a considerable percentage of domestic sourcing by the latter part of the decade, prompting assembly plant expansions from Honda, Yamaha, and local player Gesits. Japan grapples with an aging population impacting domestic sales, yet its manufacturers enjoy robust export revenues, especially in the premium middleweight segment.
Europe, adhering to strict Euro 5 norms set for the current year, nudges manufacturers towards costly emission-control solutions or a pivot to full electrification. Germany, the UK, Italy, France, and Spain dominate, making up a significant portion of Europe's sales. Recently, Germany witnessed premium electric scooters outselling their gasoline counterparts, underscoring how stringent regulations can shift market dynamics, even at premium price points. Ahead of the upcoming Euro 6 regulations, Italy's hybrid three-wheelers are already compliant. Meanwhile, London's zero-emission zones spur Triumph to introduce a new battery platform, targeting a commercial debut later in the decade. As compliance costs escalate, smaller European manufacturers find themselves under consolidation pressure.
North America sees electric vehicles making up a small fraction of registrations, yet there's a consistent rise in recreational and adventure segments. Urban professionals are increasingly drawn to electric options, valuing performance without the noise of traditional exhausts. While Canada aligns with U.S. trends, its colder climate limits electric vehicle usage throughout the year. South America, spearheaded by Brazil, is witnessing a quicker adoption. Here, flex-fuel technology thrives, due to a ready supply of ethanol, and strategic partnerships are integrating a significant number of electric motorcycles into commercial fleets. The Middle East and Africa present contrasting scenarios: Saudi Arabia's infrastructure initiatives bolster electric vehicles for last-mile deliveries, but rural Africa faces challenges. With dealership contractions and financing hurdles, the region sees a slowdown in electric vehicle adoption, despite its favorable demographics.
Get Analysis on Important Geographic Markets
Download PDF
Competitive Landscape
In the mid-term, the top manufacturers held a significant share of the global market volume, leaving ample opportunity for regional specialists and emerging electric players. Chinese firms, benefiting from vertical integration, intensified price wars, particularly in the lower price segment, to outpace competitors. Meanwhile, Indian brands fortified their market position through extensive service networks and strategic financing ties. While legacy OEMs are prolonging the life of internal combustion engines by adopting mild-hybrid systems, startups focused solely on electric vehicles are banking on over-the-air software updates and battery-swapping systems, ensuring a steady revenue stream.
During this period, patent filings for technologies related to battery thermal management and swappable packs saw a notable increase, underscoring the importance of technology as a competitive edge. Firms securing long-term contracts for raw material supplies bolster their defenses against market volatility. The rise of direct-to-consumer sales is squeezing dealer profit margins, leading to a wave of consolidation among smaller retail chains. As fleets become a focal point, product designs are evolving, with an emphasis on modular batteries and robust chassis—features that were once sidelined in retail models. Over the coming years, brands lacking sufficient capital might face exits or mergers, especially in scenarios where electrification demands clash with financial constraints.
Premium OEMs are setting themselves apart from mass-market competitors by standardizing features like adaptive cruise control, cornering ABS, and smartphone connectivity. In urban areas equipped with battery swap infrastructure, subscription models bundling vehicles, insurance, and energy are gaining traction, shifting the revenue landscape towards services. The two-wheeler market is thus favoring manufacturers who demonstrate agility in propulsion strategies, localizing their supply chains, and engaging digitally, positioning them for significant gains as both regulatory and consumer trends align.
Two-Wheeler Industry Leaders
Bajaj Auto Ltd.
Hero MotoCorp Ltd.
Honda Motor Co. Ltd.
TVS Motor Company Limited
Yamaha Motor Company Limited
- *Disclaimer: Major Players sorted in no particular order
Need More Details on Market Players and Competitors?
Download PDF
Recent Industry Developments
- January 2026: Ultraviolette secured USD 45 million to scale production of its F77 electric motorcycle, bringing strategic investors from software and automotive backgrounds.
- November 2025: Bajaj Auto completed an EUR 800 million purchase of Pierer Mobility AG, gaining full control of KTM and expanding into the global premium segment.
Global Two-Wheeler Market Report Scope
The scope of the report includes Vehicle Type (Motorcycles and Scooters), Propulsion (ICE and Battery Electric), Engine Capacity (ICE and Electric), Price Band (Less Than or Equal To USD 1,000 and More), End-User (B2C and B2B), Sales Channel (Online and Offline), and Geography.
By Vehicle Type
| Motorcycles |
| Scooters |
By Propulsion
| Internal Combustion Engines |
| Battery Electric |
By Engine Capacity
| Internal Combustion Engines | Less than or equal to 110 cc |
| 111–125 cc | |
| 126–150 cc | |
| 151–200 cc | |
| 201–250 cc | |
| 250–350 cc | |
| 350–500 cc | |
| More than 500 cc | |
| Battery Electric | Less than or equal to 1.0 kW |
| 1.1–3.0 kW | |
| 3.1–5.0 kW | |
| More than 5.0 kW |
By Price Band
| Less than or equal to USD 1 000 |
| USD 1 001–1 500 |
| USD 1 501–2 000 |
| USD 2 001–3 000 |
| USD 3 001–5 000 |
| More than USD 5 000 |
By End-User
| Business to Consumer | |
| Business to Business | Ride-hail / Bike-Taxi / Rental / Tourism |
| Delivery & Logistics | |
| Corporate & SME Fleets | |
| Others (Govt & Institutional, NGO Programs) |
By Sales Channel
| Online |
| Offline |
By Region
| North America | United States |
| Canada | |
| Rest of North America | |
| South America | Brazil |
| Argentina | |
| Rest of South America | |
| Europe | Germany |
| United Kingdom | |
| Italy | |
| Spain | |
| France | |
| Rest of Europe | |
| Asia Pacific | China |
| Japan | |
| India | |
| South Korea | |
| Rest of Asia Pacific | |
| Middle East & Africa | Saudi Arabia |
| Qatar | |
| Israel | |
| South Africa | |
| Rest of Middle East & Africa |
| By Vehicle Type | Motorcycles | |
| Scooters | ||
| By Propulsion | Internal Combustion Engines | |
| Battery Electric | ||
| By Engine Capacity | Internal Combustion Engines | Less than or equal to 110 cc |
| 111–125 cc | ||
| 126–150 cc | ||
| 151–200 cc | ||
| 201–250 cc | ||
| 250–350 cc | ||
| 350–500 cc | ||
| More than 500 cc | ||
| Battery Electric | Less than or equal to 1.0 kW | |
| 1.1–3.0 kW | ||
| 3.1–5.0 kW | ||
| More than 5.0 kW | ||
| By Price Band | Less than or equal to USD 1 000 | |
| USD 1 001–1 500 | ||
| USD 1 501–2 000 | ||
| USD 2 001–3 000 | ||
| USD 3 001–5 000 | ||
| More than USD 5 000 | ||
| By End-User | Business to Consumer | |
| Business to Business | Ride-hail / Bike-Taxi / Rental / Tourism | |
| Delivery & Logistics | ||
| Corporate & SME Fleets | ||
| Others (Govt & Institutional, NGO Programs) | ||
| By Sales Channel | Online | |
| Offline | ||
| By Region | North America | United States |
| Canada | ||
| Rest of North America | ||
| South America | Brazil | |
| Argentina | ||
| Rest of South America | ||
| Europe | Germany | |
| United Kingdom | ||
| Italy | ||
| Spain | ||
| France | ||
| Rest of Europe | ||
| Asia Pacific | China | |
| Japan | ||
| India | ||
| South Korea | ||
| Rest of Asia Pacific | ||
| Middle East & Africa | Saudi Arabia | |
| Qatar | ||
| Israel | ||
| South Africa | ||
| Rest of Middle East & Africa | ||
Need A Different Region or Segment?
Customize Now
Market Definition
- Vehicle Type - The category covers motorized two-wheelers.
- Vehicle Body Type - This includes Scooters and Motorcycles, while Kick-scooters and Bicycles are excluded.
- Fuel Category - Coverage extends to vehicles powered by Internal Combustion Engines (ICE) and electric propulsion systems.
| Keyword | Definition |
|---|---|
| Electric Vehicle (EV) | A vehicle which uses one or more electric motors for propulsion. Includes cars, buses, and trucks. This term includes all-electric vehicles or battery electric vehicles and plug-in hybrid electric vehicles. |
| BEV | A BEV relies completely on a battery and a motor for propulsion. The battery in the vehicle must be charged by plugging it into an outlet or public charging station. BEVs do not have an ICE and hence are pollution-free. They have a low cost of operation and reduced engine noise as compared to conventional fuel engines. However, they have a shorter range and higher prices than their equivalent gasoline models. |
| PEV | A plug-in electric vehicle is an electric vehicle that can be externally charged and generally includes all-electric vehicles as well as plug-in hybrids. |
| Plug-in Hybrid EV | A vehicle that can be powered either by an ICE or an electric motor. In contrast to normal hybrid EVs, they can be charged externally. |
| Internal combustion engine | An engine in which the burning of fuels occurs in a confined space called a combustion chamber. Usually run with gasoline/petrol or diesel. |
| Hybrid EV | A vehicle powered by an ICE in combination with one or more electric motors that use energy stored in batteries. These are continually recharged with power from the ICE and regenerative braking. |
| Commercial Vehicles | Commercial vehicles are motorized road vehicles designed for transporting people or goods. The category includes light commercial vehicles (LCVs) and medium and heavy-duty vehicles (M&HCV). |
| Passenger Vehicles | Passenger cars are electric motor– or engine-driven vehicles with at least four wheels. These vehicles are used for the transport of passengers and comprise no more than eight seats in addition to the driver’s seat. |
| Light Commercial Vehicles | Commercial vehicles that weigh less than 6,000 lb (Class 1) and in the range of 6,001–10,000 lb (Class 2) are covered under this category. |
| M&HDT | Commercial vehicles that weigh in the range of 10,001–14,000 lb (Class 3), 14,001–16,000 lb (Class 4), 16,001–19,500 lb (Class 5), 19,501–26,000 lb (Class 6), 26,001–33,000 lb (Class 7) and above 33,001 lb (Class 8) are covered under this category. |
| Bus | A mode of transportation that typically refers to a large vehicle designed to carry passengers over long distances. This includes transit bus, school bus, shuttle bus, and trolleybuses. |
| Diesel | It includes vehicles that use diesel as their primary fuel. A diesel engine vehicle have a compression-ignited injection system rather than the spark-ignited system used by most gasoline vehicles. In such vehicles, fuel is injected into the combustion chamber and ignited by the high temperature achieved when gas is greatly compressed. |
| Gasoline | It includes vehicles that use gas/petrol as their primary fuel. A gasoline car typically uses a spark-ignited internal combustion engine. In such vehicles, fuel is injected into either the intake manifold or the combustion chamber, where it is combined with air, and the air/fuel mixture is ignited by the spark from a spark plug. |
| LPG | It includes vehicles that use LPG as their primary fuel. Both dedicated and bi-fuel LPG vehicles are considered under the scope of the study. |
| CNG | It includes vehicles that use CNG as their primary fuel. These are vehicles that operate like gasoline-powered vehicles with spark-ignited internal combustion engines. |
| HEV | All the electric vehicles that use batteries and an internal combustion engine (ICE) as their primary source for propulsion are considered under this category. HEVs generally use a diesel-electric powertrain and are also known as hybrid diesel-electric vehicles. An HEV converts the vehicle momentum (kinetic energy) into electricity that recharges the battery when the vehicle slows down or stops. The battery of HEV cannot be charged using plug-in devices. |
| PHEV | PHEVs are powered by a battery as well as an ICE. The battery can be charged through either regenerative breaking using the ICE or by plugging into some external charging source. PHEVs have a better range than BEVs but are comparatively less eco-friendly. |
| Hatchback | These are compact-sized cars with a hatch-type door provided at the rear end. |
| Sedan | These are usually two- or four-door passenger cars, with a separate area provided at the rear end for luggage. |
| SUV | Popularly known as SUVs, these cars come with four-wheel drive, and usually have high ground clearance. These cars can also be used as off-road vehicles. |
| MPV | These are multi-purpose vehicles (also called minivans) designed to carry a larger number of passengers. They carry between five and seven people and have room for luggage too. They are usually taller than the average family saloon car, to provide greater headroom and ease of access, and they are usually front-wheel drive. |
Need More Details on Market Definition?
Ask a Question
Research Methodology
Mordor Intelligence follows a four-step methodology in all its reports.
- Step-1: Identify Key Variables: To build a robust forecasting methodology, the variables and factors identified in Step-1 are tested against available historical market numbers. Through an iterative process, the variables required for market forecast are set and the model is built based on these variables.
- Step-2: Build a Market Model: Market-size estimations for the historical and forecast years have been provided in revenue and volume terms. Market revenue is calculated by multiplying the sales volume with their respective average selling price (ASP). While estimating ASP factors like average inflation, market demand shift, manufacturing cost, technological advancement, and varying consumer preference, among others have been taken into account.
- Step-3: Validate and Finalize: In this important step, all market numbers, variables, and analyst calls are validated through an extensive network of primary research experts from the market studied. The respondents are selected across levels and functions to generate a holistic picture of the market studied.
- Step-4: Research Outputs: Syndicated Reports, Custom Consulting Assignments, Databases & Subscription Platforms.

Get More Details On Research Methodology
Download PDF


