
E-commerce Last-mile Delivery Market Size and Share
Market Overview
| Study Period | 2020 - 2031 |
|---|---|
| Market Size (2026) | USD 231.61 Billion |
| Market Size (2031) | USD 387.69 Billion |
| Growth Rate (2026 - 2031) | 10.85 % |
| Fastest Growing Market | Asia-Pacific |
| Largest Market | Asia-Pacific |
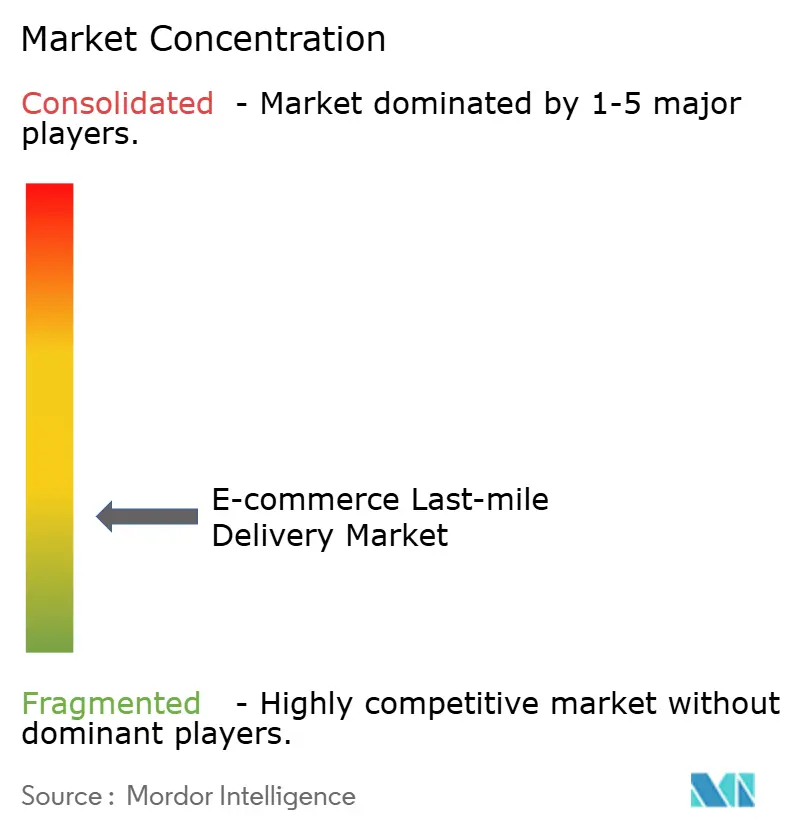
| Market Concentration | Low |
Major Players *Disclaimer: Major Players sorted in no particular order Image © Mordor Intelligence. Reuse requires attribution under CC BY 4.0. | |
E-commerce Last-mile Delivery Market Analysis by Mordor Intelligence
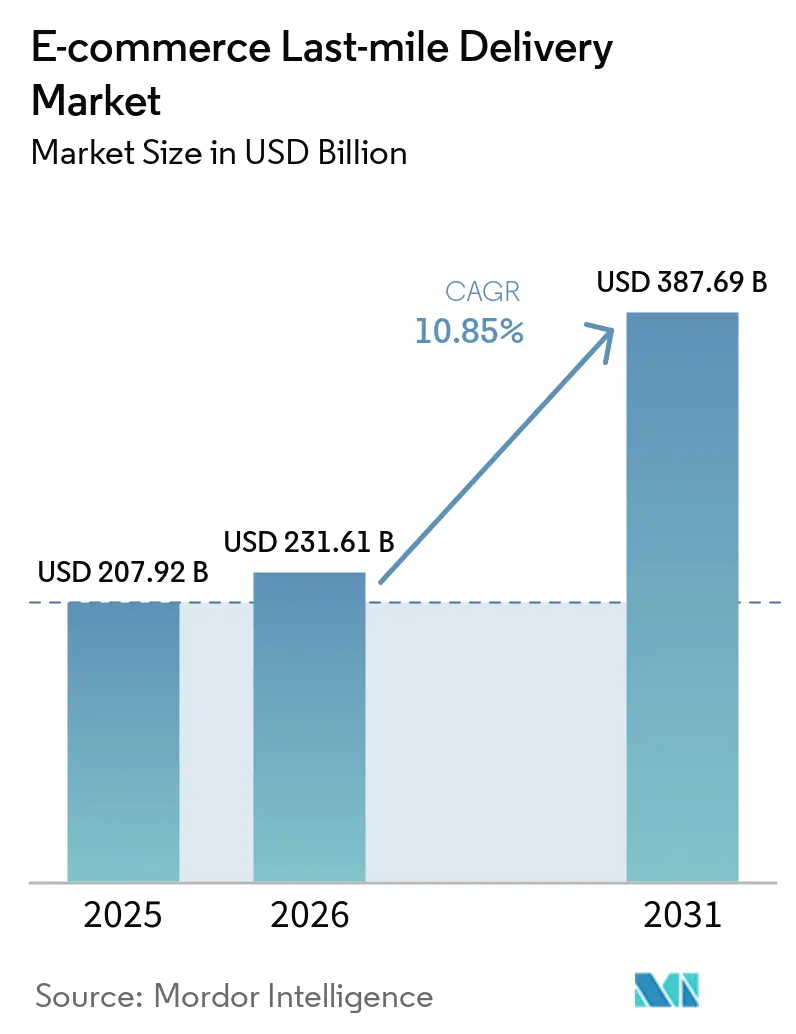
The global e-commerce last-mile delivery market was valued at USD 207.92 billion in 2025 and is expected to grow to USD 231.61 billion in 2026, reaching USD 387.69 billion by 2031, at a CAGR of 10.85% over 2026-2031.
The global e-commerce last-mile delivery market is gaining momentum from higher parcel density in urban corridors, faster same-day infrastructure rollout, and wider adoption of route optimization tools across carrier networks. The current phase of the global e-commerce last-mile delivery market is more structural than the earlier pandemic surge because carriers are now treating logistics assets as revenue products, a shift that became visible when Amazon opened its fulfillment and delivery network to outside businesses in May 2026. Cost pressure still matters in the market because driver shortages remain severe.
Key Report Takeaways
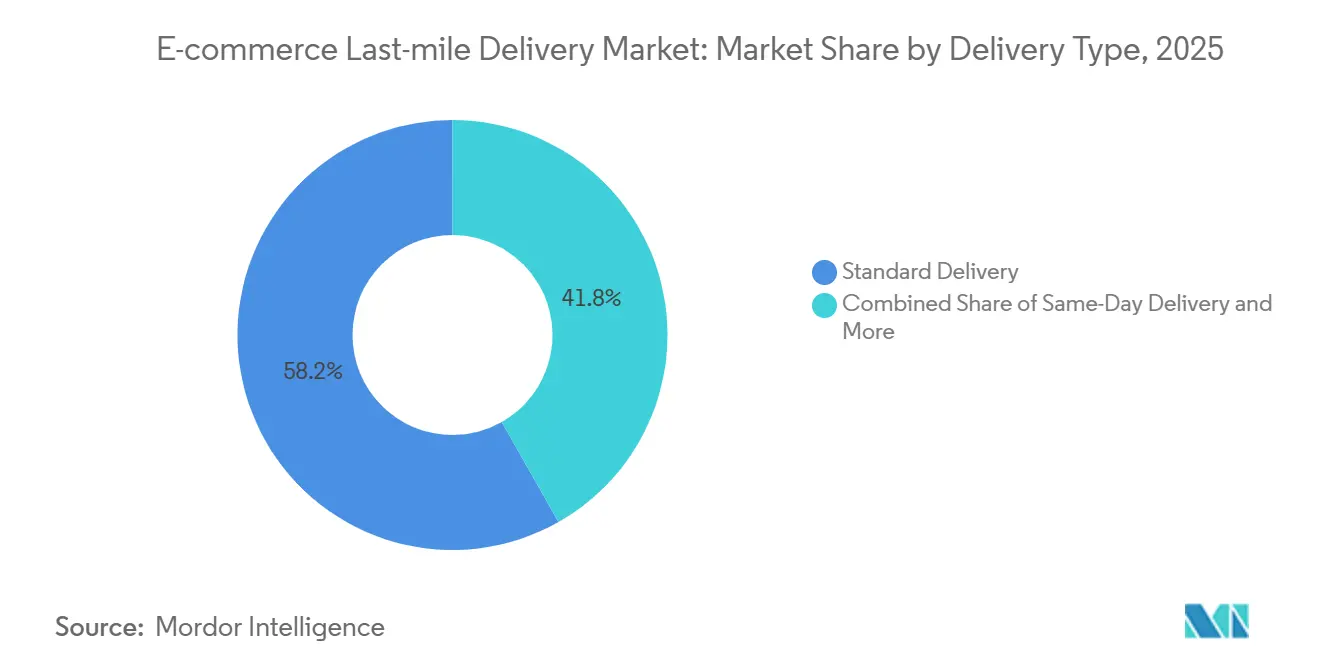
- By delivery type, standard delivery accounted for 58.20% of the global e-commerce last-mile delivery market share in 2025, while same-day delivery is forecast to expand at a 14.30% CAGR through 2031.
- By delivery model, B2C accounted for 66.56% of the global e-commerce last-mile delivery market size in 2025, while C2C recorded the highest projected CAGR of 16.97% through 2031.
- By city tier, Tier 2 cities accounted for 38.02% of the global e-commerce last-mile delivery market share in 2025, while Tier 3 and below are projected to grow at a 13.90% CAGR through 2031.
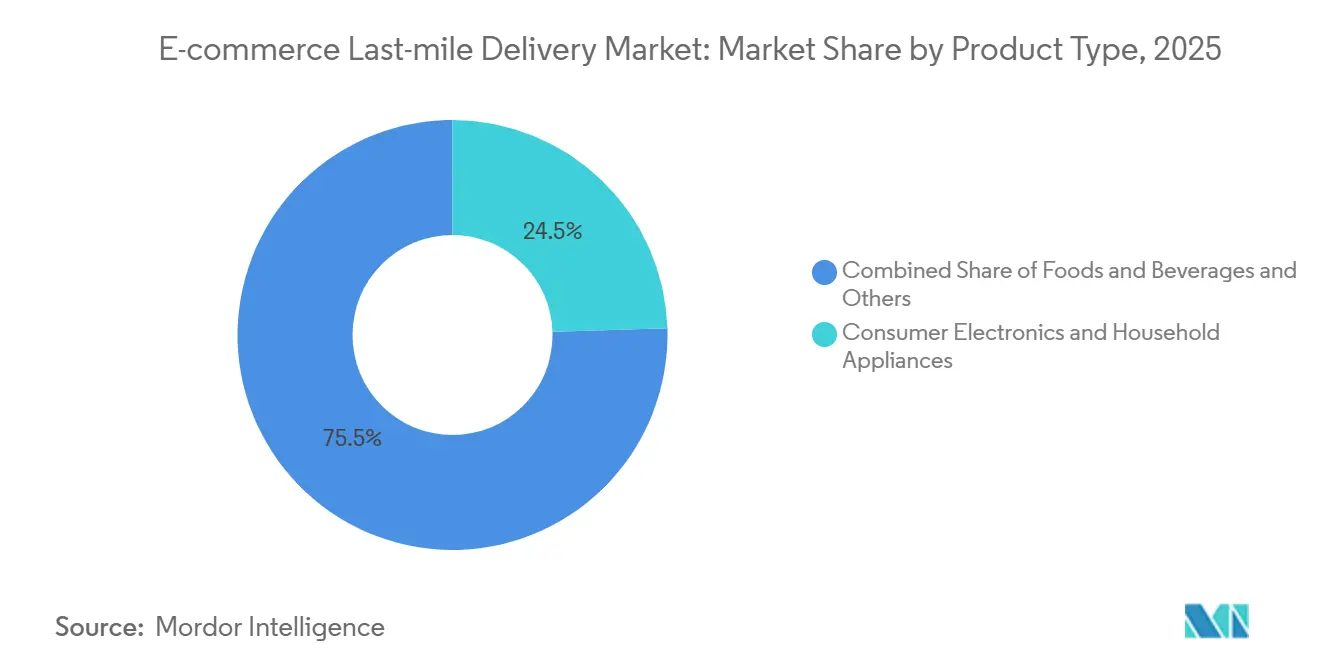
- By product type, consumer electronics and household appliances accounted for 24.50% of the global e-commerce last-mile delivery market size in 2025, while foods and beverages are forecast to expand at a 13.10% CAGR through 2031.
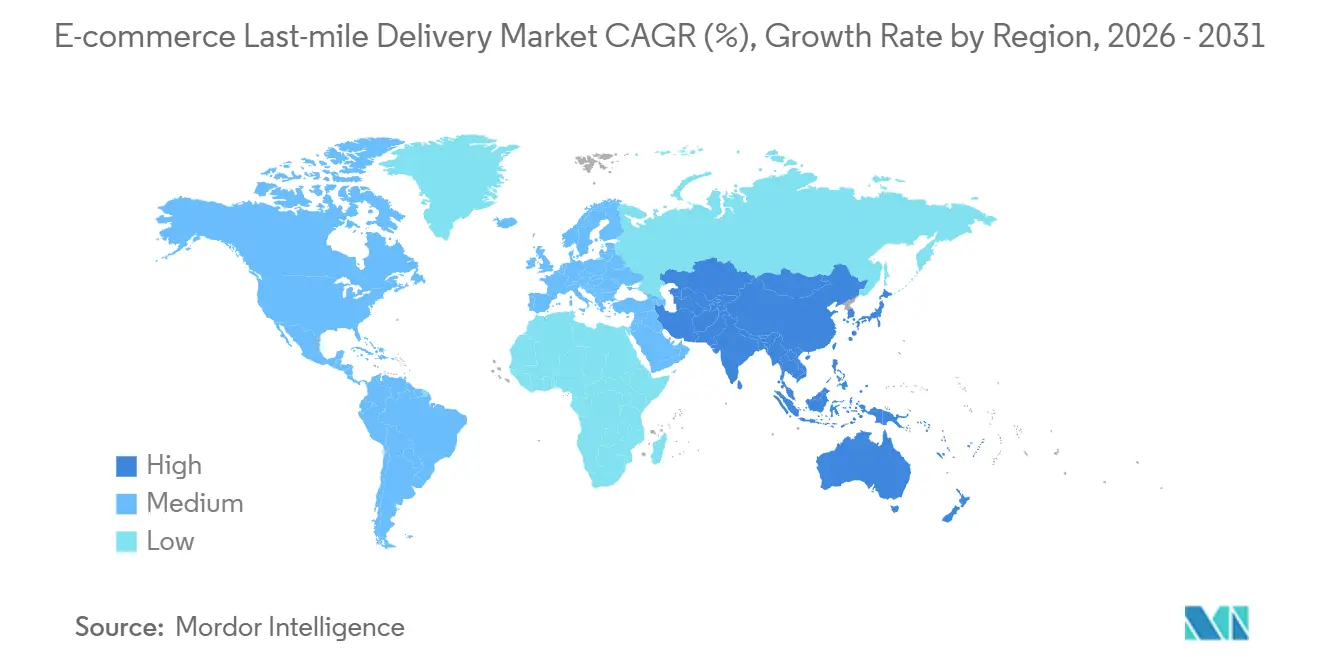
- By geography, Asia-Pacific accounted for 38.41% of the global e-commerce last-mile delivery market share in 2025 and recorded the fastest projected regional CAGR of 11.93% through 2031.
Note: Market size and forecast figures in this report are generated using Mordor Intelligence’s proprietary estimation framework, updated with the latest available data and insights as of January 2026.
Market Trends and Insights
Drivers Impact Analysis of E-commerce Last-mile Delivery Market*
| Driver | (~) % Impact on CAGR Forecast | Geographic Relevance | Impact Timeline |
|---|---|---|---|
| E-Commerce Order Density Growth in Urban Corridors | +2.1% | Global, with the highest concentration in Asia-Pacific and North America | Short term (≤ 2 years) |
| Same-Day and Next-Day Service Penetration | +1.8% | Asia-Pacific core, spill-over to North America and Western Europe | Short term (≤ 2 years) |
| Cross-Border Parcel Network Expansion | +1.5% | Global, with the highest intensity in the Europe-Asia and the Americas trade lanes | Medium term (2-4 years) |
| Retailer-Owned Delivery Networks and Private Fleets | +1.2% | North America and China, early gains in India and Southeast Asia | Medium term (2-4 years) |
| Delivery-Orchestration Software and Route Optimization Adoption | +1.0% | Global, advanced adoption in North America, the EU, and Australia | Long term (≥ 4 years) |
| Micro-Fulfillment and Dark Store Proximity Economics | +0.9% | Urban centers globally, with the fastest uptake in India, China, and the United Kingdom | Medium term (2-4 years) |
| Source: Mordor Intelligence | |||
E-Commerce Order Density Growth in Urban Corridors
Rising order concentration in cities is lowering per-stop delivery cost in the global e-commerce last-mile delivery market. Dense routes improve vehicle utilization and make route planning more predictable across short delivery radii. India’s quick-commerce platforms operated nearly 1,900 dark stores by early 2026, and the count was projected to exceed 5,000 by the end of the year[1]. Those networks process orders within 10-15 minutes, which means retailers need hyper-local fulfillment capacity rather than a conventional hub-and-spoke model. Amazon’s May 2026 launch of Amazon Supply Chain Services shows that large carriers now view logistics networks as commercial products that can serve both outside brands and captive retail volume. In the global e-commerce last-mile delivery market, this change is raising the pressure on carriers that still rely on legacy cost structures and slower network redesign.
Same-Day and Next-Day Service Penetration
Same-day and next-day delivery have moved from premium options to standard expectations in many urban markets within the global e-commerce last-mile delivery market. That shift is forcing carriers to move inventory closer to end users and tighten control over delivery time windows. Aramex signed a master services agreement with Shipsy in April 2025 to deploy AI-powered route optimization, territory management, and time-slot tools for its same-day service rollout. The strongest pull is coming from use cases where urgency matters more than shipping price, especially food, returns, and refill-driven categories. Geopost reported 11% growth in temperature-controlled activity across 8 European countries in 2025, which supports the role of fast delivery in perishable and sensitive shipments. In the global e-commerce last-mile delivery market, faster delivery is no longer only a service upgrade; it is becoming a network design rule.
Cross-Border Parcel Network Expansion
Cross-border flows are becoming a core source of volume for the global e-commerce last-mile delivery market. That is pushing carriers to build local delivery capability rather than depend only on linehaul scale and customs expertise. JD Logistics launched JoyExpress in the United Kingdom, Germany, the Netherlands, and France in February 2026 with more than 60 warehouses and depots across Europe. The service added same-day and next-day delivery in major cities, which shows that cross-border operators increasingly need domestic-grade service quality once parcels enter destination markets. In the global e-commerce last-mile delivery market, this pattern favors operators that can integrate international movement, local fulfillment, and final-mile delivery under a single network logic. It also raises the competitive risk for incumbents that have strong customs and air networks but limited local density in destination markets.
Micro-Fulfillment and Dark Store Proximity Economics
Micro-fulfillment is strengthening the global e-commerce last-mile delivery market by placing inventory closer to the point of demand. The value comes less from headline speed and more from reducing distance, failed deliveries, and repeat handling inside dense urban neighborhoods. India’s dark store footprint was already near 1,900 sites in early 2026. The economics are highly location-sensitive because a site away from the demand center incurs a structural last-mile cost penalty that warehouse productivity alone cannot offset. That is why fast-delivery categories are concentrating on local node placement rather than only broad regional fulfillment coverage. In the global e-commerce last-mile delivery market, proximity economics are steadily shifting investment toward small urban assets that support speed, route density, and repeat-order convenience.
Restraints Impact Analysis of E-commerce Last-mile Delivery Market*
| Restraint | (~) % Impact on CAGR Forecast | Geographic Relevance | Impact Timeline |
|---|---|---|---|
| Urban Curb Access Constraints and Delivery Slot Scarcity | -1.5% | Global: highest severity in Western Europe and North American metro markets | Short term (≤ 2 years) |
| Driver Shortage and High Last-Mile Labor Intensity | -1.2% | Global, Europe has the highest shortage rate at 13% of the workforce | Medium term (2–4 years) |
| Failed Delivery, Return, and Reverse Logistics Costs | -0.9% | Global; highest impact in markets with elevated return rates - United Kingdom, Germany, and Southeast Asia | Medium term (2–4 years) |
| Residential Electrification and Depot Charging Readiness Gaps | -0.7% | Emerging markets, including India, Southeast Asia, and Africa; secondary impact in rural North America and Southern Europe | Long term (≥ 4 years) |
| Source: Mordor Intelligence | |||
Urban Curb Access Constraints and Delivery Slot Scarcity
Urban access rules are making it harder to scale e-commerce last-mile delivery profitably in dense city centers. Low-emission zones, restricted time windows, and vehicle limits raise route complexity and reduce delivery flexibility. A 2026 Springer Nature study on urban last-mile routing showed that Zero Emission Zone enforcement can force operators to dedicate electric vehicle fleets to restricted routes before the cost savings of electrification are fully realized. That creates a front-loaded capital burden for fleets that still operate mixed vehicle bases across several jurisdictions. The issue is more severe where charging access, curb space, and local operating rules change from one city to another. In the global e-commerce last-mile delivery market, these frictions are limiting service flexibility even when parcel demand remains strong.
Driver Shortage and High Last-Mile Labor Intensity
Labor intensity remains a major brake on the global e-commerce last-mile delivery market. The International Road Transport Union reported 2.9 million unfilled truck driver positions across 18 surveyed markets in 2025, equal to 11% of the workforce, and Europe showed the highest shortage rate at 13%[2]. The problem now extends beyond wages because time at home, secure parking, cab conditions, and schedule predictability have become major retention factors. That means carriers cannot solve the issue only through higher pay or temporary hiring pushes. The response is shifting toward automation pilots, more efficient routing, and cleaner fleets that can operate in restricted urban areas with fewer manual disruptions. In the global e-commerce last-mile delivery market, labor availability is now tied directly to service reliability, route economics, and expansion capacity.
*Our forecasts treat driver/restraint impacts as directional, not additive. The impact forecasts reflect baseline growth, mix effects, and variable interactions.
E-commerce Last-mile Delivery Market Segment Analysis
By Delivery Type:
Same-Day Volumes Reshape Carrier Network DesignStandard delivery accounted for 58.20% of the global e-commerce last-mile delivery market share in 2025, indicating that price-sensitive consumers and bulk-oriented shippers still value predictable, lower-cost service windows. The global e-commerce last-mile delivery market still depends on this base because standard volumes provide the density that supports broader network utilization. Standard service remains especially relevant when delivery urgency is low, and parcel baskets are larger or less time-sensitive. Next-day delivery continues to sit at the midpoint of the service spectrum, benefiting from normalized delivery expectations and expanding suburban fulfillment coverage.
Same-day delivery is projected to expand at a 14.30% CAGR through 2031, and that growth requires inventory to be placed within a short operating radius of the end customer. Carriers, therefore, need dark stores, micro-fulfillment nodes, and smarter dispatching rather than only more long-haul capacity. Aramex addressed this in April 2025 by deploying Shipsy’s AI-powered territory and route optimization tools to support its same-day product rollout. Geopost’s out-of-home volumes in Europe grew 31% in 2025, indicating that parcel shops and lockers are taking a share of the demand that would otherwise require costly doorstep service. That moderation effect matters because same-day networks need high utilization to remain profitable, and out-of-home options help balance service speed with delivery cost discipline.

By Delivery Model:
B2C Scale Meets C2C DisruptionB2C accounted for 66.56% of the global e-commerce last-mile delivery market size in 2025, reflecting the central role of retailers, fashion platforms, and electronics sellers in building route density across the market. The consumer side of the global e-commerce last-mile delivery market remains the foundational parcel flow on which most carrier utilization models are built. B2B volumes are also rising as brands replenish smaller and more distributed fulfillment nodes that support omnichannel and fast-delivery models. Platforms such as Vinted, Poshmark, and Shopee fit this pattern because they generate large volumes of small, repeat individual shipments.
C2C is projected to grow at a 16.97% CAGR through 2031, giving it one of the clearest expansion paths in the global e-commerce last-mile delivery market. These parcels are usually light, dimensionally standardized, and suited to residential or out-of-home collection networks rather than heavy-touch delivery models. That makes C2C structurally compatible with locker and parcel shop systems that lower failed delivery rates and increase stop efficiency. B2B, while less visible, is also becoming more important because replenishment to distributed storage locations requires more frequent, time-sensitive movement than traditional bulk restocking.
By City Tier:
Tier 3 Growth Outpaces Infrastructure ReadinessTier 2 cities accounted for 38.02% of the global e-commerce last-mile delivery market share in 2025, reflecting strong digital commerce adoption alongside lower fulfillment real estate costs than in major metros. The global e-commerce last-mile delivery market is finding a practical scale balance in these cities because demand is significant. At the same time, operating constraints remain more manageable than in top-tier urban cores. Tier 1 cities still support premium pricing for same-day service, yet they face heavier curb restrictions and labor pressure that limit volume efficiency.
Tier 3 and below is projected to grow at a 13.90% CAGR through 2031, but delivery success in these locations still depends on better route density, clearer addresses, and more terrain-suited vehicles. Failed first-attempt deliveries tend to rise when standardized address systems are weak, and stop density is still developing. Delhivery and Bajaj Auto announced a June 2026 partnership to deploy 200 Bajaj RIKI eCarts across Tier 2 and Tier 3 routes, with a second phase targeting 1,500 electric 3-wheelers through 2026-2027. That move directly addresses the mixed terrain and narrow roads that make conventional fleet design less efficient outside dense metro areas. In the global e-commerce last-mile delivery market, non-metro expansion is therefore not only a demand story but also a story about vehicle design and operating models.
By Product Type:
Food Commerce Fastest-Growing, Electronics Anchoring VolumesConsumer electronics and household appliances accounted for 24.50% of the global e-commerce last-mile delivery market size in 2025, supported by higher order values that can absorb premium shipping and specialized handling. This category anchors a meaningful part of the global e-commerce last-mile delivery market because large-ticket purchases justify service upgrades, installation support, and stronger delivery visibility. Fashion and lifestyle remain operationally important because high order frequency and elevated return rates keep reverse logistics demand high. Furniture adds another layer of complexity through volumetric weight, delivery coordination, and setup needs. JD Logistics built delivery-and-installation capability into JoyExpress from launch in Europe in February 2026, demonstrating how carriers are using service depth to compete in bulky, service-sensitive categories.
Foods and beverages are the fastest-growing product type, with a 13.10% CAGR through 2031, and that expansion reflects a rapidly rising role in the global e-commerce last-mile delivery market. The category depends on dark store growth, rapid picking, and short delivery windows that conventional retail fulfillment does not support well. India’s dark store footprint was near 1,900 in early 2026 and was projected to move past 5,000 by year-end, with many of those nodes geared toward food and fast-moving consumer goods fulfillment. Food delivery also requires stricter compliance, as cold-chain integrity and hygiene controls raise operating standards for any carrier entering the segment. In the global e-commerce last-mile delivery market, food and beverage is one of the clearest growth areas, but also one of the more execution-heavy service categories.
Geography Analysis
APAC E-commerce Last-mile Delivery Market
Asia-Pacific accounted for 38.41% of the global e-commerce last-mile delivery market share in 2025 and is also the fastest-growing region, with a 11.93% CAGR through 2031. The global e-commerce last-mile delivery market is particularly dynamic in Asia-Pacific, where scale and growth reinforce each other rather than moving in opposite directions. China’s leading logistics operators are extending their domestic operating models into Southeast Asia, Europe, and the Americas, thereby shrinking the historical advantage of slower, more fragmented delivery systems. Cainiao opened a United States-Mexico trade lane in early 2026 and set up a dedicated logistics technology office in Japan while deploying its ZeeBot warehouse robot in Guangdong operations. Australia Post expanded its On demand same-day service to 372 new suburbs across 68 postcodes from July 2026, demonstrating that regional strategy in Asia-Pacific also includes large geographies that need flexible service models rather than just dense metro playbooks.
North America E-commerce Last-mile Delivery Market
North America remains a critical operating theater because the global e-commerce last-mile delivery market there is being reshaped through both collaboration and direct competition. The United States Postal Service is becoming increasingly central as shared final-mile infrastructure for private carriers seeking broad national coverage without duplicating every low-density route. DHL eCommerce signed an exclusive multi-year agreement worth more than USD 10 billion with USPS in May 2026, covering final-mile delivery to more than 41,550 ZIP Codes and 170 million delivery points. Canada Post began preliminary work on a multi-year transformation in April 2026, including plans to move approximately 136,000 addresses from door-to-door service to community mailboxes in late 2026 or early 2027[3]. These moves show that North American players are balancing reach, cost, and delivery density through hybrid models rather than relying on a single ownership structure for every route.
Europe, Middle East and South America E-commerce Last-mile Delivery Market
Europe presents the most layered competitive landscape in the global e-commerce last-mile delivery market, as pan-European integrators, national postal systems, and Chinese entrants compete for the same parcel pools. FedEx’s February 2026 move, in partnership with its consortium, to acquire InPost was designed to tie residential parcel economics more closely to locker infrastructure across Europe. Geopost’s network passed 150,000 parcel shops and lockers in 2025, which shows how strongly out-of-home delivery is being built into the regional operating model. The Middle East and South America remain smaller in absolute terms. Still, both regions are important for future growth because fast urban adoption and cross-border demand can support network expansion when service models are adapted to local infrastructure realities.
Competitive Landscape
The global e-commerce last-mile delivery market is less fragmented, with a small group of large international operators holding strong positions in developed markets and several regional champions retaining deep local strength. Amazon Logistics, DHL Group, UPS, and FedEx remain important scale players, while JD Logistics, SF Express, Delhivery, J&T Express, and Geopost are influential in their home regions. The competitive edge in the global e-commerce last-mile delivery market is shifting from pure network size to network intelligence, because route orchestration, demand visibility, and asset productivity now shape margins more directly than basic footprint claims. Amazon’s May 2026 rollout of Amazon Supply Chain Services illustrates this shift, as it opened the company’s fulfillment and delivery network to outside brands and turned its internal logistics capabilities into a standalone service offering[4]. FedEx’s February 2026 InPost transaction shows the same logic from another angle, with locker density used to cut residential delivery costs and improve service flexibility across Europe.
Strategies in the global e-commerce last-mile delivery market are also diverging based on the parcel segments that carriers aim to defend. In its January 2026 earnings release, UPS stated that it had reduced its Amazon-related daily volume by approximately 1 million packages during the first half of 2026 and shifted its focus toward small and medium-sized businesses, B2B, and healthcare shipments. This move indicates that some established carriers increasingly prioritize yield quality over overall parcel volume. Geopost’s 31% increase in out-of-home volumes in 2025 points to another path: carriers improving economics by moving consumer traffic toward lockers and parcel shops rather than doorstep delivery. The global e-commerce last-mile delivery market is therefore separating into premium service defenders, consumer-density optimizers, and network builders that want to monetize logistics capacity beyond their original core business.
Chinese operators are a particularly important competitive force in the global e-commerce last-mile delivery market because they are pairing domestic execution playbooks with overseas buildouts. JD Logistics entered 4 major European markets with JoyExpress in February 2026, and Cainiao continued to deepen automation and cross-border capability in 2026. This creates pressure on incumbent operators that depend on slower network adaptation or weaker consumer-facing convenience infrastructure. Compliance demands such as data protection and customs controls still create entry barriers. Still, the direction of competition in the global e-commerce last-mile delivery market is clearly toward denser consumer networks, more automation, and tighter control of cross-border parcel handoffs.
E-commerce Last-mile Delivery Industry Leaders
-
Amazon Logistics
-
United Parcel Service (UPS)
-
FedEx Corporation
-
DHL Group
-
United States Postal Service (USPS)
- *Disclaimer: Major Players sorted in no particular order
E-commerce Last-mile Delivery Market Companies Covered in this Report
- Amazon Logistics
- United Parcel Service (UPS)
- FedEx Corporation
- DHL Group
- United States Postal Service (USPS)
- Geopost (DPDgroup)
- GLS Group
- JD Logistics
- SF Express
- Cainiao Network
- Yamato Holdings
- J&T Express
- Delhivery
- Aramex
- Ninja Van
- Australia Post
- Canada Post
- Poste Italiane
- Sagawa Express
- Blue Dart Express
- InPost SA
- XpressBees
Recent Industry Developments in E-commerce Last-mile Delivery Market
- June 2026: Delhivery and Bajaj Auto announced a partnership to deploy 200 Bajaj RIKI eCarts in Delhivery's Tier 2 and Tier 3 last-mile network, marking Phase 1 of a program targeting 1,500 Bajaj electric 3-wheelers by 2026-2027. The deployment is designed to reduce fuel costs and improve vehicle reliability in geographies where conventional delivery vehicles face terrain and charging infrastructure challenges.
- May 2026: JR West and Sagawa Express signed a collaboration agreement on "Co-creation of Customer Experience Value" to integrate railway and logistics networks. A same-day luggage delivery service between Kyoto or Osaka and Hiroshima or Hakata launched on June 22, 2026, targeting inbound tourists, with a bundled offering for JR West rail pass holders. This emerging real-commerce model positions Sagawa at the intersection of travel logistics.
- May 2026: DHL eCommerce and the United States Postal Service entered an exclusive multi-year contract valued at over USD 10 billion, the largest in their 25-year relationship, for last-mile parcel delivery services across the United States. USPS delivers to over 41,550 ZIP Codes and 170 million delivery points 6 days a week under the agreement, while DHL handles upstream pickup, sortation across 19 automated hubs, and linehaul.
- May 2026: Amazon launched Amazon Supply Chain Services, opening its end-to-end logistics network, spanning ocean, road, rail, and air, to external businesses. The service offered inventory forecasting, distribution, fulfillment, and 2-5-day delivery across all sales channels, positioning Amazon as the world's fourth-largest logistics integrator alongside UPS, FedEx, and DHL.
Global E-commerce Last-mile Delivery Market Report Scope
Segmentation Overview
| Standard Delivery |
| Same-Day Delivery |
| Next-Day Delivery |
| Business-to-Consumer (B2C) |
| Business-to-Business (B2B) |
| Consumer-to-Consumer (C2C) |
| Tier 1 |
| Tier 2 |
| Tier 3 and Below |
| Foods and Beverages |
| Personal and Household Care |
| Fashion and Lifestyle (Accessories, Apparel, Footwear) |
| Furniture |
| Consumer Electronics and Household Appliances |
| Other Products |
| North America | United States |
| Canada | |
| Mexico | |
| South America | Brazil |
| Peru | |
| Chile | |
| Argentina | |
| Rest of South America | |
| Asia-Pacific | China |
| Japan | |
| India | |
| South Korea | |
| Australia | |
| South East Asia | |
| Rest of Asia-Pacific | |
| Europe | United Kingdom |
| Germany | |
| France | |
| Spain | |
| Italy | |
| BENELUX (Belgium, Netherlands, and Luxembourg) | |
| NORDICS (Denmark, Finland, Iceland, Norway, and Sweden) | |
| Rest of Europe | |
| Middle East and Africa | United Arab Emirates |
| Saudi Arabia | |
| South Africa | |
| Nigeria | |
| Rest of the Middle East And Africa |
| By Delivery Type | Standard Delivery | |
| Same-Day Delivery | ||
| Next-Day Delivery | ||
| By Delivery Model | Business-to-Consumer (B2C) | |
| Business-to-Business (B2B) | ||
| Consumer-to-Consumer (C2C) | ||
| By City Tier | Tier 1 | |
| Tier 2 | ||
| Tier 3 and Below | ||
| By Product Type | Foods and Beverages | |
| Personal and Household Care | ||
| Fashion and Lifestyle (Accessories, Apparel, Footwear) | ||
| Furniture | ||
| Consumer Electronics and Household Appliances | ||
| Other Products | ||
| By Region/Country | North America | United States |
| Canada | ||
| Mexico | ||
| South America | Brazil | |
| Peru | ||
| Chile | ||
| Argentina | ||
| Rest of South America | ||
| Asia-Pacific | China | |
| Japan | ||
| India | ||
| South Korea | ||
| Australia | ||
| South East Asia | ||
| Rest of Asia-Pacific | ||
| Europe | United Kingdom | |
| Germany | ||
| France | ||
| Spain | ||
| Italy | ||
| BENELUX (Belgium, Netherlands, and Luxembourg) | ||
| NORDICS (Denmark, Finland, Iceland, Norway, and Sweden) | ||
| Rest of Europe | ||
| Middle East and Africa | United Arab Emirates | |
| Saudi Arabia | ||
| South Africa | ||
| Nigeria | ||
| Rest of the Middle East And Africa | ||
Key Questions Answered in the Report
What is the 2031 value expected for global e-commerce last-mile delivery?
The global e-commerce last-mile delivery market is forecast to reach USD 387.69 billion by 2031, rising from USD 231.61 billion in 2026 at a 10.85% CAGR over 2026-2031.
Which region leads global e-commerce last-mile delivery?
Asia-Pacific led with a 38.41% share in 2025 and is also the fastest-growing region, with a 11.93% CAGR through 2031
Which delivery service is growing fastest in last-mile delivery for e-commerce?
Same-day delivery is the fastest-growing delivery type, with a projected 14.30% CAGR through 2031, even though Standard Delivery remained the largest segment in 2025.
Why are dark stores important for parcel delivery growth?
Dark stores shorten delivery distances, support 10-15-minute fulfillment models, and improve same-day economics in dense urban areas.
What is the biggest labor risk for delivery operators?
Driver shortages remain a major constraint, with IRU reporting 2.9 million unfilled truck driver roles across 18 surveyed markets in 2025.
Which product category is expanding fastest in e-commerce last-mile delivery?
Foods and beverages are the fastest-growing product type, with a projected 13.10% CAGR through 2031, supported by quick-commerce and proximity fulfillment models