
Bulk Cargo Shipping Market Size and Share
Market Overview
| Study Period | 2020 - 2031 |
|---|---|
| Market Size (2026) | USD 504.80 Billion |
| Market Size (2031) | USD 636.61 Billion |
| Growth Rate (2026 - 2031) | 4.75 % |
| Fastest Growing Market | Asia-Pacific |
| Largest Market | Asia-Pacific |
| Market Concentration | Medium |
Major Players
*Disclaimer: Major Players sorted in no particular order Image © Mordor Intelligence. Reuse requires attribution under CC BY 4.0. |
|
Bulk Cargo Shipping Market Analysis by Mordor Intelligence
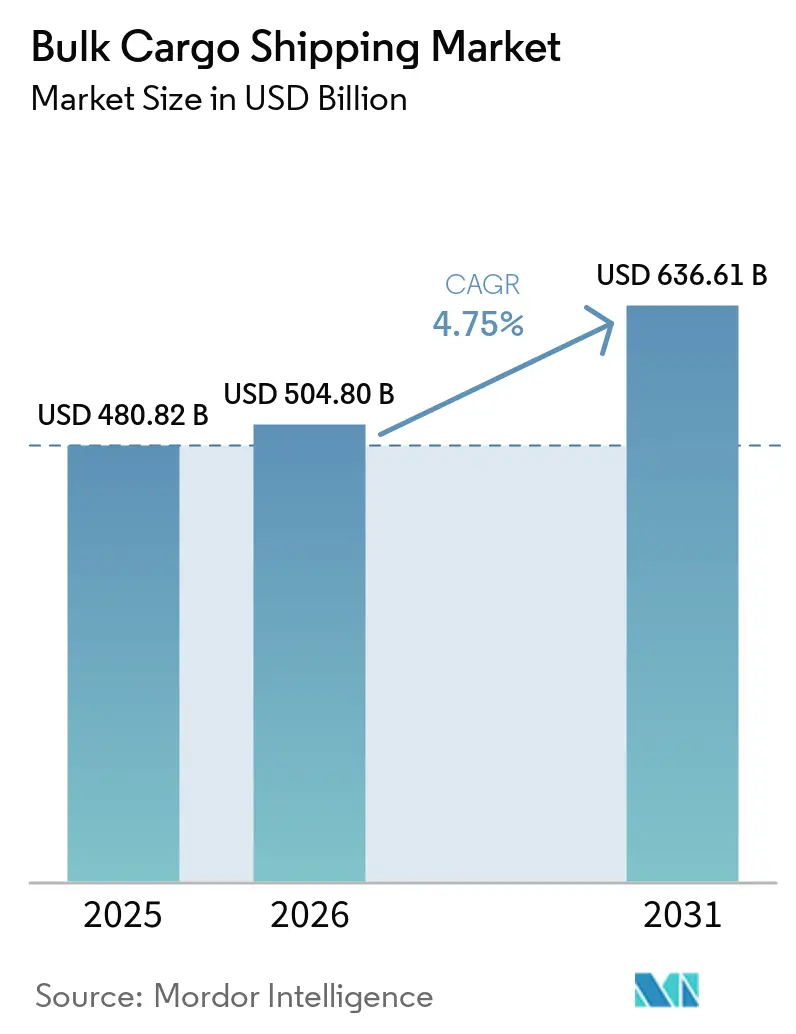
The Bulk cargo shipping market size was valued at USD 480.82 billion in 2025 and is estimated to grow from USD 504.80 billion in 2026 to reach USD 636.61 billion by 2031 at 4.75% CAGR over 2026-2031.
The bulk cargo shipping market is supported by intercontinental movements of iron ore, coal, grain, and liquid energy commodities. Global seaborne bulk trade exceeded 7.2 billion tonnes in 2025 and grew 1.4% from the prior year, while iron ore and coal represented more than half of dry bulk volumes. Simandou sent its first commercial iron ore cargo to China in December 2025, creating a Guinea-to-China voyage of 46 days compared with 10 to 14 days from Australia. That longer route raises tonne-mile demand and gives Capesize operators a larger revenue opportunity per cargo movement. The balance between dry bulk vessel demand growth of 2.5% and fleet growth of 1.4% in 2025 sustained freight-rate strength entering 2026[1].
Key Report Takeaways
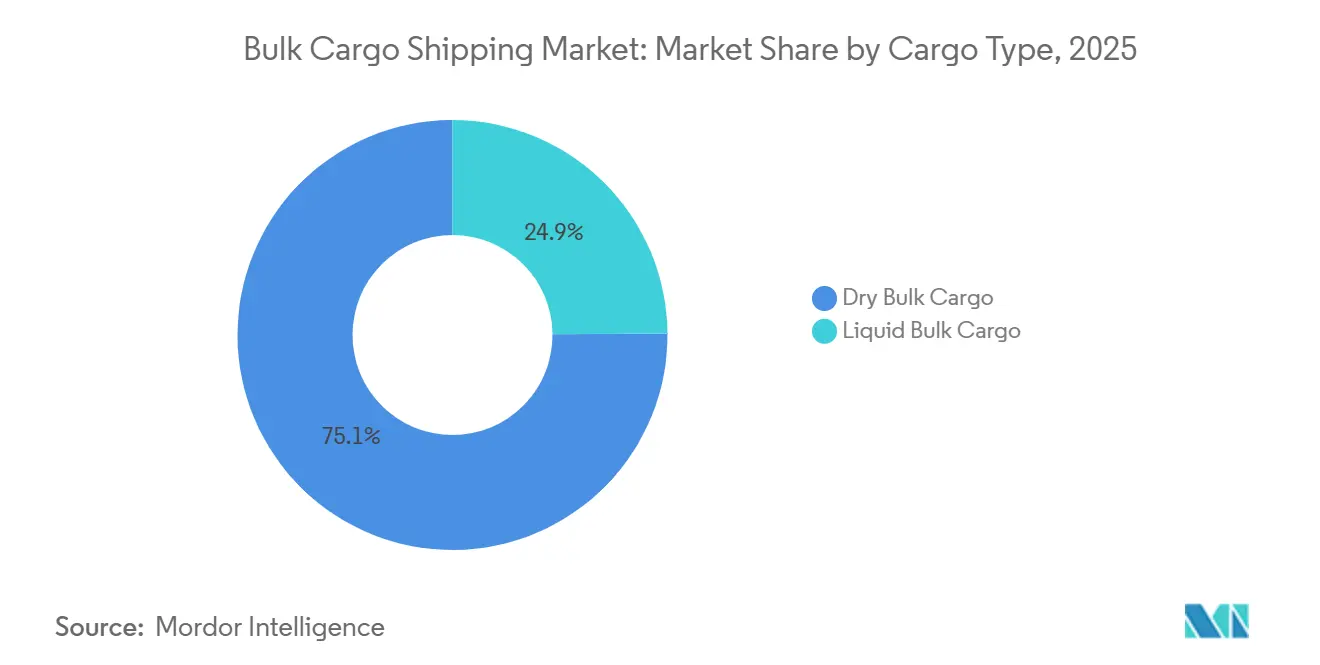
- By cargo type, dry bulk cargo held 75.12% of the bulk cargo shipping market share in 2025, while liquid bulk cargo is forecast to grow at a 6.17% CAGR through 2031.
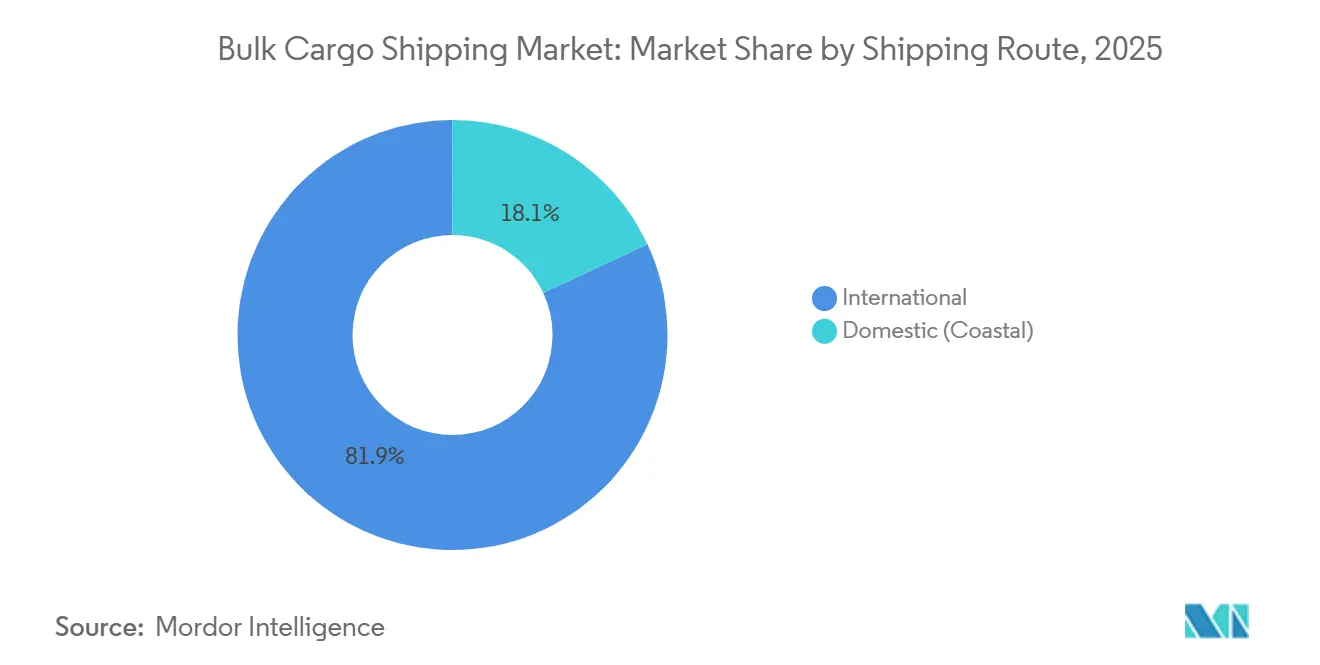
- By shipping route, international shipping held 81.93% of the bulk cargo shipping market size in 2025, while domestic coastal shipping is forecast to grow at a 5.84% CAGR through 2031.
- By end-use industry, mining and metals held 28.87% of the bulk cargo shipping market share in 2025, while chemicals and petrochemicals are forecast to grow at a 6.62% CAGR through 2031.
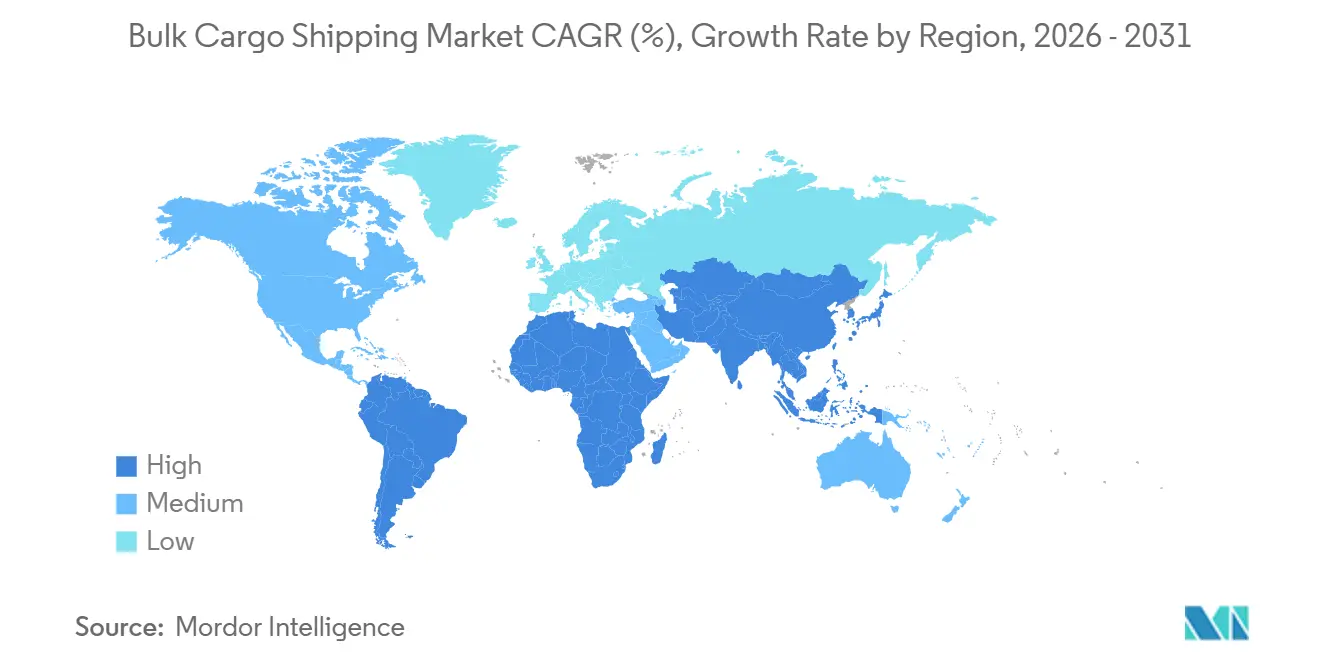
- By geography, Asia-Pacific held 51.88% of the bulk cargo shipping market size in 2025 and is forecast to grow at a 5.63% CAGR through 2031.
Note: Market size and forecast figures in this report are generated using Mordor Intelligence’s proprietary estimation framework, updated with the latest available data and insights as of January 2026.
Market Trends and Insights
Drivers Impact Analysis of Bulk Cargo Shipping Market*
| Driver | (~) % Impact on CAGR Forecast | Geographic Relevance | Impact Timeline |
|---|---|---|---|
| Rising Seaborne Demand for Iron Ore and Coal | +1.3% | Global, concentrated in Australia-Brazil-West Africa to Asia-Pacific corridors | Short term (≤ 2 years) |
| Expansion of Grain and Fertilizer Trade Flows | +0.9% | Global, with key corridors in East Coast South America, United States Gulf, and Black Sea | Medium term (2-4 years) |
| Fleet Efficiency Gains From Larger Bulk Carriers | +0.7% | Global, particularly Atlantic and Pacific deep-sea trade lanes | Long term (≥ 4 years) |
| Port Automation and Digital Voyage Optimization | +0.6% | Asia-Pacific core, with spillover to Europe and Middle East and Africa | Long term (≥ 4 years) |
| Growth in Specialized Liquid Bulk Trade Corridors | +0.5% | Middle East, North America, and Asia-Pacific | Medium term (2-4 years) |
| Commodity Supply Re-Localization and Trade Diversion | +0.4% | Global, with concentration on Atlantic and Indian Ocean routes | Medium term (2-4 years) |
| Source: Mordor Intelligence | |||
Rising Seaborne Demand for Iron Ore and Coal
Seaborne iron ore remains a central source of cargo demand for the bulk cargo shipping market. Simandou’s commercial ramp-up changed the origin mix for iron ore bound for China. The project reported monthly shipments above 2.2 million tonnes by May 2026. A Guinea-to-China voyage creates 4 times the tonne-miles of an equivalent Australian shipment. BIMCO expects longer average sailing distances to account for half of dry bulk ship demand growth in 2026, independent of changes in total cargo volumes. Coal trade declined as Indonesian exports contracted, but longer Atlantic-to-Asia routes can still support vessel utilization where buyers substitute supply origins.
Expansion of Grain and Fertilizer Trade Flows
Agricultural cargoes broaden demand beyond iron ore and coal in the bulk cargo shipping market. Seaborne agricultural trade reached 716.5 million tonnes in 2025. Grain shipments rose 15% year over year in the first 6 weeks of 2026 as South American surpluses increased exports. The Strait of Hormuz disruption halted a significant share of fertilizer movements and delayed urea, sulfur, and phosphate cargoes. The International Fertilizer Association expects constrained nitrogen availability during the 2026/27 crop cycle. When supply resumes, buyers drawing down inventories may return to the freight market at the same time, supporting Supramax and Panamax demand on agricultural routes[2].
Fleet Efficiency Gains From Larger Bulk Carriers
Newbuilding activity is shifting toward larger ships that offer stronger fuel performance per tonne-mile. COSCO Shipping Development contracted 15 methanol-and-ammonia-ready Newcastlemax vessels in July 2026, each with 210,000 DWT capacity. The order links cargo capacity, fuel flexibility, and compliance planning in one fleet decision. DNV reported that Capesize and Newcastlemax vessels are less exposed to competition for shipyard capacity from container orders. Modern large carriers use less fuel per tonne-mile than older Panamax vessels, which improves their position as carbon requirements tighten. The bulk cargo shipping market, therefore, gives operators with newer large vessels a cost advantage on long-distance trades.
Port Automation and Digital Voyage Optimization
Port and voyage technology is becoming more relevant to operating performance in the bulk cargo shipping market. Western Bulk deployed ZeroNorth’s platform across its 120-vessel fleet in March 2026. The system compares route options using earnings, speed, and carbon dioxide impact. ZeroNorth introduced its Propel platform in 2026 with Cargill, Ultrabulk, and CMB.TECH as its founding partners. Shanghai’s Yangshan Phase IV handled more than 8 million TEU in 2025 with a digital-twin system that coordinated 29 quay cranes and 155 automated guided vehicles. The terminal reported 30% greater throughput than conventional operations, showing how digital coordination can improve port capacity[3]. For bulk operators, better routing can reduce ballast-leg waste and improve vessel use.
Restraints Impact Analysis of Bulk Cargo Shipping Market*
| Restraint | (~) % Impact on CAGR Forecast | Geographic Relevance | Impact Timeline |
|---|---|---|---|
| Exposure to Dry Bulk Freight Rate Cyclicality | -0.7% | Global | Short term (≤ 2 years) |
| Decarbonization Compliance and Fuel Transition Costs | -0.5% | Global, concentrated in European and East Asian fleets | Long term (≥ 4 years) |
| Port Congestion and Draft Constraints at Key Terminals | -0.4% | Asia-Pacific core, with spillover to Middle East and Africa | Medium term (2-4 years) |
| Counterparty Risk in Commodity-Led Shipping Contracts | -0.3% | Global, concentrated in commodity-exporting regions | Short term (≤ 2 years) |
| Source: Mordor Intelligence | |||
Exposure to Dry Bulk Freight Rate Cyclicality
Freight rates remain vulnerable to the balance between vessel deliveries and cargo demand. The dry bulk orderbook-to-fleet ratio reached 11.0% in H1 2026, compared with 9.5% in H1 2025. The orderbook included 600 vessels scheduled for delivery during 2026. BIMCO forecasts ship supply growth of 2.8% in 2026, compared with ship demand growth of 1.5% to 2.5%. Panamax and Supramax fleets face greater exposure because they account for more than 60% of scheduled deliveries. Owners operating through long-term charters have greater protection than operators dependent on spot voyages.
Decarbonization Compliance and Fuel Transition Costs
Carbon rules increase capital and operating requirements for older vessels in the bulk cargo shipping market. The International Maritime Organization requires an 11% cumulative carbon-intensity improvement from the 2019 baseline by the end of 2026. Under the amended guideline, annual reduction factors are set to increase to 2.625 percentage points from 2027 through 2030. Ballast legs and port waiting can make bulk carrier ratings less favorable because they add emissions without laden transport work. Vessels rated D or E must prepare corrective action plans under SEEMP Part III. The rules increase the difference in chartering appeal between modern vessels and older fleets[4].
*Our forecasts treat driver/restraint impacts as directional, not additive. The impact forecasts reflect baseline growth, mix effects, and variable interactions.
Bulk Cargo Shipping Market Segment Analysis
By Cargo Type:
Liquid Bulk Growth Signals an Energy Trade RealignmentDry bulk cargo held 75.12% of 2025 revenue, giving it the largest position in the bulk cargo shipping market size. Iron ore and coal represented more than 52% of total bulk trade by volume and supported Capesize and Panamax employment on Australia-China and Brazil-China routes. The scale of these cargoes keeps dry bulk at the center of fleet utilization. Bauxite also adds to long-haul demand from West African origins. Grain provides a third major cargo stream and gives owners exposure to seasonal agricultural trade. The bulk cargo shipping market benefits because the segment’s breadth helps protect operators from reliance on a single commodity.
Liquid bulk cargo is forecast to expand at a 6.17% CAGR from 2026 to 2031. Longer crude oil routes after the Hormuz disruption, new LNG liquefaction capacity, and Asian chemical tanker demand support this outlook. The shift indicates that energy and chemical flows are becoming more important to the broader bulk cargo shipping market. COSCO Shipping Bulk commissioned the YUAN HAI SI LU, described as the world’s first 325,000-DWT methanol dual-fuel ore carrier. The vessel shows how cargo capacity and fuel-transition readiness can be combined in a single asset. Operators serving both dry and liquid trades can use diversified demand to manage route disruption.
By Shipping Route:
International Corridors Drive Volume, Coastal Routes AccelerateInternational shipping held 81.93% of the bulk cargo shipping market share in 2025 and remained the largest route category. The route pattern reflects commodity flows between Australia, Brazil, Indonesia, Guinea, and Northeast Asian buyers. Within the bulk cargo shipping market, long intercontinental voyages create much of the vessel employment in the bulk cargo shipping market. Simandou adds a new Atlantic-to-Asia iron ore flow with materially longer sailing time than the Australian supply. Atlantic coal substitutions can also increase tonne-miles when trade origins change. International operators must therefore follow cargo origin shifts as closely as changes in total cargo volumes.
Domestic coastal shipping is forecast to grow at a 5.84% CAGR from 2026 to 2031. Cabotage reforms and port-led industrialization in India, Indonesia, and Vietnam support local waterborne movements. Coastal shipping can connect industrial sites with domestic energy, construction, and agricultural demand. It also has a regulatory distinction because IMO CII enforcement under MARPOL Annex VI applies to international voyages. This can lower exposure to annual international voyage reduction factors for domestic bulker owners. The bulk cargo shipping market can consequently develop through both major ocean corridors and shorter regional supply chains.
By End-Use Industry:
Chemicals Fastest While Mining Anchors the MarketMining and metals held 28.87% of the bulk cargo shipping market size in 2025 and formed the largest end-use category. Iron ore and bauxite movements sustained Capesize employment and linked exporters to steelmaking centers. Within the bulk cargo shipping market, the category remains closely tied to the expansion of long-distance resource trade. Simandou’s development reinforces the relevance of Atlantic iron ore supply to Asian demand. Mining cargoes also support the case for larger, more fuel-efficient vessels. These conditions maintain mining and metals as a key source of bulk cargo shipping market demand.
Chemicals and petrochemicals are projected to record the fastest end-use growth at a 6.62% CAGR through 2031. Expanding Asian and Gulf Cooperation Council petrochemical complexes require more bulk liquid feedstocks. Supply chain diversification away from production hubs near Hormuz adds another reason for route changes. Energy and utilities remain the second-largest category because of South and Southeast Asian coal demand. European coal phase-outs and higher domestic production in India limit the category’s growth. Agriculture, food processing, construction, manufacturing, and other uses add cargoes such as vegetable oil, molasses, cement, and clinker.
Geography Analysis
APAC Bulk Cargo Shipping Market
Asia-Pacific held 51.88% of 2025 revenue and is forecast to grow at a 5.63% CAGR through 2031. The region has the largest position in the Bulk cargo shipping market share because China remains the leading commodity importer. Australia is a major exporter of iron ore and coal, while China is a major destination for bulk cargoes. Simandou’s development also gives Asian buyers a growing Atlantic supply route. Vietnam, Indonesia, and India broaden regional demand through industrialization, infrastructure programs, and coastal shipping reforms.
Europe and the Americas Bulk Cargo Shipping Market
Europe and North America have different roles in the bulk cargo shipping market. For the bulk cargo shipping market, Europe is losing dry bulk import importance as coal phase-out policies reduce demand for seaborne steam coal. North America functions in the bulk cargo shipping market primarily as an exporter of grain and metallurgical coal to global markets. The Great Lakes and St. Lawrence Seaway also support regional industrial and construction commodity movements. South America, led by Brazil, is an important Atlantic source for grain and iron ore. Its position makes the Santos-to-Qingdao route important for Panamax activity and links agricultural output to Asian consumption.
MEA Bulk Cargo Shipping Market
The Middle East and Africa face opposing forces in 2026. The Hormuz closure disrupted Gulf crude and fertilizer cargo movements, while Saudi Arabia’s East-West pipeline and Red Sea access provided partial alternatives. Africa is becoming a more important dry bulk export region through Simandou and expanding bauxite movements. Simandou is progressing toward 60 million tonnes of annual capacity. The movement of more cargo from Atlantic origins increases the role of Africa in the bulk cargo shipping market. Redirected energy flows also raise the importance of transit and trading hubs outside the disrupted corridor.
Competitive Landscape
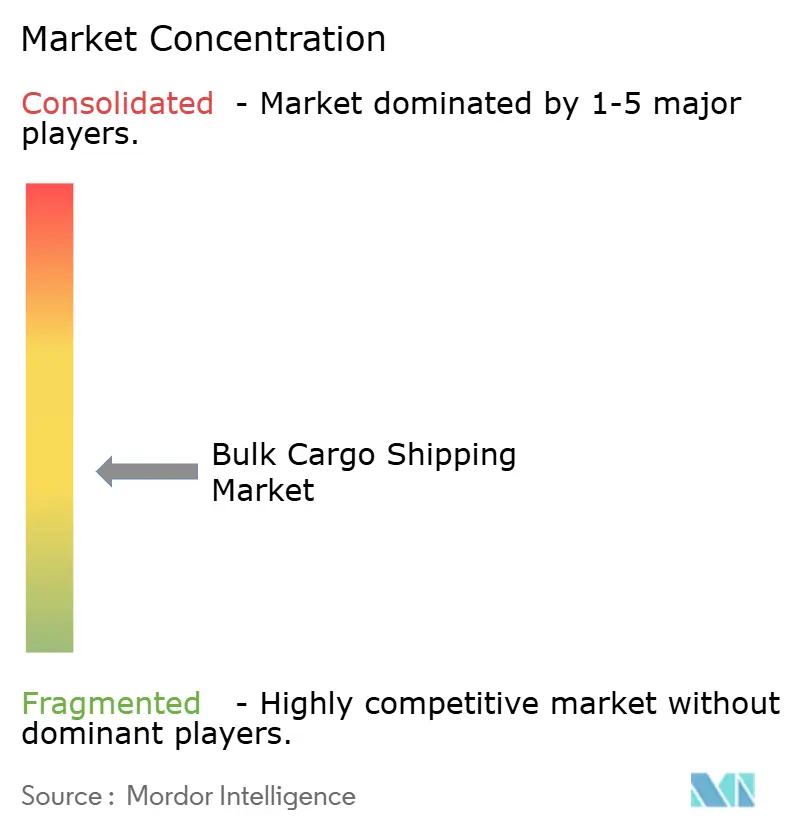
The bulk cargo shipping market is moderately fragmented, and no single operator controls more than a low single-digit share of global fleet capacity. In the bulk cargo shipping market, consolidation is nevertheless increasing among leading owners. CMB.TECH successfully completed its stock-for-stock merger with Golden Ocean Group in August 2025, combining dry bulk fleets across Capesize, Panamax, and Ultramax classes. Star Bulk agreed in March 2026 to acquire 16 vessels from Diana Shipping, representing 1.8 million DWT across Newcastlemax, Capesize, Ultramax, and Supramax ships. The transaction is intended to improve scale, lower per-vessel overhead, and strengthen chartering reach. Consolidation also helps owners support investment in vessel technology.
COSCO Shipping Bulk, NYK Line, and MOL remain important participants in state-backed and Japanese shipping-house fleets. COSCO Shipping Development contracted 15 grain vessels and 9 additional bulk vessels in June 2026. The company also contracted 15 Newcastlemax vessels in July 2026. These orders reinforce fleet capability in grain and iron ore corridors. Greek beneficial owners are also active in fleet renewal, with a preference for larger Capesize and Kamsarmax vessels. The bulk cargo shipping industry is moving toward ships with greater commercial liquidity and lower emissions exposure.
Technology is a further area of competition in the bulk cargo shipping market. Western Bulk’s March 2026 deployment of ZeroNorth across 120 vessels is one example of a move toward real-time voyage planning. ZeroNorth’s Propel platform can generate voyage plans, communicate with vessel masters, and revise routing during transit. These tools can support speed, routing, and carbon decisions as charterers pay closer attention to carbon intensity. Specialized liquid bulk corridors and Arctic-capable dry bulk routes remain areas where operators may seek new earnings sources. Mixed operators can also diversify earnings between grain, dry bulk, and tanker activity when route disruption changes relative freight opportunities.
Bulk Cargo Shipping Industry Leaders
-
Oldendorff Carriers
-
COSCO Shipping Bulk Co., Ltd.
-
NYK Line
-
Mitsui O.S.K. Lines (MOL)
-
Kawasaki Kisen Kaisha ("K" Line)
- *Disclaimer: Major Players sorted in no particular order
Bulk Cargo Shipping Market Companies Covered in this Report
- Oldendorff Carriers
- COSCO Shipping Bulk Co., Ltd.
- NYK Line
- Mitsui O.S.K. Lines (MOL)
- Kawasaki Kisen Kaisha ("K" Line)
- Star Bulk Carriers Corp.
- CMB.TECH (Including Golden Ocean Group)
- Pacific Basin Shipping Ltd.
- Berge Bulk
- D/S NORDEN
- Ultrabulk A/S
- Genco Shipping and Trading Ltd.
- Diana Shipping Inc.
- Navios Maritime Partners L.P.
- Safe Bulkers Inc.
- Fednav Ltd.
- CSL Group
- Bahri
- Wisdom Marine Group
- Algoma Central Corporation
- Pangaea Logistics Solutions
- Lauritzen Bulkers
Recent Industry Developments in Bulk Cargo Shipping Market
- July 2026: COSCO Shipping Development contracted 15 methanol-and-ammonia-ready Newcastlemax bulk carriers with 210,000 DWT each for RMB 7.92 billion (USD 1.1 billion) from 2 Chinese state shipyards.
- June 2026: COSCO Shipping Development contracted 15 87,000-DWT grain vessels and 9 additional bulk vessels with China State Shipbuilding Group for RMB 8.66 billion (USD 1.2 billion) combined.
- June 2026: Star Bulk received delivery of 2 82,000-DWT eco-Kamsarmax vessels, Star Emma and Star Evelina, bringing its commercial fleet to 138 vessels with 13.8 million DWT aggregate capacity.
- April 2026: Pacific Basin ordered 2 additional 40,000-DWT Handysize newbuildings for USD 59.6 million combined and converted 4 dual-fuel Ultramax orders to conventional-fuel designs with a dual-fuel option.
Global Bulk Cargo Shipping Market Report Scope
Segmentation Overview
| Dry Bulk Cargo | Iron Ore |
| Coal | |
| Grain (Wheat, Corn, Soybeans, etc.) | |
| Fertilizers | |
| Cement and Clinker | |
| Bauxite and Alumina | |
| Steel Products | |
| Other Minor Dry Bulk Commodities | |
| Liquid Bulk Cargo | Crude Oil |
| Refined Petroleum Products | |
| Liquefied Natural Gas (LNG) | |
| Liquefied Petroleum Gas (LPG) | |
| Chemicals | |
| Edible and Vegetable Oils | |
| Molasses | |
| Other Liquid Bulk Commodities |
| Domestic (Coastal) |
| International |
| Mining and Metals |
| Energy and Utilities |
| Agriculture |
| Chemicals and Petrochemicals |
| Construction and Infrastructure |
| Food Processing |
| Manufacturing (General Industrial) |
| Others |
| North America | United States |
| Canada | |
| Mexico | |
| South America | Brazil |
| Peru | |
| Chile | |
| Argentina | |
| Rest of South America | |
| Asia-Pacific | China |
| Japan | |
| South Korea | |
| India | |
| Australia | |
| Southeast Asia | |
| Rest of Asia-Pacific | |
| Europe | United Kingdom |
| Germany | |
| France | |
| Spain | |
| Italy | |
| Belgium | |
| Netherlands | |
| NORDICS (Denmark, Finland, Iceland, Norway, and Sweden) | |
| Rest of Europe | |
| Middle East and Africa | United Arab Emirates |
| Saudi Arabia | |
| South Africa | |
| Nigeria | |
| Egypt | |
| Rest of the Middle East and Africa |
| By Cargo Type | Dry Bulk Cargo | Iron Ore |
| Coal | ||
| Grain (Wheat, Corn, Soybeans, etc.) | ||
| Fertilizers | ||
| Cement and Clinker | ||
| Bauxite and Alumina | ||
| Steel Products | ||
| Other Minor Dry Bulk Commodities | ||
| Liquid Bulk Cargo | Crude Oil | |
| Refined Petroleum Products | ||
| Liquefied Natural Gas (LNG) | ||
| Liquefied Petroleum Gas (LPG) | ||
| Chemicals | ||
| Edible and Vegetable Oils | ||
| Molasses | ||
| Other Liquid Bulk Commodities | ||
| By Shipping Route | Domestic (Coastal) | |
| International | ||
| By End-Use Industry | Mining and Metals | |
| Energy and Utilities | ||
| Agriculture | ||
| Chemicals and Petrochemicals | ||
| Construction and Infrastructure | ||
| Food Processing | ||
| Manufacturing (General Industrial) | ||
| Others | ||
| By Region/Country | North America | United States |
| Canada | ||
| Mexico | ||
| South America | Brazil | |
| Peru | ||
| Chile | ||
| Argentina | ||
| Rest of South America | ||
| Asia-Pacific | China | |
| Japan | ||
| South Korea | ||
| India | ||
| Australia | ||
| Southeast Asia | ||
| Rest of Asia-Pacific | ||
| Europe | United Kingdom | |
| Germany | ||
| France | ||
| Spain | ||
| Italy | ||
| Belgium | ||
| Netherlands | ||
| NORDICS (Denmark, Finland, Iceland, Norway, and Sweden) | ||
| Rest of Europe | ||
| Middle East and Africa | United Arab Emirates | |
| Saudi Arabia | ||
| South Africa | ||
| Nigeria | ||
| Egypt | ||
| Rest of the Middle East and Africa | ||
Key Questions Answered in the Report
What is the 2026 value of bulk cargo shipping?
The sector is valued at USD 504.80 billion in 2026 and is forecast to reach USD 636.61 billion by 2031 at a 4.75% CAGR.
Which cargo type is growing fastest through 2031?
Liquid bulk cargo is forecast to grow at a 6.17% CAGR, supported by LNG, crude oil rerouting, and chemical feedstock flows.
Why is Simandou important for ocean freight?
Guinea-to-China iron ore voyages take 46 days, compared with 10 to 14 days from Australia, which increases tonne-mile demand.
Which region has the largest role in global bulk shipping?
Asia-Pacific held 51.88% of revenue in 2025 and is forecast to grow at a 5.63% CAGR through 2031.
How do CII rules affect bulk carrier owners?
The IMO requires an 11% cumulative carbon-intensity improvement by end-2026, increasing pressure on older vessels.
What is changing in fleet investment?
Owners are ordering larger vessels with fuel flexibility, including methanol-and-ammonia-ready Newcastlemax ships.