
Glass Curtain Wall Market Size and Share
Market Overview
| Study Period | 2021 - 2031 |
|---|---|
| Market Size (2026) | USD 60.22 Billion |
| Market Size (2031) | USD 81.14 Billion |
| Growth Rate (2026 - 2031) | 6.14 % |
| Fastest Growing Market | Asia-Pacific |
| Largest Market | Asia-Pacific |
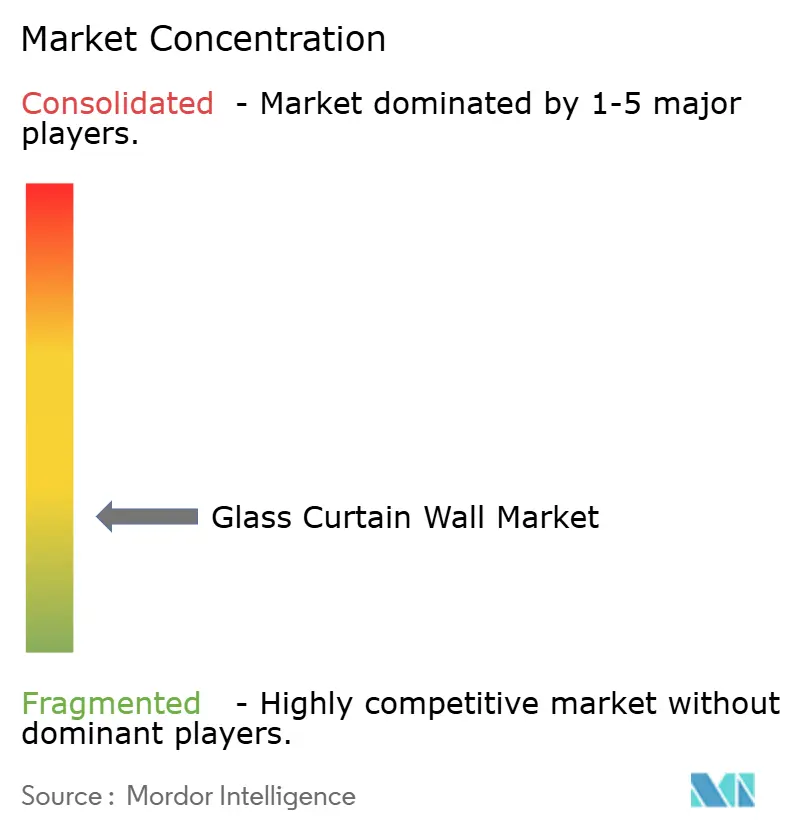
| Market Concentration | Low |
Major Players *Disclaimer: Major Players sorted in no particular order Image © Mordor Intelligence. Reuse requires attribution under CC BY 4.0. | |
Glass Curtain Wall Market Analysis by Mordor Intelligence
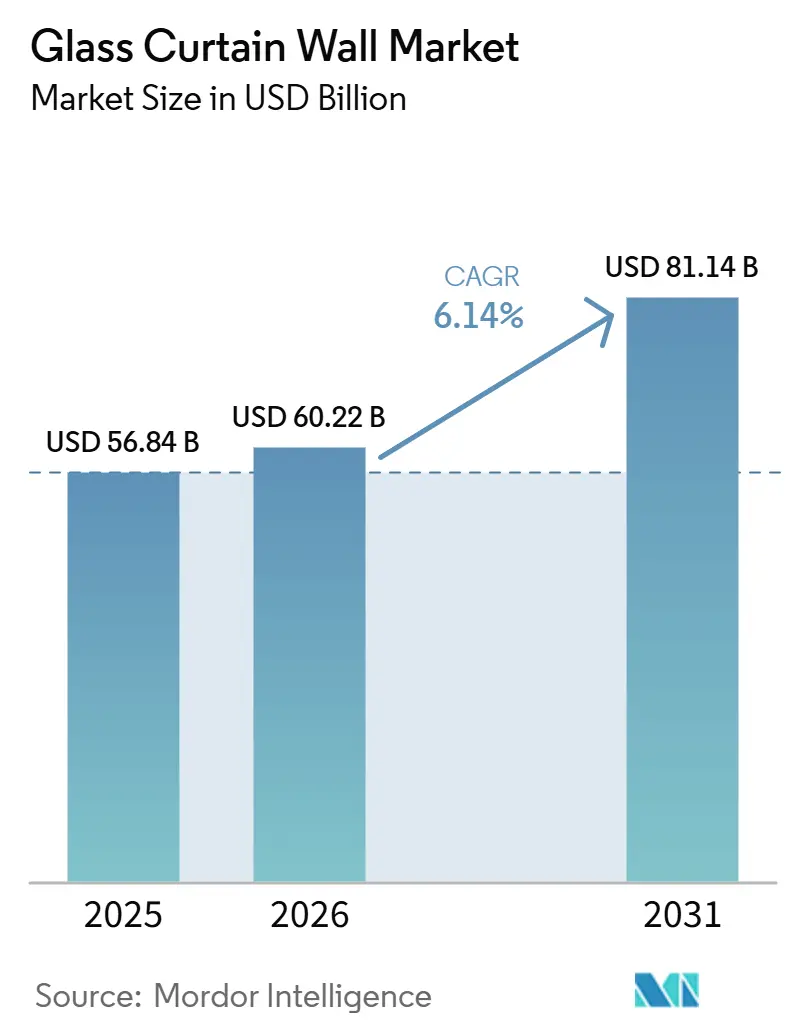
The Glass Curtain Wall Market was valued at USD 56.84 billion in 2025 and is estimated to grow from USD 60.22 billion in 2026 to reach USD 81.14 billion by 2031, at a CAGR of 6.14% during the forecast period (2026–2031). The glass curtain wall market is being shaped by stricter energy rules that place envelope performance at the center of commercial building design. California’s 2025 Building Energy Efficiency Standards took effect in January 2026 and set stronger envelope requirements for non-residential buildings, while the state expects USD 4.8 billion in energy cost savings and 4 million metric tons of avoided greenhouse gas emissions over 30 years. New York City’s 2025 Energy Conservation Code, enforced from March 30, 2026, also tightens commercial fenestration requirements, making thermal performance a more important procurement factor. The glass curtain wall market, therefore, benefits when developers treat façades as assets that affect operating costs, compliance, and building quality. Factory-built systems, efficient glazing, and refurbishment work should remain central to the glass curtain wall market as owners respond to labor limits, material costs, and tighter standards.
Key Report Takeaways
- By system type, unitized system held 66.41% of the glass curtain wall market share in 2025 and is projected to advance at a 6.84% CAGR through 2031.
- By glass type, insulated glass held 38.74% of the glass curtain wall market share in 2025, while Low-E glass is projected to advance at a 7.57% CAGR through 2031.
- By construction type, new construction held 58.32% of the glass curtain wall market share in 2025, while refurbishment is projected to advance at a 7.02% CAGR through 2031.
- By end-use industry, commercial held 62.33% of the glass curtain wall market share in 2025, while public and institutional is projected to advance at a 6.77% CAGR through 2031.
- By geography, Asia-Pacific held 45.61% of the glass curtain wall market share in 2025 and is projected to advance at a 6.82% CAGR through 2031.
Note: Market size and forecast figures in this report are generated using Mordor Intelligence’s proprietary estimation framework, updated with the latest available data and insights as of January 2026.
Market Trends and Insights
Drivers Impact Analysis of Glass Curtain Wall Market*
| Driver | (~) % Impact on CAGR Forecast | Geographic Relevance | Impact Timeline |
|---|---|---|---|
| Growing Demand for Energy-Efficient and Sustainable Building Envelopes | +1.5% | Global, strongest in North America, EU, China | Long term (≥ 4 years) |
| Rapid Growth in High-Rise Commercial and Mixed-Use Construction | +1.4% | APAC core (China, India, SE Asia), spill-over to MEA | Medium term (2-4 years) |
| Increasing Adoption of Prefabricated Unitized Curtain Wall Systems | +1.1% | Global, most advanced in North America and APAC | Medium term (2-4 years) |
| Rising Preference for Glass Façades in Premium Commercial and Residential Developments | +0.8% | MEA, APAC, North America | Medium term (2-4 years) |
| Increasing Adoption of Low-Carbon and Recyclable Façade Materials | +0.6% | EU, North America, APAC | Long term (≥ 4 years) |
| Source: Mordor Intelligence | |||
Growing Demand for Energy-Efficient and Sustainable Building Envelopes
Tighter energy codes are changing how the glass curtain wall market is specified in commercial construction. The European Commission states that buildings account for more than 40% of total EU energy use and one-third of energy-related greenhouse gas emissions. Its Recovery and Resilience Facility has directed EUR 66 billion (approximately USD 75.6 billion) toward renovating 76 million square meters of non-residential floor space[1]European Commission, “In Focus, Improving the Energy Performance of Buildings,” European Commission, energy.ec.europa.eu. California’s 2025 code is making lower U-factors and solar heat gain control more important in new commercial projects[2]California Energy Commission, “California’s Energy Code Update Guides the Construction of Cleaner, Healthier Buildings,” California Energy Commission, energy.ca.gov. These requirements support demand for thermally broken frames, insulating glass units, and low-emissivity coatings. The glass curtain wall market also gains from voluntary building frameworks because they make daylight, thermal performance, and embodied carbon part of project selection.
Rapid Growth in High-Rise Commercial and Mixed-Use Construction
High-rise commercial and mixed-use construction remains an important demand source for the glass curtain wall market in the Asia-Pacific and the Middle-East. Large projects require façade systems that can meet wind, heat, solar-control, and installation requirements at scale. Saudi Arabia’s Vision 2030 program has committed USD 1 trillion to infrastructure across more than 1,500 projects, including NEOM, the Red Sea development, and Qiddiya. This pipeline supports demand for engineered unitized façades that can be produced and installed in large quantities. India and Southeast Asia also add demand through mixed-use projects that seek recognized green-building credentials. The UAE’s Al Sa’fat rating system and Saudi Building Code make thermal breaks and insulated glazing more relevant to project specifications in the region.
Increasing Adoption of Prefabricated Unitized Curtain Wall Systems
Factory-prefabricated unitized panels are changing delivery practices across the glass curtain wall market. These panels arrive ready for crane installation, which helps contractors shorten on-site assembly and protect the interior from weather exposure. The approach is particularly useful for tall buildings where panel tolerances and wind resistance are difficult to manage through field glazing. Research published in 2025 on prefabricated curtain wall systems found that digital design integration supports the precision and complex geometry required in such work. Manufacturing facilities can separate panel production from job-site installation, helping firms manage the shortage of specialized on-site labor. The glass curtain wall market should continue to favor suppliers that combine design coordination, manufacturing control, and reliable site installation.
Rising Preference for Glass Façades in Premium Commercial and Residential Developments
Premium commercial and residential projects use glass-heavy façades to support daylight, views, and indoor comfort. This preference gives the glass curtain wall market a role in developer strategies that focus on tenant appeal and building quality. Building-integrated photovoltaic systems can place solar cells within glazing units before they are sent to the site. This option can make façades part of a building’s energy strategy rather than only its enclosure. Developers may use this approach where operating costs, building certifications, and design expectations justify the added system complexity. Low-carbon and recyclable materials further strengthen the appeal of higher-performing façade specifications in projects where lifecycle impacts are part of the decision process.
Restraints Impact Analysis of Glass Curtain Wall Market*
| Restraint | (~) % Impact on CAGR Forecast | Geographic Relevance | Impact Timeline |
|---|---|---|---|
| High Initial Costs of Unitized Curtain Wall and High-Performance Glazing Systems | -0.8% | Global, most acute in price-sensitive markets (South America, parts of APAC) | Medium term (2-4 years) |
| Skilled Installation and Façade Engineering Constraints | -0.6% | North America and EU most exposed | Medium term (2-4 years) |
| Price Volatility and Supply Chain Disruptions for Architectural Glass, Aluminum, and Sealants | -0.9% | Global, with acute exposure in EU and North America | Short term (≤ 2 years) |
| Source: Mordor Intelligence | |||
High Initial Costs of Unitized Curtain Wall and High-Performance Glazing Systems
Higher initial costs remain a restraint for the glass curtain wall market, especially where developers focus on the earliest stage of project spending. Unitized systems require manufacturing capacity, engineering work, transport planning, and specialized installation equipment before their schedule benefits are realized. High-performance glass can add further expense through advanced coatings, vacuum insulation, and smart-glass functions. This is most challenging in price-sensitive locations where lower labor costs still support site-built alternatives. Developers may also face a difficult choice when local codes require stronger performance, but project financing does not recognize the full lifecycle benefit. The glass curtain wall market can therefore remain concentrated in flagship commercial, institutional, hotel, and premium residential projects in these locations.
Skilled Installation and Façade Engineering Constraints
Façade work requires specialized design, fabrication, testing, and installation skills. These capabilities cannot be expanded quickly when project demand rises because field crews need substantial technical training. North America and Europe face particular exposure where labor scarcity affects glazing, engineering, and site coordination. Complex unitized systems also depend on accurate survey work, lifting plans, and coordination with structure and interior trades. Delays in any of these areas can affect façade sequencing and project completion. This constraint supports greater use of factory-controlled systems, but it can also restrict the number of firms able to compete for complex work.
*Our forecasts treat driver/restraint impacts as directional, not additive. The impact forecasts reflect baseline growth, mix effects, and variable interactions.
Glass Curtain Wall Market Segment Analysis
By System Type:
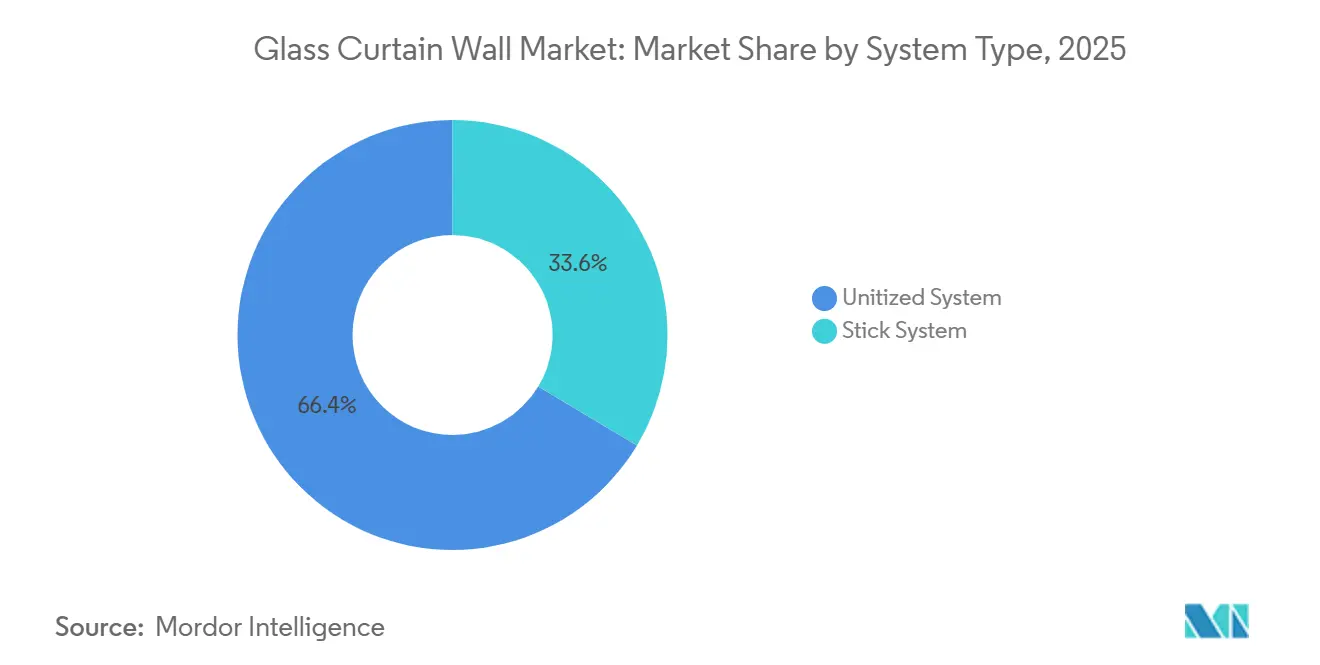
Unitized System Maintains Dual LeadershipThe unitized system held 66.41% of the glass curtain wall market share in 2025 and is forecast to grow at a 6.84% CAGR through 2031. This leading position reflects the value of factory production for tall buildings and complex commercial projects. Unitized panels can be designed, assembled, and quality-checked before they reach the site. This supports tighter control of alignment, weather resistance, and visual consistency. The system also reduces the amount of work that must be completed at height. These benefits matter when construction schedules are compressed, and site labor is limited.
Stick-built systems remain relevant for lower-rise buildings, projects with irregular geometry, and areas where site labor remains relatively economical. They can provide flexibility when project repetition is insufficient to justify unitized tooling. However, the glass curtain wall industry is moving toward systems that reduce weather exposure and simplify site installation. Digital modeling supports panel coordination for curved and customized building envelopes. As design tools become more accessible, medium-scale projects may use unitized solutions more often. Suppliers that manage both fabrication and installation should be better positioned in this part of the glass curtain wall market.


By Glass Type:
Performance Codes Accelerating Low-E Glass SpecificationInsulated glass held 38.74% of the revenue share in 2025, giving it the leading position among glass types. It remains a familiar choice for commercial and institutional projects because it supports a practical combination of thermal performance, visibility, and cost. Low-E glass is forecast to grow at a 7.57% CAGR through 2031, the fastest rate among the listed glass types. This performance reflects the effect of codes that place tighter limits on heat transfer and solar gain. The 2025 California Energy Code has strengthened envelope requirements for commercial and non-residential buildings. New York City’s active energy code also makes fenestration performance a more direct design consideration.
Tempered glass and laminated glass meet different safety and performance needs in a curtain wall assembly. Tempered glass helps manage thermal stress and post-breakage safety requirements. Laminated glass adds structural continuity and can improve acoustic performance. Both remain relevant for overhead glazing, large vision panels, and areas where safety codes apply. Advanced glazing products can improve thermal performance without requiring a major increase in glazing thickness. This gives façade designers more flexibility when they need to manage frame depth, panel weight, and architectural appearance. The glass curtain wall market can benefit as owners look for glazing that satisfies energy rules while preserving daylight and façade design options.
By Construction Type:
Refurbishment Accelerates Alongside New ConstructionNew construction accounted for 58.32% of the glass curtain wall market in 2025. High-rise commercial towers, mixed-use developments, and transport facilities continue to create the largest individual façade orders. These projects increasingly use unitized glazing with integrated solar control because they require speed, repeatability, and consistent performance. New buildings also give design teams the opportunity to integrate façade decisions with building systems early in the project. This allows glass, framing, shading, and building controls to be considered together. Growth in the glass curtain wall market, therefore, remains connected to major urban construction pipelines.
Refurbishment is expected to grow at a 7.02% CAGR through 2031, making it the fastest-growing construction type. The revised EU Energy Performance of Buildings Directive requires member states to renovate the 16% worst-performing non-residential buildings by 2030 and the 26% worst-performing by 2033. This requirement creates a replacement cycle for older façades that no longer meet current energy and carbon expectations. Refurbishment can involve full façade replacement or the removal, repair, and reinstallation of existing panels. Permasteelisa’s July 2026 appointment for 60 Queen Victoria Street in London includes removing, refurbishing, and reinstalling the existing façade alongside new replacement panels. Such work gives the glass curtain wall market a path to growth that is less dependent on new-build cycles.
By End-Use Industry:
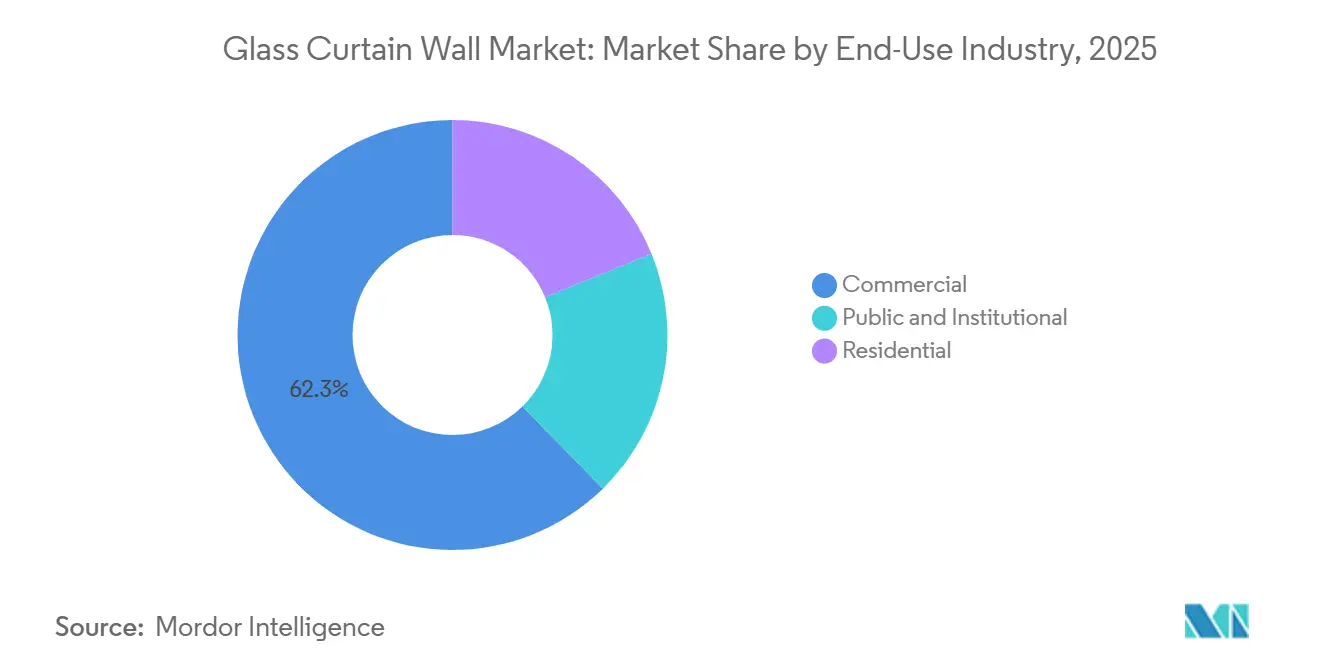
Public and Institutional Industry Emerging as a High-Growth CounterweightThe commercial industry accounted for 62.33% of the market demand in 2025. Offices, hotels, retail properties, and mixed-use buildings use curtain walls to support daylight, views, and a contemporary exterior. Premium commercial buildings also rely on high-performance glazing to improve indoor comfort and energy control. This is especially relevant in the Asia-Pacific and the Middle-East, where large commercial projects are still an important source of installations. Commercial owners often select unitized systems when façade quality, construction timing, and tenant appeal are all important. The glass curtain wall market, therefore, remains closely tied to commercial real estate investment and urban redevelopment.
The public and institutional industry is forecast to grow at a 6.77% CAGR through 2031, the fastest rate among end-use industries. Hospitals, education facilities, and transit projects can require long service life, clear wayfinding, daylight, and resilient envelope performance. Staticus was selected in 2025 to design and deliver a low-carbon unitized façade for the Östra Hospital IVA (intensive care unit) in Gothenburg. In March 2026, Pine Rest Pediatric Center of Behavioral Health opened in Michigan with high-performance windows and a curtain wall as part of its therapeutic design. EFCO’s curtain wall system was installed at Duquesne University’s College of Osteopathic Medicine in 2025, a Leadership in Energy and Environmental Design (LEED) Silver academic facility. These projects show why public and institutional demand can provide a steadier source of work for the glass curtain wall market.

Geography Analysis
APAC Glass Curtain Wall Market
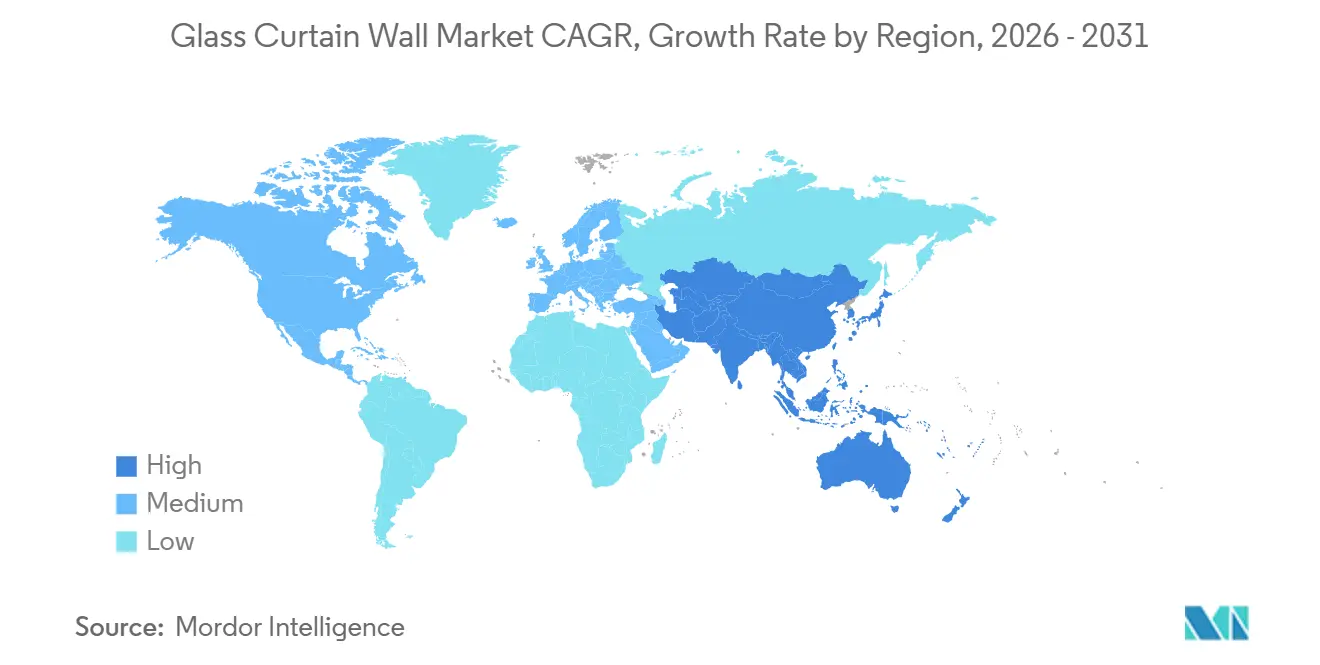
Asia-Pacific held 45.61% of the global revenue in 2025 and is forecast to grow at a 6.82% CAGR through 2031. This gives the region both the largest position and the fastest growth among the listed geographies. The regional glass curtain wall market is supported by commercial high-rise construction, mixed-use development, and large infrastructure projects. China remains an important source of façade demand because of its broad commercial construction base. India adds growth through metropolitan commercial corridors and infrastructure spending. Japan and South Korea are mature markets where renovation, high-specification commercial projects, and seismic performance influence system selection.
North America Glass Curtain Wall Market
In North America, the United States leads installation activity in commercial towers, mixed-use infill, life sciences campuses, and data-center areas. California’s energy code became effective in January 2026, and New York City’s code was enforced from March 30, 2026. These rules make façade thermal performance a central part of specifications in major commercial locations. Canada contributes unitized-system demand through its commercial construction pipeline, while Mexico adds demand from manufacturing and industrial facilities. Permasteelisa is designing and installing 30,157 square feet of unitized curtain wall at San Francisco International Airport Terminal 3 as part of a USD 2.6 billion renovation and expansion project. The project targets LEED Platinum certification and demonstrates the scale of public infrastructure opportunities in the regional glass curtain wall market.
EMEA and South America Glass Curtain Wall Market
Europe’s glass curtain wall market is driven more by renovation than by new commercial construction. The EU directive requires upgrades to the poorest-performing non-residential buildings by 2030 and 2033, and the recovery facility has committed EUR 66 billion to qualifying renovation activity. Germany’s building rules favor façade systems that limit thermal bridging in new construction and deep renovation. The United Kingdom and France remain important renovation markets for commercial property. The Middle-East and Africa gain support from Saudi Arabia’s large Vision 2030 project pipeline and continued commercial development in the UAE. South America remains smaller, with demand centered on commercial properties in major cities and constrained by macroeconomic volatility.

Competitive Landscape
The glass curtain wall market is highly fragmented, with the top five players including AGC Inc., Nippon Sheet Glass Co., Ltd, Saint-Gobain, Guardian Industries, and EFCO Group. Permasteelisa, Schüco, and Kawneer compete through design, engineering, manufacturing, and installation capabilities. Their positions are strongest where projects require complex geometry, demanding performance targets, and extensive coordination. Glass producers such as AGC, Saint-Gobain, and Guardian Industries influence specifications through glazing materials and product development. This structure leaves regional integrators to compete for many mid-sized and locally focused projects. The glass curtain wall market, therefore, combines concentrated high-complexity work with a broader group of regional delivery firms.
Competitive advantage depends on engineering capacity, controlled manufacturing, dependable installation, and a record on demanding projects. Contractors who can coordinate digital models with fabrication and site work can reduce the risk of late design changes. This capability is important in unitized projects, where individual panels must align precisely with the structure and adjacent panels. Firms also compete on their ability to deliver lower-carbon refurbishment work without compromising façade safety or performance. Permasteelisa’s work at 60 Queen Victoria Street is an example of a circular refurbishment approach that retains and reinstalls existing façade elements where possible. This type of contract is becoming more relevant as building owners address embodied carbon alongside energy performance.
Regional fabricators in China, including Jangho Group and Yuanda China Holdings, have expanded from domestic supply into international project delivery. Their presence adds price pressure in international bids where projects are more cost-sensitive. The largest opportunity areas remain low-carbon refurbishment contracting, building-integrated photovoltaic unitized systems, and mid-market delivery in Southeast Asia and Africa. Japanese suppliers such as YKK AP and Nippon Sheet Glass bring material and engineering capabilities that align with demand for airtightness, thermal control, and lower lifecycle impacts. The glass curtain wall market is likely to reward companies that can meet these requirements without increasing project complexity for the owner. Market concentration remains moderate because leading companies are influential in the largest projects, but regional firms continue to serve a substantial share of other installations.
Glass Curtain Wall Industry Leaders
AGC Inc.
Nippon Sheet Glass Co., Ltd
Saint-Gobain
Guardian Industries
EFCO Group
- *Disclaimer: Major Players sorted in no particular order
Glass Curtain Wall Market Companies Covered in this Report
- AGC Inc.
- EFCO GROUP
- G. James Group
- Guardian Industries
- Jansen AG
- Kawneer Company, Inc.
- Nippon Sheet Glass Co., Ltd
- Oldcastle BuildingEnvelope
- Permasteelisa Group
- Saint-Gobain
- Schüco International KG
- Vitro S.A.B. de C.V.
- YKK AP Inc.

Recent Industry Developments in Glass Curtain Wall Market
- April 2026: Kawneer introduced a new unitized glass curtain wall system designed for mid- to high-rise commercial applications. The 2500 UT PLUS achieved an overall system U-factor as low as 0.25 with a 0.20 center of glass value using a 1-inch insulating glass unit, supporting higher energy performance requirements in markets with stringent energy codes, such as Boston and Seattle, while its unitized design streamlined installation.
- January 2026: Permasteelisa North America Benson initiated the installation of the new Terminal 3 façade at San Francisco International Airport, as part of a USD 2.6 billion renovation and expansion project. The 30,157 sq ft unitized curtain wall targeted LEED Platinum certification and a 25% reduction in embodied carbon relative to the industry baseline, with completion scheduled for January 2029.


Global Glass Curtain Wall Market Report Scope
Glass curtain walls are non-load-bearing exterior façade systems that use glass panels supported by lightweight framing, typically aluminum, to enclose buildings. They provide natural daylight, thermal insulation, weather resistance, and architectural aesthetics while improving energy efficiency and occupant comfort in modern construction.
The Glass Curtain Wall Market is segmented by system type, glass type, construction type, end-use industry, and geography. By system type, the market is segmented into unitized system and stick system. By glass type, the market is segmented into insulated glass, tempered glass, laminated glass, low-E glass, and other glass types. By construction type, the market is segmented into new construction and refurbishment. By end-use industry, the market is segmented into commercial, public and institutional, and residential. The report also covers the market size and forecasts for glass curtain walls in 16 countries across major regions. For each segment, the market sizing and forecasts have been done on the basis of value (USD).
| Unitized System |
| Stick System |
| Insulated Glass |
| Tempered Glass |
| Laminated Glass |
| Low-E Glass |
| Other Glass Types |
| New Construction |
| Refurbishment |
| Commercial |
| Public and Institutional |
| Residential |
| Asia-Pacific | China |
| India | |
| Japan | |
| South Korea | |
| Rest of Asia-Pacific | |
| North America | United States |
| Canada | |
| Mexico | |
| Europe | Germany |
| United Kingdom | |
| France | |
| Italy | |
| Russia | |
| Rest of Europe | |
| South America | Brazil |
| Argentina | |
| Rest of South America | |
| Middle-East and Africa | Saudi Arabia |
| South Africa | |
| Rest of Middle-East and Africa |
| By System Type | Unitized System | |
| Stick System | ||
| By Glass Type | Insulated Glass | |
| Tempered Glass | ||
| Laminated Glass | ||
| Low-E Glass | ||
| Other Glass Types | ||
| By Construction Type | New Construction | |
| Refurbishment | ||
| By End-Use Industry | Commercial | |
| Public and Institutional | ||
| Residential | ||
| By Geography | Asia-Pacific | China |
| India | ||
| Japan | ||
| South Korea | ||
| Rest of Asia-Pacific | ||
| North America | United States | |
| Canada | ||
| Mexico | ||
| Europe | Germany | |
| United Kingdom | ||
| France | ||
| Italy | ||
| Russia | ||
| Rest of Europe | ||
| South America | Brazil | |
| Argentina | ||
| Rest of South America | ||
| Middle-East and Africa | Saudi Arabia | |
| South Africa | ||
| Rest of Middle-East and Africa | ||


Key Questions Answered in the Report
What is the size of the glass curtain wall market?
The glass curtain wall market stands at USD 60.22 billion in 2026 and is projected to reach USD 81.14 billion by 2031.
Which system type led the market share in 2025?
Unitized systems led with 66.41% revenue share in 2025. Their factory assembly helps address schedule control, quality consistency, and limited specialized site labor.
Which glass type is expected to grow fastest through 2031?
Low-E glass is projected to grow at a 7.57% CAGR through 2031, supported by stronger thermal and solar-control requirements.
Which construction type is expected to grow fastest through 2031?
Refurbishment is projected to grow at a 7.02% CAGR through 2031 because building owners must improve aging façades to meet current energy and carbon expectations.
Page last updated on:


 Your data is secure and never sold or shared.


