Market Overview
| Study Period | 2020 - 2031 |
|---|---|
| Forecast Data Period | 2026 - 2031 |
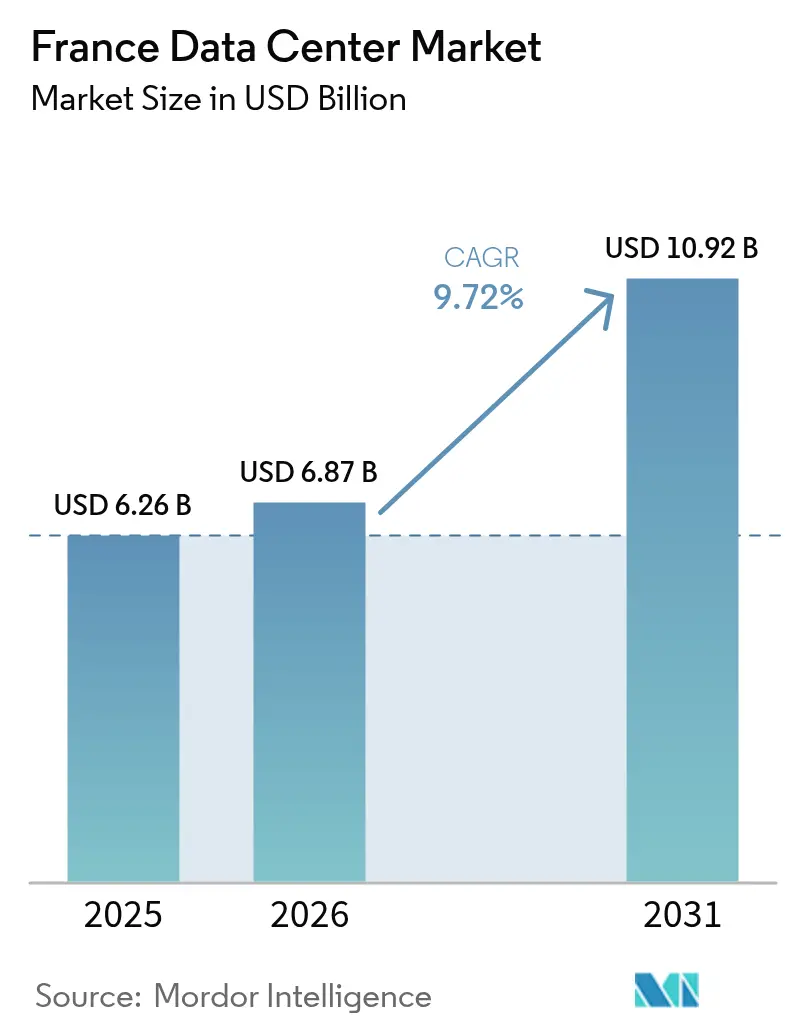
| Base Year Market Size (2025) | USD 6.26 Billion |
| Market Size (2026) | USD 6.87 Billion |
| Market Size (2031) | USD 10.92 Billion |
| Growth Rate (2026 - 2031) | 9.72% CAGR |
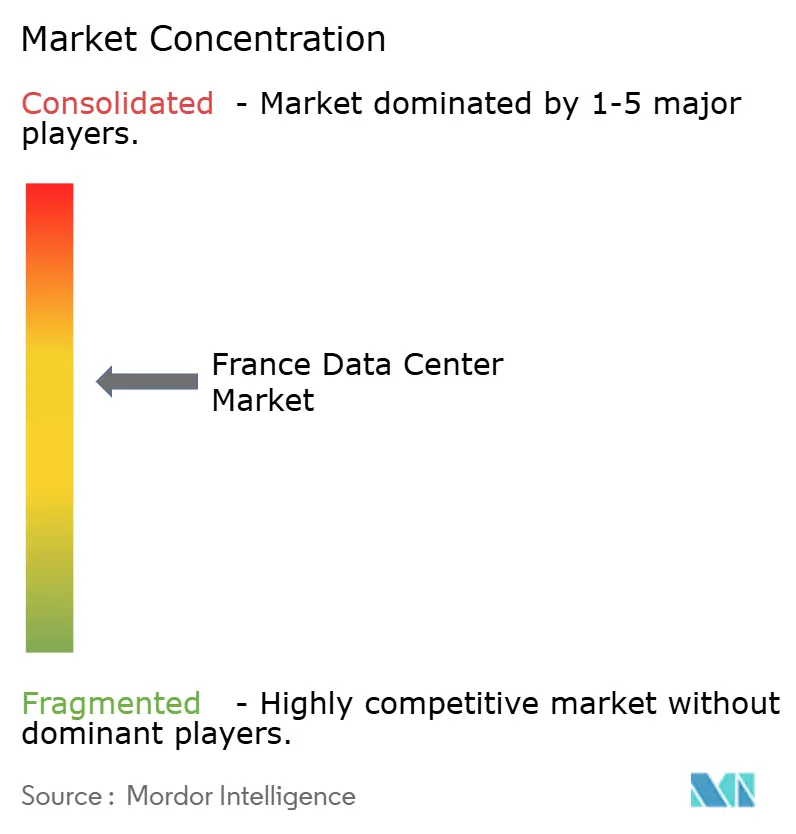
| Market Concentration | Medium |
Major Players *Disclaimer: Major Players sorted in no particular order Image © Mordor Intelligence. Reuse requires attribution under CC BY 4.0. | |
France Data Center Market Analysis by Mordor Intelligence
France data center market size in 2026 is estimated at USD 6.87 billion, growing from 2025 value of USD 6.26 billion with 2031 projections showing USD 10.92 billion, growing at 9.72% CAGR over 2026-2031. The market segment shares and estimates are calculated and reported in terms of MW. France’s nuclear-powered, 94% low-carbon grid underpins competitive hosting economics, while hyperscale investment totaling more than EUR 5.2 billion in 2024 alone signals enduring confidence among operators.[1]Microsoft, “Investing to Accelerate AI Transformation in France,” blogs.microsoft.com The accelerating demand for artificial intelligence is compelling operators to retrofit facilities with liquid cooling and rack densities of 60-250 kW, a shift reinforced by giga-scale projects such as BSO’s 400 MW DataOne campus in Grenoble. Renewable power-purchase agreements, notably Digital Realty’s 100% green energy sourcing across its French footprint, are becoming a baseline customer requirement. Edge build-outs linked to nationwide 5G and fiber rollouts are stimulating regional deployments outside Paris, while government fast-track permits for “Projects of Major National Interest” shorten approval cycles for strategic data-infrastructure projects.
Key Report Takeaways
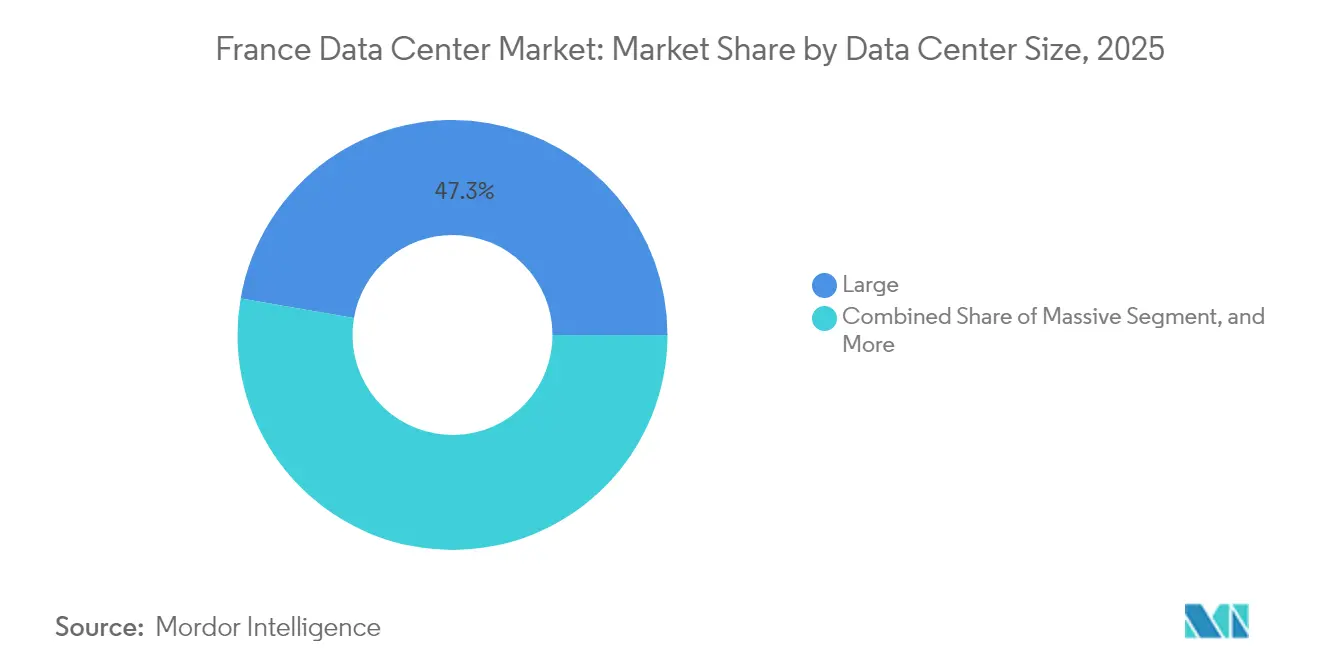
- By data center size, large facilities led the French data center market with a 47.28% share in 2025, while massive campuses are projected to expand at an 17.54% CAGR through 2031.
- By tier, Tier 3 held 78.12% share of the French data center market size in 2025, and Tier 4 is forecast to grow at a 18.86% CAGR through 2031.
- By facility type, colocation accounted for 67.88% of the French data center market size in 2025, whereas hyperscale/self-built facilities recorded the highest 16.74% CAGR through 2031.
- By end user, IT and telecom held a 49.22% share of the French data center market in 2025; BFSI represents the fastest-growing vertical, with a 16.82% CAGR through 2031.
- By hotspot, Île-de-France accounted for 52.35% of the French data center market share in 2025; the Rest of France segment is projected to advance at a 17.81% CAGR through 2031.
Note: Market size and forecast figures in this report are generated using Mordor Intelligence’s proprietary estimation framework, updated with the latest available data and insights as of 2026.
France Data Center Market Trends and Insights
Drivers Impact Analysis*
| Driver | (~) % Impact on CAGR Forecast | Geographic Relevance | Impact Timeline |
|---|---|---|---|
| Rise in AI-Driven and HPC Workloads | +4.2% | Global, with concentration in Île-de-France and emerging Grenoble-Lyon corridor | Short term (≤ 2 years) |
| Accelerated Renewable Energy PPAs for Data Centers | +2.8% | National, with early adoption in Paris metro and Marseille | Medium term (2-4 years) |
| France's Low-Carbon Nuclear Grid Advantage | +3.1% | National coverage with grid stability benefits | Long term (≥ 4 years) |
| Increasing Edge Computing Demand from 5G Roll-outs | +2.3% | National, with priority deployment in major metropolitan areas | Medium term (2-4 years) |
| Government Tax Incentives for Strategic Digital Assets | +1.9% | National, with enhanced benefits for designated industrial zones | Medium term (2-4 years) |
| Underserved Secondary Cities Seeking Local Hosting | +1.4% | Rest of France regions, particularly Lyon, Marseille, Toulouse corridors | Long term (≥ 4 years) |
| Source: Mordor Intelligence | |||


Rise in AI-Driven and HPC Workloads
AI and high-performance computing are reshaping facility design, as liquid-cooling retrofits enable rack densities commonly ranging from 60 kW to 250 kW.[2]BSO, “DataOne: Europe’s First Giga-Scale AI Hosting Data Centre,” bso.co Microsoft’s plan to deploy 25,000 GPUs domestically by the end of 2025 illustrates hyperscale appetite for concentrated compute. Domestic startups, such as Mistral AI, create demand for sovereign hosting that favors local operators committed to ISO 27001 and SOC 2 baselines. Giga-scale campuses like DataOne are purpose-built to sustain year-round GPU utilization with target PUE levels near 1.10. The evolving workload mix is dividing the France data center market between traditional enterprise colocation and AI-optimized megacampuses.
Accelerated Renewable-Energy PPAs for Data Centers
Operators now view long-term renewable PPAs as vital for price stability and ESG compliance. Digital Realty achieved 100% renewable energy across its French sites in 2024, demonstrating that large-scale green procurement is viable at a multi-hundred-megawatt scale.[3]Digital Realty, “Renewable Energy Procurement in France,” digitalrealty.com EDF and TotalEnergies are tailoring wind, hydro, and solar contracts for hyperscale loads, aligning with corporate carbon-neutral mandates. Hyperscalers are factoring guaranteed green-power access into site-selection scoring, shifting emphasis from pure grid-capacity metrics. Regions adjacent to hydro assets in Rhône-Alpes and Occitanie are now favored for new builds, striking a balance between grid stability and renewable availability.
France’s Low-Carbon Nuclear Grid Advantage
Nuclear provides 360 TWh of annual baseload generation, allowing data centers to operate with a fraction of the carbon intensity seen in coal-or gas-reliant grids. This structural feature lets operators market near-zero-carbon colocation without relying solely on certificates or large-scale battery storage. The low-carbon profile helps France attract multinational cloud firms that must satisfy Scope 2 emission targets. Continued fleet maintenance and life-extension programs are essential to sustain the competitive edge as hyperscale load grows rapidly. Stakeholders therefore monitor EDF’s refurbishment roadmap closely when negotiating long-term power contracts.
Increasing Edge Computing Demand from 5G Roll-Outs
National 5G standalone coverage is prompting denser edge nodes, especially around industrial corridors that are adopting Industry 4.0. Operators such as nLighten invest in small-format sites across Marseille, Nice, and Lille that interconnect with national backbone fiber. Edge facilities typically range from 0.5 MW to 2 MW, with a focus on achieving sub-10 millisecond latency to local user clusters. Government fiber-deployment programs underpin inter-data-center backhaul links, making edge economics more attractive outside Paris. Combined, these initiatives accelerate growth in the Rest of France and reinforce the distributed architecture required for latency-sensitive AI inference.
Restraints Impact Analysis*
| Restraint | (~) % Impact on CAGR Forecast | Geographic Relevance | Impact Timeline |
|---|---|---|---|
| Grid Congestion in Paris Metro Ring | -2.1% | Île-de-France region, particularly inner Paris arrondissements | Short term (≤ 2 years) |
| Lengthy Permitting and Environmental Approvals | -1.8% | National, with particular challenges in urban and environmentally sensitive areas | Medium term (2-4 years) |
| Rising Water Scarcity Regulations on Cooling | -1.3% | National, with heightened restrictions in drought-prone southern regions | Medium term (2-4 years) |
| Intensifying Competition from Iberian Hyperscale Hubs | -0.9% | European regional competition affecting cross-border investment flows | Long term (≥ 4 years) |
| Source: Mordor Intelligence | |||
Grid Congestion in Paris Metro Ring
Île-de-France faces structural transmission bottlenecks that delay power connections of 20 MW or more, forcing operators to plan suburban or northern France alternatives. RTE’s ongoing reinforcement projects are expected to alleviate constraints by 2028; however, interim scarcity is inflating interconnection fees and complicating hyperscale timelines. This situation heightens the risk of speculative builds and reinforces the appeal of secondary-city campuses with ready-made grid access. Network-backhaul upgrades partially mitigate latency penalties, but Paris-centric hosting will remain supply-constrained in the near term.
Lengthy Permitting and Environmental Approvals
Although recent reforms have shortened average approval periods, complex ICPE requirements still extend data-center lead times compared to other EU markets.[4]Jones Day, “France Adopts Reindustrialization Measures,” jonesday.com Cooling-system designs that utilize surface water or adiabatic units prompt in-depth environmental reviews, especially in urban areas. Operators pre-certify under ISO 14001 to streamline regulatory engagement, yet land-use hearings and public consultations remain potential flashpoints. The permitting hurdle can add 8-12 months to project schedules for facilities larger than 50 MW, affecting ROI calculations.
*Our forecasts treat driver/restraint impacts as directional, not additive. The impact forecasts reflect baseline growth, mix effects, and variable interactions.
Segment Analysis
By Data Center Size: Massive Facilities Drive Future Growth
Massive facilities captured 52.72% of the French data center market share in 2025, and this category is projected to expand at a 17.54% CAGR through 2031 as hyperscaler demand intensifies. The France data center market size for massive campuses is forecast to nearly triple over the period, reflecting economies of scale in power procurement and liquid-cooling deployment. Operators view mega-plots above 100 MW as strategic assets that enable contiguous build-out phases and unified PPA negotiations.
Large and medium facilities continue to serve enterprise and government tenants who need dedicated cages rather than entire halls. However, investors now prioritize land banks in Rhône-Alpes and Hauts-de-France that can accommodate multi-phase expansions up to 400 MW. In contrast, small sites focus on disaster recovery and edge use cases, where sub-5 MW footprints are sufficient.


By Tier Type: Tier 4 Infrastructure Gains Hyperscale Traction
Tier 3 remained the dominant specification, with a 78.12% share of the French data center market size in 2025. However, Tier 4 capacity is forecasted to accelerate at a 18.86% CAGR through 2031. Hyperscalers require 2N+1 redundancy to guarantee 99.995% availability, prompting operators such as Digital Realty to roll out Tier 4 halls in the suburbs of Marseille and Paris.
Tier 4 adoption also correlates with AI-training workloads that cannot tolerate k-scale job interruptions. The capital-intensive design raises build costs by roughly 35%, which operators offset via multi-year take-or-pay contracts from cloud majors. Tier 1 and Tier 2 facilities remain relevant for backup, edge, and QA environments where cost is a primary consideration, rather than absolute uptime.
By Data Center Type: Hyperscale Builds Challenge Colocation Dominance
Colocation retained 67.88% of the French data center market share in 2025; however, hyperscale/self-built facilities are advancing at a 16.74% CAGR to 2031, as cloud providers favor direct control of cooling and power infrastructure. The France data center market size for hyperscale builds is therefore poised for double-digit annual expansion.
Colocation vendors counter by offering build-to-suit wholesale suites and enhanced interconnection fabrics that de-risk network-egress costs for cloud on-ramps. Enterprise clients still value carrier neutrality and access to national IXPs such as France-IX, compelling colocation operators to invest in cross-connect ecosystems even within predominantly hyperscale halls.

By End User: BFSI Drives Digital-Transformation Demand
IT and telecom accounted for 49.22% France's data center market share in 2025, underscoring its role as both provider and consumer of infrastructure. BFSI workloads, however, are growing at the fastest rate, with a 16.82% CAGR, as banks digitalize payment rails and regulatory reporting. The France data center market size linked to BFSI use cases is expected to more than double by 2031, driven by real-time transaction engines that require sub-5 millisecond latency to trading venues in Paris La Défense.
E-commerce and media workloads add diversity, but BFSI’s stringent compliance triggers demand for ISO 27001, PCI-DSS, and, increasingly, liquid-cooled private cages to secure high-frequency trading algorithms. Operators able to provide sovereign-cloud zones and in-house managed encryption services will capture disproportionate BFSI growth.
Geography Analysis
Île-de-France maintained a 52.35% share of the French data center market in 2025; however, Rest-of-France capacity is forecast to rise at an 17.81% CAGR as projects in Marseille, Grenoble, and Lyon come online. The France data center market size in Rhône-Alpes alone could exceed 865 MW by 2031, led by hydro-powered campuses that offer PUE targets below 1.15. Île-de-France’s entrenched enterprise base, dense fiber mesh, and proximity to key European internet exchanges anchor more than half of the installed capacity. Yet, grid-connection queues exceeding 24 months for requests exceeding 20 MW incentivize operators to site new builds in neighboring Hauts-de-France, where land prices average 35% lower and 400 kV transmission nodes remain underutilized. Cooling innovations such as Equinix’s heat-export agreement for the Olympic Village showcase urban-integration strategies that mitigate power-density constraints.
Marseille leverages 16 submarine-cable landings to provide direct routes to Africa and Asia, which has spurred Digital Realty and Orange to co-develop carrier-neutral hubs. Secondary-city expansion diversifies geographic risk, alleviates congestion on the Paris grid, and supports edge latency objectives vital for 5G and AR/VR applications. Marseille’s transformation into a Mediterranean gateway is propelled by 16 active and planned submarine cables that reduce round-trip latency to North Africa to under 25 milliseconds. Digital Realty’s MRS-series campus positions customers one hop from cable landing stations and offers 100% renewable power backed by EDF hydro assets. These features attract content-delivery networks and gaming platforms, optimizing southbound traffic flows.
Grenoble, Lyon, Toulouse, and Bordeaux headline the Rest-of-France surge. The availability of contiguous land parcels, combined with municipal incentives for circular economy heat reuse, bolsters investment economics. BSO’s 400 MW DataOne development in Grenoble exemplifies the mega-campus model outside Paris, tapping abundant hydro-electric capacity and redirecting waste heat to nearby manufacturing parks. Regional dispersion aligns with corporate latency budgets that accept a 15-millisecond round-trip delay for most enterprise SaaS applications, while avoiding congestion premiums in Île-de-France.
Competitive Landscape
The France data center market hosts 36 operators managing 117 active facilities, a moderate level of fragmentation that rewards scale seekers and niche specialists alike. Digital Realty, Equinix, and Interxion lead colocation share, leveraging carrier-neutral ecosystems and pan-European client rosters. Domestic champion OVHcloud differentiates through locally engineered water-cooling and sovereign-cloud certifications, while DATA4 focuses on modular campus expansion tied to long-term PPAs.
Giga-scale commitments by hyperscalers upend historical colocation dominance. Microsoft’s trio of sites in northern France, Amazon’s self-built projects, and Google’s expansions signal a shift toward operator-owned infrastructure for core cloud regions. Colocation providers counter this by utilizing build-transfer-lease contracts, which monetize land banks while retaining interconnection revenue.
Regional specialists exploit white space in edge and AI hosting. Eclairion targets sovereign “GPU as a Service,” and BSO’s hydro-linked DataOne campus is purpose-built for exascale AI training. Competitive intensity centers on renewable-power hedging: operators with early-stage hydro or wind PPAs lock in margin as wholesale electricity prices fluctuate. Ongoing consolidation, illustrated by telecom-aligned joint ventures, suggests that market share will coalesce around players able to field both hyperscale and edge portfolios at a national scale.
France Data Center Industry Leaders
OVH Groupe SAS
Digital Realty Trust Inc.
Equinix, Inc.
DATA4 Group SAS
Société Française du Radiotéléphone – SFR
- *Disclaimer: Major Players sorted in no particular order

Recent Industry Developments
- May 2025: Prologis announced four hyperscale-ready sites in the greater Paris area, increasing its land inventory for build-to-suit projects.
- April 2025: OVHcloud launched a multi-zone Paris cloud region, strengthening redundancy for enterprise clients.
- February 2025: Eclairion raised EUR 50 million to expand domestic capacity and host Mistral AI clusters.
- February 2025: Equinix opened a new Paris facility, adding 20 MW IT load and extending the vendor’s metropolitan interconnection fabric.
- February 2025: Brookfield and Data4 unveiled a EUR 20 billion AI-infrastructure partnership for multi-country campuses anchored in France.


France Data Center Market Report Scope
Paris (Ile-De-France) are covered as segments by Hotspot. Large, Massive, Medium, Mega, Small are covered as segments by Data Center Size. Tier 1 and 2, Tier 3, Tier 4 are covered as segments by Tier Type. Non-Utilized, Utilized are covered as segments by Absorption.By Data Center Size
| Large |
| Massive |
| Medium |
| Mega |
| Small |
By Tier Type
| Tier 1 and 2 |
| Tier 3 |
| Tier 4 |
By Data Center Type
| Hyperscale/Self-built | ||
| Enterprise/Edge | ||
| Colocation | Non-Utilized | |
| Utilized | Retail Colocation | |
| Wholesale Colocation | ||
By End User
| BFSI |
| IT and ITES |
| E-Commerce |
| Government |
| Manufacturing |
| Media and Entertainment |
| Telecom |
| Other End Users |
By Hotspot
| Île-de-France |
| Rest of France |
| By Data Center Size | Large | ||
| Massive | |||
| Medium | |||
| Mega | |||
| Small | |||
| By Tier Type | Tier 1 and 2 | ||
| Tier 3 | |||
| Tier 4 | |||
| By Data Center Type | Hyperscale/Self-built | ||
| Enterprise/Edge | |||
| Colocation | Non-Utilized | ||
| Utilized | Retail Colocation | ||
| Wholesale Colocation | |||
| By End User | BFSI | ||
| IT and ITES | |||
| E-Commerce | |||
| Government | |||
| Manufacturing | |||
| Media and Entertainment | |||
| Telecom | |||
| Other End Users | |||
| By Hotspot | Île-de-France | ||
| Rest of France | |||


Market Definition
- IT LOAD CAPACITY - The IT load capacity or installed capacity, refers to the amount of energy consumed by servers and network equipments placed in a rack installed. It is measured in megawatt (MW).
- ABSORPTION RATE - It denotes the extend to which the data center capacity has been leased out. For instance, a 100 MW DC has leased out 75 MW, then absorption rate would be 75%. It is also referred as utilization rate and leased-out capacity.
- RAISED FLOOR SPACE - It is an elevated space build over the floor. This gap between the original floor and the elevated floor is used to accommodate wiring, cooling, and other data center equipment. This arrangement assist in having proper wiring and cooling infrastructure. It is measured in square feet (ft^2).
- DATA CENTER SIZE - Data Center Size is segmented based on the raised floor space allocated to the data center facilities. Mega DC - # of Racks must be more than 9000 or RFS (raised floor space) must be more than 225001 Sq. ft; Massive DC - # of Racks must be in between 9000 and 3001 or RFS must be in between 225000 Sq. ft and 75001 Sq. ft; Large DC - # of Racks must be in between 3000 and 801 or RFS must be in between 75000 Sq. ft and 20001 Sq. ft; Medium DC # of Racks must be in between 800 and 201 or RFS must be in between 20000 Sq. ft and 5001 Sq. ft; Small DC - # of Racks must be less than 200 or RFS must be less than 5000 Sq. ft.
- TIER TYPE - According to Uptime Institute the data centers are classified into four tiers based on the proficiencies of redundant equipment of the data center infrastructure. In this segment the data center are segmented as Tier 1,Tier 2, Tier 3 and Tier 4.
- COLOCATION TYPE - The segment is segregated into 3 categories namely Retail, Wholesale and Hyperscale Colocation service. The categorization is done based on the amount of IT load leased out to potential customers. Retail colocation service has leased capacity less than 250 kW; Wholesale colocation services has leased capacity between 251 kW and 4 MW and Hyperscale colocation services has leased capacity more than 4 MW.
- END CONSUMERS - The Data Center Market operates on a B2B basis. BFSI, Government, Cloud Operators, Media and Entertainment, E-Commerce, Telecom and Manufacturing are the major end-consumers in the market studied. The scope only includes colocation service operators catering to the increasing digitalization of the end-user industries.
| Keyword | Definition |
|---|---|
| Rack Unit | Generally referred as U or RU, it is the unit of measurement for the server unit housed in the racks in the data center. 1U is equal to 1.75 inches. |
| Rack Density | It defines the amount of power consumed by the equipment and server housed in a rack. It is measured in kilowatt (kW). This factor plays a critical role in data center design and, cooling and power planning. |
| IT Load Capacity | The IT load capacity or installed capacity, refers to the amount of energy consumed by servers and network equipment placed in a rack installed. It is measured in megawatt (MW). |
| Absorption Rate | It denotes how much of the data center capacity has been leased out. For instance, if a 100 MW DC has leased out 75 MW, then the absorption rate would be 75%. It is also referred to as utilization rate and leased-out capacity. |
| Raised Floor Space | It is an elevated space built over the floor. This gap between the original floor and the elevated floor is used to accommodate wiring, cooling, and other data center equipment. This arrangement assists in having proper wiring and cooling infrastructure. It is measured in square feet/meter. |
| Computer Room Air Conditioner (CRAC) | It is a device used to monitor and maintain the temperature, air circulation, and humidity inside the server room in the data center. |
| Aisle | It is the open space between the rows of racks. This open space is critical for maintaining the optimal temperature (20-25 °C) in the server room. There are primarily two aisles inside the server room, a hot aisle and a cold aisle. |
| Cold Aisle | It is the aisle wherein the front of the rack faces the aisle. Here, chilled air is directed into the aisle so that it can enter the front of the racks and maintain the temperature. |
| Hot Aisle | It is the aisle where the back of the racks faces the aisle. Here, the heat dissipated from the equipment’s in the rack is directed to the outlet vent of the CRAC. |
| Critical Load | It includes the servers and other computer equipment whose uptime is critical for data center operation. |
| Power Usage Effectiveness (PUE) | It is a metric which defines the efficiency of a data center. It is calculated by: (𝑇𝑜𝑡𝑎𝑙 𝐷𝑎𝑡𝑎 𝐶𝑒𝑛𝑡𝑒𝑟 𝐸𝑛𝑒𝑟𝑔𝑦 𝐶𝑜𝑛𝑠𝑢𝑚𝑝𝑡𝑖𝑜𝑛)/(𝑇𝑜𝑡𝑎𝑙 𝐼𝑇 𝐸𝑞𝑢𝑖𝑝𝑚𝑒𝑛𝑡 𝐸𝑛𝑒𝑟𝑔𝑦 𝐶𝑜𝑛𝑠𝑢𝑚𝑝𝑡𝑖𝑜𝑛). Further, a data center with a PUE of 1.2-1.5 is considered highly efficient, whereas, a data center with a PUE >2 is considered highly inefficient. |
| Redundancy | It is defined as a system design wherein additional component (UPS, generators, CRAC) is added so that in case of power outage, equipment failure, the IT equipment should not be affected. |
| Uninterruptible Power Supply (UPS) | It is a device that is connected in series with the utility power supply, storing energy in batteries such that the supply from UPS is continuous to IT equipment even during utility power is snapped. The UPS primarily supports the IT equipment only. |
| Generators | Just like UPS, generators are placed in the data center to ensure an uninterrupted power supply, avoiding downtime. Data center facilities have diesel generators and commonly, 48-hour diesel is stored in the facility to prevent disruption. |
| N | It denotes the tools and equipment required for a data center to function at full load. Only "N" indicates that there is no backup to the equipment in the event of any failure. |
| N+1 | Referred to as 'Need plus one', it denotes the additional equipment setup available to avoid downtime in case of failure. A data center is considered N+1 when there is one additional unit for every 4 components. For instance, if a data center has 4 UPS systems, then for to achieve N+1, an additional UPS system would be required. |
| 2N | It refers to fully redundant design wherein two independent power distribution system is deployed. Therefore, in the event of a complete failure of one distribution system, the other system will still supply power to the data center. |
| In-Row Cooling | It is the cooling design system installed between racks in a row where it draws warm air from the hot aisle and supplies cool air to the cold aisle, thereby maintaining the temperature. |
| Tier 1 | Tier classification determines the preparedness of a data center facility to sustain data center operation. A data center is classified as Tier 1 data center when it has a non-redundant (N) power component (UPS, generators), cooling components, and power distribution system (from utility power grids). The Tier 1 data center has an uptime of 99.67% and an annual downtime of <28.8 hours. |
| Tier 2 | A data center is classified as Tier 2 data center when it has a redundant power and cooling components (N+1) and a single non-redundant distribution system. Redundant components include extra generators, UPS, chillers, heat rejection equipment, and fuel tanks. The Tier 2 data center has an uptime of 99.74% and an annual downtime of <22 hours. |
| Tier 3 | A data center having redundant power and cooling components and multiple power distribution systems is referred to as a Tier 3 data center. The facility is resistant to planned (facility maintenance) and unplanned (power outage, cooling failure) disruption. The Tier 3 data center has an uptime of 99.98% and an annual downtime of <1.6 hours. |
| Tier 4 | It is the most tolerant type of data center. A Tier 4 data center has multiple, independent redundant power and cooling components and multiple power distribution paths. All IT equipment are dual powered, making them fault tolerant in case of any disruption, thereby ensuring interrupted operation. The Tier 4 data center has an uptime of 99.74% and an annual downtime of <26.3 minutes. |
| Small Data Center | Data center that has floor space area of ≤ 5,000 Sq. ft or the number of racks that can be installed is ≤ 200 is classified as a small data center. |
| Medium Data Center | Data center which has floor space area between 5,001-20,000 Sq. ft, or the number of racks that can be installed is between 201-800, is classified as a medium data center. |
| Large Data Center | Data center which has floor space area between 20,001-75,000 Sq. ft, or the number of racks that can be installed is between 801-3,000, is classified as a large data center. |
| Massive Data Center | Data center which has floor space area between 75,001-225,000 Sq. ft, or the number of racks that can be installed is between 3001-9,000, is classified as a massive data center. |
| Mega Data Center | Data center that has a floor space area of ≥ 225,001 Sq. ft or the number of racks that can be installed is ≥ 9001 is classified as a mega data center. |
| Retail Colocation | It refers to those customers who have a capacity requirement of 250 kW or less. These services are majorly opted by small and medium enterprises (SMEs). |
| Wholesale Colocation | It refers to those customers who have a capacity requirement between 250 kW to 4 MW. These services are majorly opted by medium to large enterprises. |
| Hyperscale Colocation | It refers to those customers who have a capacity requirement greater than 4 MW. The hyperscale demand primarily originates from large-scale cloud players, IT companies, BFSI, and OTT players (like Netflix, Hulu, and HBO+). |
| Mobile Data Speed | It is the mobile internet speed a user experiences via their smartphones. This speed is primarily dependent on the carrier technology being used in the smartphone. The carrier technologies available in the market are 2G, 3G, 4G, and 5G, where 2G provides the slowest speed while 5G is the fastest. |
| Fiber Connectivity Network | It is a network of optical fiber cables deployed across the country, connecting rural and urban regions with high-speed internet connection. It is measured in kilometer (km). |
| Data Traffic per Smartphone | It is a measure of average data consumption by a smartphone user in a month. It is measured in gigabyte (GB). |
| Broadband Data Speed | It is the internet speed that is supplied over the fixed cable connection. Commonly, copper cable and optic fiber cable are used in both residential and commercial use. Here, optic cable fiber provides faster internet speed than copper cable. |
| Submarine Cable | A submarine cable is a fiber optic cable laid down at two or more landing points. Through this cable, communication and internet connectivity between countries across the globe is established. These cables can transmit 100-200 terabits per second (Tbps) from one point to another. |
| Carbon Footprint | It is the measure of carbon dioxide generated during the regular operation of a data center. Since, coal, and oil & gas are the primary source of power generation, consumption of this power contributes to carbon emissions. Data center operators are incorporating renewable energy sources to curb the carbon footprint emerging in their facilities. |


Research Methodology
Mordor Intelligence follows a four-step methodology in all our reports.
- Step-1: Identify Key Variables: In order to build a robust forecasting methodology, the variables and factors identified in Step-1 are tested against available historical market numbers. Through an iterative process, the variables required for market forecast are set and the model is built on the basis of these variables.
- Step-2: Build a Market Model: Market-size estimations for the forecast years are in nominal terms. Inflation is not a part of the pricing, and the average selling price (ASP) is kept constant throughout the forecast period for each country.
- Step-3: Validate and Finalize: In this important step, all market numbers, variables and analyst calls are validated through an extensive network of primary research experts from the market studied. The respondents are selected across levels and functions to generate a holistic picture of the market studied.
- Step-4: Research Outputs: Syndicated Reports, Custom Consulting Assignments, Databases & Subscription Platforms


