Market Overview
| Study Period | 2020 - 2031 |
|---|---|
| Forecast Data Period | 2026 - 2031 |
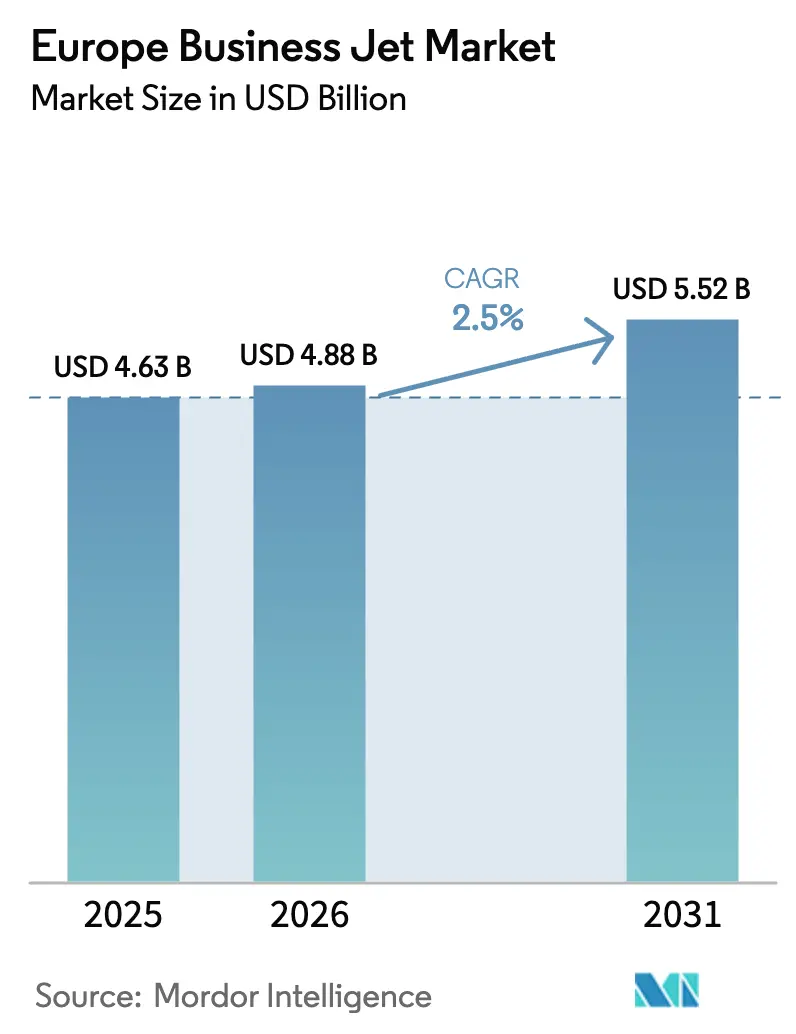
| Base Year Market Size (2025) | USD 4.63 Billion |
| Market Size (2026) | USD 4.88 Billion |
| Market Size (2031) | USD 5.52 Billion |
| Growth Rate (2026 - 2031) | 2.50% CAGR |
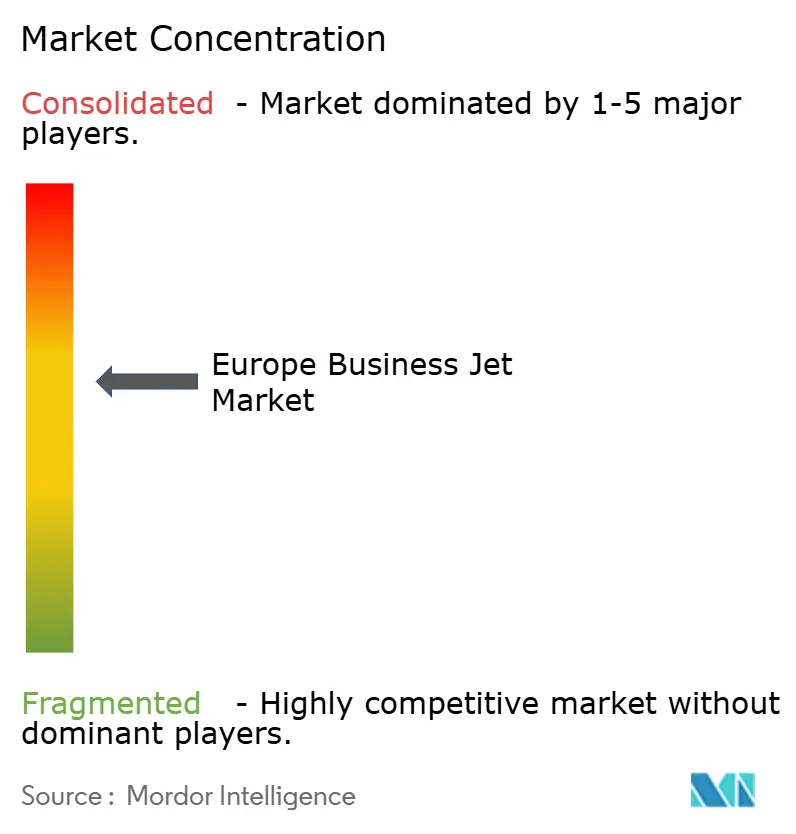
| Market Concentration | Medium |
Major Players *Disclaimer: Major Players sorted in no particular order Image © Mordor Intelligence. Reuse requires attribution under CC BY 4.0. | |
Europe Business Jet Market Analysis by Mordor Intelligence
The Europe business jet market size is expected to grow from USD 4.63 billion in 2025 to USD 4.88 billion in 2026 and is forecasted to reach USD 5.52 billion by 2031 at a 2.5% CAGR over 2026-2031. Demand is being shaped by a post-pandemic shift toward “bleisure” travel, which combines corporate trips with leisure extensions, steadily increasing fleet utilization, and diversifying routes.[1]European Business Aviation Association, “Market Overview and Industry Statistics,” ebaa.org Corporations are accelerating aircraft-replacement cycles to meet Scope 3 emissions disclosures under the Corporate Sustainability Reporting Directive, and buyers are gravitating toward models that burn less fuel and accept high blends of Sustainable Aviation Fuel (SAF). A growing cohort of ultra-high-net-worth millennials is nudging operators toward digital booking, real-time connectivity, and greener propulsion, which, in turn, is encouraging OEMs to invest in avionics and hybrid-electric systems. Advanced air-mobility research, particularly in batteries and electric taxiing, is already influencing conventional jet programs, enabling operators to reduce ground emissions and noise at slot-constrained airports.
Key Report Takeaways
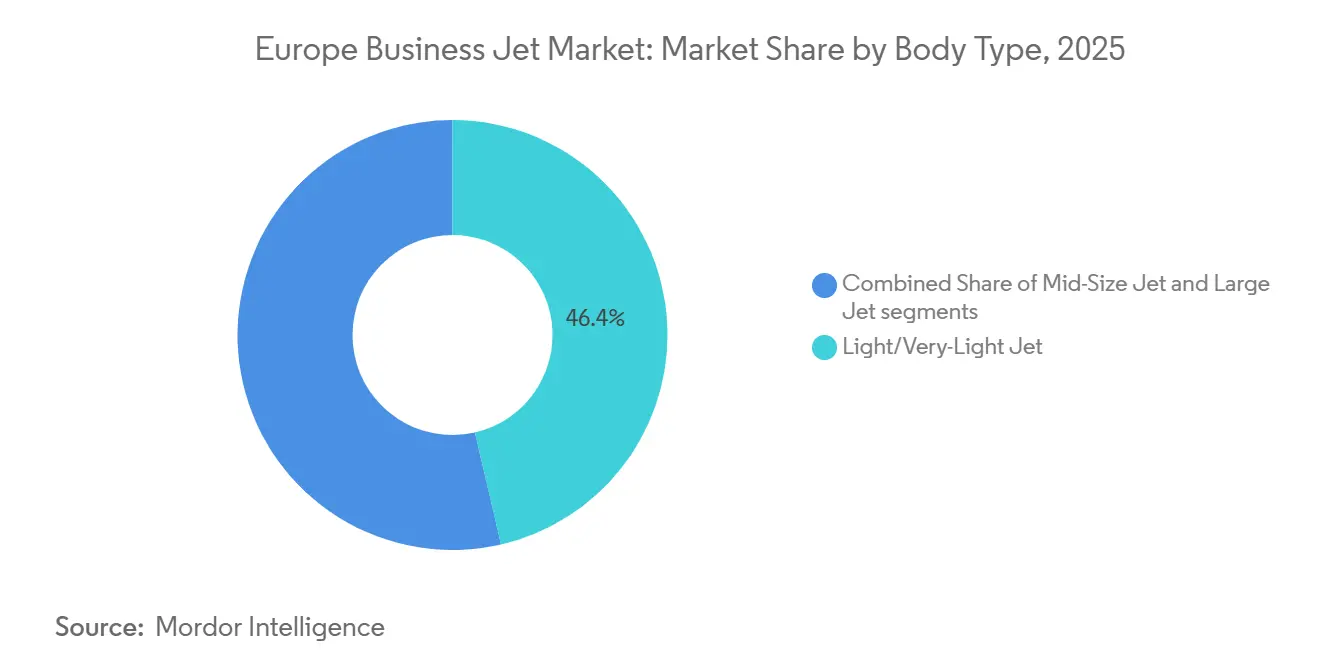
- By body type, light and very-light jets accounted for 46.38% of the Europe business jet market in 2025, however, large-cabin models are poised to grow at a 3.87% VAGR.
- By end user, businesses and corporate entities accounted for 42.48% of the Europe business jet market size in 2025. In contrast, government and special-mission operators are poised to grow at a 3.91% CAGR to 2031.
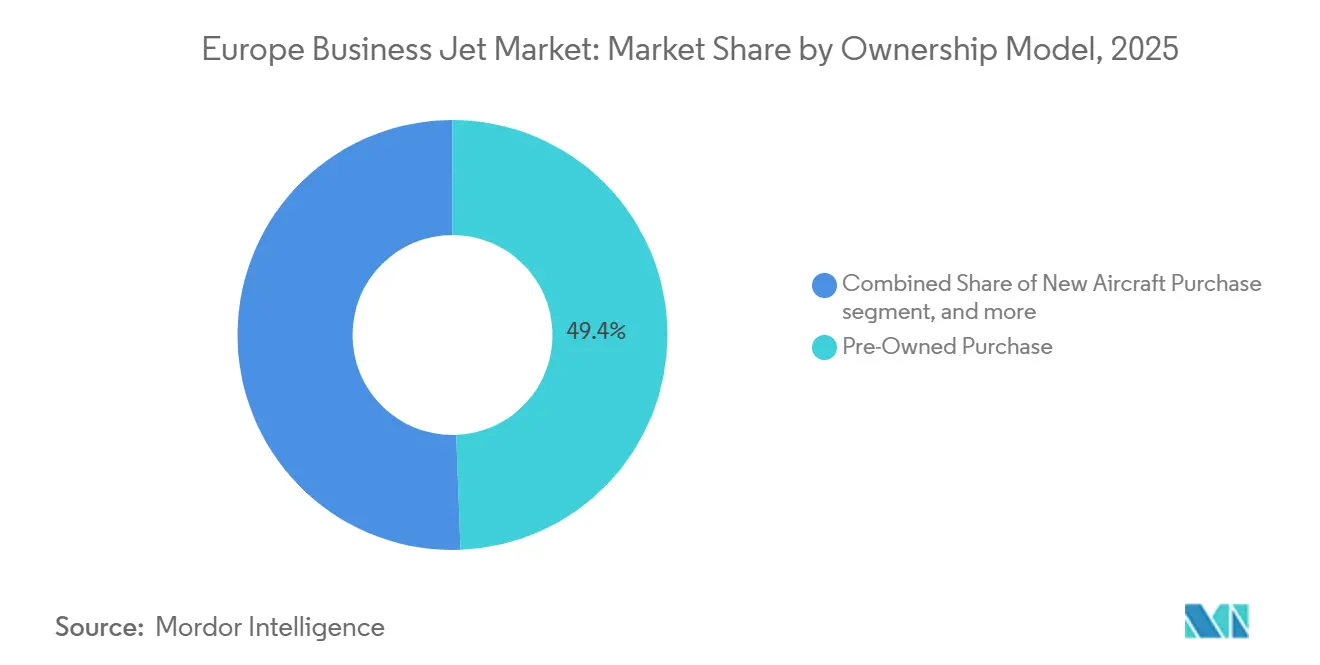
- By ownership model, pre-owned aircraft accounted for 49.40% of the Europe business jet market size in 2025; fractional ownership is projected to rise at a 4.58% CAGR between 2026 and 2031.
- By geography, the United Kingdom held 21.58% of the Europe business jet market size in 2025; Spain is on track for the fastest growth at a 3.49% CAGR through 2031.rough 2031.
Note: Market size and forecast figures in this report are generated using Mordor Intelligence’s proprietary estimation framework, updated with the latest available data and insights as of January 2026.
Europe Business Jet Market Trends and Insights
Driver Impact Analysis*
| Driver | (~) % Impact on CAGR Forecast | Geographic Relevance | Impact Timeline |
|---|---|---|---|
| Post-pandemic “bleisure” travel rebound | +0.80% | UK, Germany, France first movers | Medium term (2-4 years) |
| Growing share of ultra-high-net-worth millennials | +0.60% | Western Europe core, spill-over to CEE | Long term (≥ 4 years) |
| Corporate sustainability KPIs pushing fleet renewals | +0.70% | EU-27 and UK | Medium term (2-4 years) |
| Digitization of charter brokerage platforms | +0.40% | Tech-forward markets EU-wide | Short term (≤ 2 years) |
| Advanced air-mobility spill-over technologies | +0.30% | Nordic early adopters | Long term (≥ 4 years) |
| EASA’s flexible STC rules for cabin retrofits | +0.20% | All EASA states | Short term (≤ 2 years) |
| Source: Mordor Intelligence | |||


Post-pandemic “bleisure” travel rebound accelerates European demand patterns
Executives now tag leisure days onto business itineraries, boosting average trip length and lifting private flight hours 23% above 2019 levels.[2]Jetcraft, “Global Business Aviation Market Report 2024,” jetcraft.com The Barcelona-Nice-Monaco corridor experienced a 31% growth in 2024, as travelers combined meetings with downtime on the coast. Larger cabins that integrate high-speed connectivity are in favor because passengers expect productive workspaces even on leisure-infused trips. Airlines have not matched these hybrid schedules, so private operators capture the overflow, mainly on Mediterranean routes with limited commercial frequencies. EASA eased crew-duty rules in 2024, letting operators roster multi-day missions without breaching fatigue limits, which supports the new travel cadence.
Growing share of ultra-high-net-worth millennials reshapes European aviation preferences
Millennial UHNWIs now constitute 18% of the region’s wealthy population and control EUR 2.1 trillion (USD 2.42 trillion) in assets. Their digital-first mindset drives charter app downloads, with online platforms accounting for 34% of all European charter bookings in 2024. This group prefers fractional programs that free them from depreciation risk, which pushes the model’s CAGR to 4.58% through 2031. Sustainability is critical; 67% say they will pay a premium for carbon-neutral flights, a rate double that of older cohorts. Operators react by embedding SAF purchase options into booking workflows and by installing real-time emissions trackers. Interior layouts are evolving toward convertible lounge-work zones, catering to travelers who treat the cabin as both office and living room.
Corporate sustainability KPIs push European fleet renewals beyond traditional cycles
The CSRD, effective since 2024, requires large companies to disclose Scope 3 emissions, prompting corporate flight departments to reevaluate their aging aircraft sooner than the historical 10-to 12-year window. Newer jets reduce fuel burn by 15-25% and can accept higher SAF blends, a vital edge as the ReFuelEU Aviation rule requires a 2% SAF blend by 2025 and a 6% blend by 2030.[3]AeroTime Hub, “Digital Charter Platform Market Analysis,” aerotime.aero Early adopters, such as pharmaceutical multinationals, replaced their fleets two to three years ahead of schedule, citing emissions credits and brand image considerations. Most operators now utilize carbon-accounting software that generates per-leg reports, and 73% had these tools in place by the end of 2024. OEMs that deliver high-bypass engines and lighter airframes gain pricing power by helping buyers exceed compliance thresholds.
Digitization of charter brokerage platforms transforms European market access
Real-time booking engines compress inquiry-to-contract times from hours to minutes, contributing to spontaneous travel and higher aircraft utilization. Dynamic pricing algorithms reveal seat-by-seat costs, eroding the information asymmetry that long protected legacy brokers. Some platforms are piloting blockchain smart contracts that automate escrow, maintenance accruals, and fractional-share settlements, reducing back-office costs by 25%. EASA’s pivot to digital certification allows new entrants to file paperwork entirely online, slashing start-up timelines by 40% for Part 135 operators. The outcome is a more liquid secondary charter market, where last-minute empty legs are monetized, thereby reducing deadhead miles and lowering carbon emissions.
Restraints Impact Analysis*
| RESTRAINT | (~) % IMPACT ON CAGR FORECAST | GEOGRAPHIC RELEVANCE | IMPACT TIMELINE |
|---|---|---|---|
| Inflation-induced OEM list price escalation | -0.90% | Europe-wide | Short term (≤ 2 years) |
| Slot scarcity at secondary airports | -0.40% | UK and Germany hubs | Medium term (2-4 years) |
| SAF supply-demand mismatch in Europe | -0.60% | EU-27, EFTA | Medium term (2-4 years) |
| Ongoing Russia-related air-space restrictions | -0.70% | All Europe, heavy East impact | Long term (≥ 4 years) |
| Source: Mordor Intelligence | |||
Inflation-induced OEM list-price escalation constrains market expansion
List prices for flagship models such as the G650ER rose by 8-12% per year after 2022, far above wage and GDP growth rates. Surging titanium and composite costs, up 25-35%, compel OEMs to pass through repeated increases. New-delivery deferrals increased in 2024 as buyers shifted toward refurbished aircraft, driving pre-owned transactions up 18% while new shipments declined 7%. The mid-size sub-segment suffers most because corporate finance departments scrutinize cost per seat mile more heavily than cabin luxury. Currency volatility adds 3-5% to acquisition uncertainty, leading operators to adopt hedging and extended letters of credit to buffer USD-denominated invoices.
Slot scarcity at secondary airports limits business-aviation flexibility
Movements at London Luton expanded by 15% annually, yet slot availability rose by only 3%, resulting in a squeeze on peak-hour capacity. Infrastructure funding shortfalls at Farnborough and Düsseldorf-Mönchengladbach delay runway or apron extensions, leaving operators to accept off-peak slots or reposition aircraft. Regulatory frameworks favor commercial airlines when allocating scarce capacity, and handling fees for business jets climbed 12-18% in 2024. The result erodes one of private aviation’s prime selling points: on-demand scheduling. Operators often reroute to tertiary airfields, adding ground-transfer times that erode the door-to-door speed advantage.
*Our forecasts treat driver/restraint impacts as directional, not additive. The impact forecasts reflect baseline growth, mix effects, and variable interactions.
Segment Analysis
By Body Type: Light jets hold the crown while large jets gather momentum
Light and very-light jets controlled 46.38% of the Europe business jet market in 2025, validated by their ability to hop among Europe’s dense network of mid-range cities while using shorter runways. Fleet managers value their lower hourly operating costs and compliance with Chapter 14 noise limits, which are a key component of Western European airport regulations. Large-cabin models, however, are projected to post the robust growth, with a 3.87% CAGR, as they can clear Russian airspace bottlenecks by flying nonstop on longer polar or Middle Eastern routes. Operators serving C-suite teams favor these cabins for lie-flat productivity and for enabling bleisure-oriented itineraries that fold leisure destinations into long-haul corporate schedules.
Rising charter rates for light jets, driven by strong demand and limited supply, prompt some customers to consider fractional solutions, where hourly costs can be locked in for several years, thereby stabilizing budgets. Large-jet OEMs are incorporating advanced acoustics and blended-winglets to reduce fuel consumption per nautical mile and pave the way for SAF blends exceeding 50%, ensuring regulatory readiness. Meanwhile, mid-size jets remain relevant on intra-EU routes under 2,000 nautical miles, striking a balance between payload and runway performance. Competitive differentiation now revolves around cabin connectivity, with light-jet makers fitting Ka-band antennas once reserved for heavier aircraft, thereby sustaining their market-leading utilization rates.


By End User: Corporate dominance persists yet government demand accelerates
Businesses and corporate entities accounted for 42.48% of the Europe business jet market in 2025, deriving value from privacy, security, and time-efficient multi-stop itineraries. Post-pandemic boardroom protocols now prioritize health security alongside productivity, prompting firms to retain private aviation in their travel policies even as scheduled airlines rebound. The Europe business jet market continues to attract first-time corporate users who discovered private charters during the 2021 lockdowns and have retained them for critical travel.
Government and special-mission operators exhibit the fastest growth, at a 3.91% CAGR through 2031, driven by NATO commitments and increased diplomatic activity. Orders span surveillance-ready Falcon 2000LXS variants and medevac-configured Challenger 650s, which guarantee multi-role flexibility and contract longevity. Academic institutions and training schools remain a minor slice, yet they benefit from reduced STC lead times that allow for bespoke avionics installations for research missions. Individual owners, many of whom are next-gen entrepreneurs, still value full ownership for lifestyle branding purposes. Still, an expanding set migrates to jet-card or fractional models that cap exposure to maintenance inflation.
By Ownership Model: Pre-owned prevalence meets fractional innovation
At 49.40%, pre-owned transactions dominate because they offer immediate delivery and discount pricing compared to a new-build queue that can stretch up to 36 months for popular models. The Europe business jet market particularly prizes late-model aircraft with low cycles that can be retrofitted under the new STC regime at a low cost, delivering near-factory interior standards.
Fractional ownership is projected to grow at a 4.58% CAGR, the strongest among all models, thanks to digital platforms that streamline share resale, maintenance scheduling, and cost allocation. Millennial wealth holders prefer to diversify their assets rather than lock capital into depreciating airframes, and corporations like NetJets deepen market penetration by guaranteeing availability even at saturated airports. Jet-card programs provide an entry ramp for occasional flyers and also serve as risk-management tools for firms that lack dedicated flight departments. OEM-linked leasing arms also use them to place still-in-production aircraft in short-term pools, keeping residual values buoyant.
Geography Analysis
Western Europe retained its primacy, with the UK leading at a 21.58% share in 2025, underpinned by London’s financial services cluster and a mature secondary airport network that stretches from Biggin Hill to Farnborough. Brexit introduced additional permit steps for EU trips; however, most operators adapted through traffic rights management software and bilateral slot coordination. Germany anchors central Europe’s industrial supply chain, and its corporate champions rely on private aviation to knit together manufacturing plants spread across multiple states. France benefits from Paris’s luxury ecosystem and strong OEM presence, which provides maintenance capacity that minimizes downtime.
Spain is the standout high-growth story, tracking a 3.49% CAGR on the back of Mediterranean corridor expansion and state-backed terminal upgrades at Barcelona, Valencia, and Palma de Mallorca. Improved ground infrastructure shortens turnarounds and frees slots, luring operators who once avoided Spain due to congestion. Italy remains a leisure-heavy market, with Milan and Rome airports supporting fashion and finance traffic that rises sharply in show seasons. The Netherlands, through Amsterdam’s Schiphol and a favorable tax scheme for aircraft registration, maintains a niche role as a handover hub for transatlantic repositioning.
Eastern European recovery is slower but visible, as evidenced by Poland and the Czech Republic, which attract foreign direct investment, thereby spurring demand for light jets to serve secondary cities not served by commercial airlines. Yet geopolitical friction restrains routes east of the Baltics, sustaining a cautious expansion trajectory. Over 2026-2031, Western Europe is forecast to post a 2.6% CAGR, slightly trailing Southern Europe’s 3.1% yet still adding meaningful fleet numbers due to replacement cycles and sustainability mandates that promote the early retirement of less efficient types.

Competitive Landscape
Market concentration is moderate. Bombardier, Gulfstream, and Dassault together deliver roughly 60% of new aircraft, but the remaining 40% is fragmented among Embraer, Textron, Honda, Pilatus, and Airbus Corporate Jets. OEMs pivot from pure manufacturing to lifecycle revenue, acquiring MRO shops and launching app-based service subscriptions that bundle maintenance, connectivity, and flight-planning. Gulfstream’s EUR 150 million (USD 172.94 million) expansion at Appleton opens 50,000 square feet dedicated to G650 and G700 support, chopping turnaround times by 25% and tying customers more closely to factory networks.
Fractional-ownership giants Flexjet and NetJets escalate fleet orders, pressuring OEMs to offer volume discounts and bespoke cabin schemes that optimize shareability. NetJets’ August 2024 commitment for 25 Bombardier Challenger 3500s reflects 40% year-on-year growth in fractional demand. Digital charter platforms, such as Victor and JetApp, leverage transparent pricing and instant booking to challenge legacy brokers, introducing a margin squeeze that forces them to differentiate through personalized concierge services.
Technology is the new battleground. Dassault leverages its fighter-jet pedigree to add advanced fly-by-wire technology to Falcon business jets, while Embraer embeds predictive-maintenance analytics that reduce unscheduled events by 30%. Collaboration with SAF suppliers, such as Neste, bolsters brand positioning, as many charter customers now request carbon-neutral flights at the time of booking. Regulatory compliance also shapes competition; OEMs with embedded European engineering teams expedite EASA validations and secure early-delivery slots, whereas newcomers endure longer approval loops that erode their time-to-market advantage.
Europe Business Jet Industry Leaders
Bombardier Inc.
Gulfstream Aerospace Corporation (General Dynamics Corporation)
Dassault Aviation SA
Textron Inc.
Embraer S.A.
- *Disclaimer: Major Players sorted in no particular order

Recent Industry Developments
- July 2025: Luxaviation expanded its UK fleet by adding a second Embraer Praetor 600. Now charter-ready, the new aircraft is stationed in London and operated by Luxaviation San Marino, with oversight from Luxaviation UK. The Praetor 600 boasts a range of 4,000 nautical miles (4,600 miles) and speeds of 863 km/h. Its ability to take off from runways as short as 3,000 feet enables non-stop flights on sought-after routes, including London-Ibiza during the summer and London-Dubai in autumn and winter. Designed for up to nine passengers and three crew members, the aircraft features premium seating that transforms into four lie-flat beds, complemented by a three-seat divan at the rear. Onboard, guests enjoy high-speed Wi-Fi, Apple TV, and a comprehensive entertainment suite.
- February 2025: Flexjet (LXJ) inked a purchase agreement with Embraer Executive Jets, securing 182 aircraft with an option for an additional 30, in a deal potentially worth up to USD 7 billion. The order predominantly features the Praetor 500 and Praetor 600 models, supplemented by several Phenom 300E jets. Additionally, the agreement boasts an enhanced services and support package. This deal not only stands as the largest in Flexjet's three-decade history but also marks the most substantial single order ever made with Embraer Executive Jets. With an eye on broadening its clientele in the Middle East, the fractional ownership specialist is actively considering basing aircraft there, furthering its European operational expansion.


Europe Business Jet Market Report Scope
A business jet is a private aircraft designed for transporting small groups of passengers, typically business executives, high-net-worth individuals, government officials, or specialized mission operators. It offers flexibility, privacy, and time efficiency compared to commercial aviation. The study of the Europe business jet market encompasses sales, leasing, fractional ownership, and membership-based access to business aircraft across various body types and ownership models. The market includes new aircraft purchases, pre-owned aircraft transactions, fractional ownership programs, and jet card or membership-based services that provide on-demand access to business aviation. It covers aircraft used for corporate transportation, individual private travel, charter and air taxi operations, training and academic purposes, and government or special mission applications across Europe.
The Europe business jet market is segmented by body type, end user, ownership model, and geography. By body type, the market is segmented into large, mid-size, and light/very light jets. By end user, the market is segmented into individual owners, businesses, corporate entities, charter/air taxi operators, training and academic institutions, and government and special mission operators. By ownership model, the market is segmented into new aircraft purchase, pre-owned purchase, fractional ownership, and jet cards/membership programs. The report also offers the market size and forecasts for eight regional countries. For each segment, the market sizes and forecasts are provided in terms of value (USD).
By Body Type
| Large Jet |
| Mid-Size Jet |
| Light/Very-Light Jet |
By End User
| Individual Owners |
| Businesses and Corporate Entities |
| Charter/Air-Taxi Operators |
| Training and Academic Institutions |
| Government and Special-Mission Operators |
By Ownership Model
| New Aircraft Purchase |
| Pre-Owned Purchase |
| Fractional Ownership |
| Jet Cards/Membership |
By Geography
| Germany |
| United Kingdom |
| France |
| Italy |
| Spain |
| Netherlands |
| Russia |
| Rest of Europe |
| By Body Type | Large Jet |
| Mid-Size Jet | |
| Light/Very-Light Jet | |
| By End User | Individual Owners |
| Businesses and Corporate Entities | |
| Charter/Air-Taxi Operators | |
| Training and Academic Institutions | |
| Government and Special-Mission Operators | |
| By Ownership Model | New Aircraft Purchase |
| Pre-Owned Purchase | |
| Fractional Ownership | |
| Jet Cards/Membership | |
| By Geography | Germany |
| United Kingdom | |
| France | |
| Italy | |
| Spain | |
| Netherlands | |
| Russia | |
| Rest of Europe |


Market Definition
- Aircraft Type - General Aviation includes aircraft used for corporate aviation, business aviation and other aerial works.
- Sub-Aircraft Type - Business Jets which are private jets and are designed to carry small groups of people and are used for various roles are included in this study.
- Body Type - Light Jets, Mid-Size Jets, and Large Jets according to their ability to carry passengers and flying distance ranges have been included under this study.
| Keyword | Definition |
|---|---|
| IATA | IATA stands for the International Air Transport Association, a trade organization composed of airlines around the world that has an influence over the commercial aspects of flight. |
| ICAO | ICAO stands for International Civil Aviation Organization, a specialized agency of the United Nations that supports aviation and navigation around the globe. |
| Air Operator Certificate (AOC) | A certificate granted by a National Aviation Authority permitting the conduct of commercial flying activities. |
| Certificate Of Airworthiness (CoA) | A Certificate Of Airworthiness (CoA) is issued for an aircraft by the civil aviation authority in the state in which the aircraft is registered. |
| Gross Domestic Product (GDP) | Gross domestic product (GDP) is a monetary measure of the market value of all the final goods and services produced in a specific time period by countries. |
| RPK (Revenue Passenger Kilometres) | The RPK of an airline is the sum of the products obtained by multiplying the number of revenue passengers carried on each flight stage by the stage distance - it is the total number of kilometers traveled by all revenue passengers. |
| Load Factor | The load factor is a metric used in the airline industry that measures the percentage of available seating capacity that has been filled with passengers. |
| Original Equipment Manufacturer (OEM) | An original equipment manufacturer (OEM) traditionally is defined as a company whose goods are used as components in the products of another company, which then sells the finished item to users. |
| International Transportation Safety Association (ITSA) | International Transportation Safety Association (ITSA) is an international network of heads of independent safety investigation authorities (SIA). |
| Available Seats Kilometre (ASK) | This metric is calculated by multiplying Available Seats (AS) in one flight, defined above, multiplied by the distance flown. |
| Gross Weight | The fully-loaded weight of an aircraft, also known as “takeoff weight,” which includes the combined weight of passengers, cargo, and fuel. |
| Airworthiness | The ability of an aircraft, or other airborne equipment or system, to operate in flight and on the ground without significant hazard to aircrew, ground crew, passengers or to other third parties. |
| Airworthiness Standards | Detailed and comprehensive design and safety criteria applicable to the category of aeronautical product (aircraft, engine or propeller). |
| Fixed Base Operator (FBO) | A business or organization that operates at an airport. An FBO provides aircraft operating services like maintenance, fueling, flight training, charter services, hangaring, and parking. |
| High Net worth Individuals (HNWIs) | High Net worth Individuals (HNWIs) are individuals with over USD 1 million in liquid financial assets. |
| Ultra High Net worth Individuals (UHNWIs) | Ultra High Net worth Individuals (UHNWIs) are individuals with over USD 30 million in liquid financial assets. |
| Federal Aviation Administration (FAA) | The division of the Department of Transportation is concerned with aviation. It operates Air Traffic Control and regulates everything from aircraft manufacturing to pilot training to airport operations in the United States. |
| EASA (European Aviation Safety Agency) | The European Aviation Safety Agency is a European Union agency established in 2002 with the task of overseeing civil aviation safety and regulation. |
| Airborne Warning and Control System (AW&C) aircraft | Airborne Warning and Control System (AEW&C) aircraft is equipped with a powerful radar and on-board command and control center to direct the armed forces. |
| The North Atlantic Treaty Organization (NATO) | The North Atlantic Treaty Organization (NATO), also called the North Atlantic Alliance, is an intergovernmental military alliance between 30 member states – 28 European and two North American. |
| Joint Strike Fighter (JSF) | Joint Strike Fighter (JSF) is a development and acquisition program intended to replace a wide range of existing fighter, strike, and ground attack aircraft for the United States, the United Kingdom, Italy, Canada, Australia, the Netherlands, Denmark, Norway, and formerly Turkey. |
| Light Combat Aircraft (LCA) | A light combat aircraft (LCA) is a light, multirole jet/turboprop military aircraft, commonly derived from advanced trainer designs, designed for engaging in light combat. |
| Stockholm International Peace Research Institute (SIPRI) | Stockholm International Peace Research Institute (SIPRI) is an international institute that provides data, analysis, and recommendations for armed conflict, military expenditure, and arms trade as well as disarmament and arms control. |
| Maritime Patrol Aircraft (MPA) | A maritime patrol aircraft (MPA), also known as maritime reconnaissance aircraft is a fixed-wing aircraft designed to operate for long durations over water in maritime patrol roles, in particular, anti-submarine warfare (ASW), anti-ship warfare (AShW), and search and rescue (SAR). |
| Mach Number | The Mach number is defined as the ratio of true airspeed to the speed of sound at the altitude of a given aircraft. |
| Stealth Aircraft | Stealth is a Common term applied to low observable (LO) technology and doctrine, that makes an aircraft near invisible to radar, infrared or visual detection. |


Research Methodology
Mordor Intelligence follows a four-step methodology in all our reports.
- Step-1: Identify Key Variables: In order to build a robust forecasting methodology, the variables and factors identified in Step-1 are tested against available historical market numbers. Through an iterative process, the variables required for market forecast are set and the model is built on the basis of these variables.
- Step-2: Build a Market Model: Market-size estimations for the historical and forecast years have been provided in revenue and volume terms. For sales conversion to volume, the average selling price (ASP) is kept constant throughout the forecast period for each country, and inflation is not a part of the pricing.
- Step-3: Validate and Finalize: In this important step, all market numbers, variables and analyst calls are validated through an extensive network of primary research experts from the market studied. The respondents are selected across levels and functions to generate a holistic picture of the market studied.
- Step-4: Research Outputs: Syndicated Reports, Custom Consulting Assignments, Databases & Subscription Platforms


