Market Overview
| Study Period | 2021 - 2031 |
|---|---|
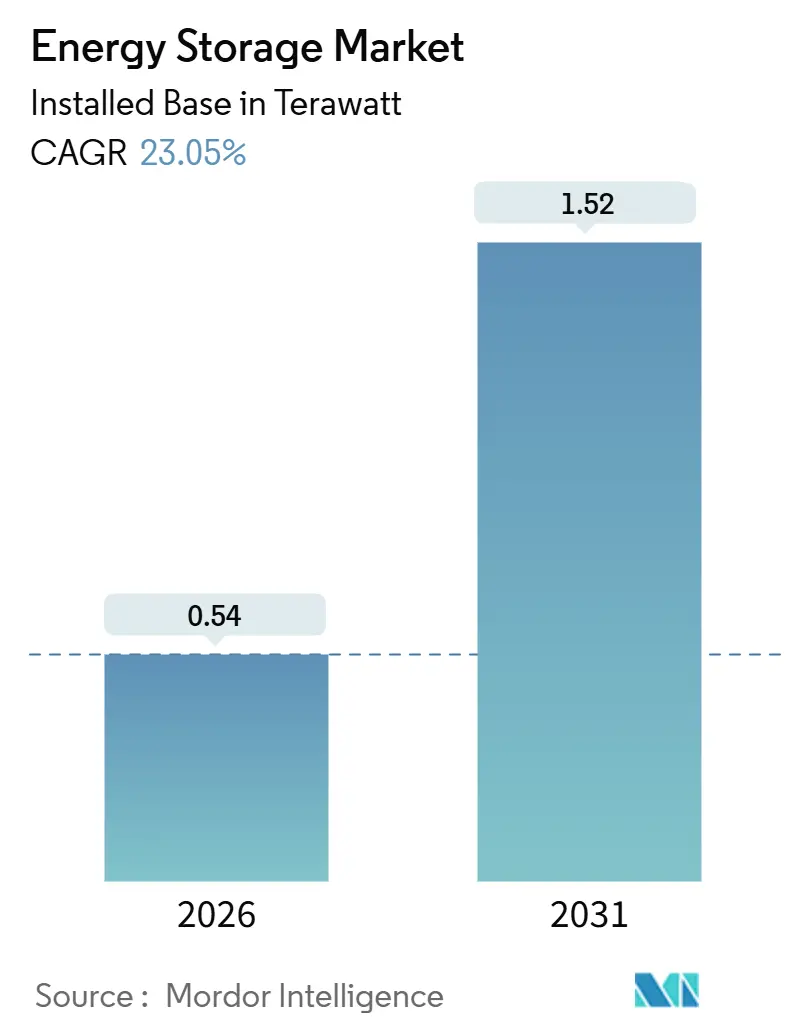
| Market Volume (2026) | 0.54 Terawatt |
| Market Volume (2031) | 1.52 Terawatt |
| Growth Rate (2026 - 2031) | 23.05% CAGR |
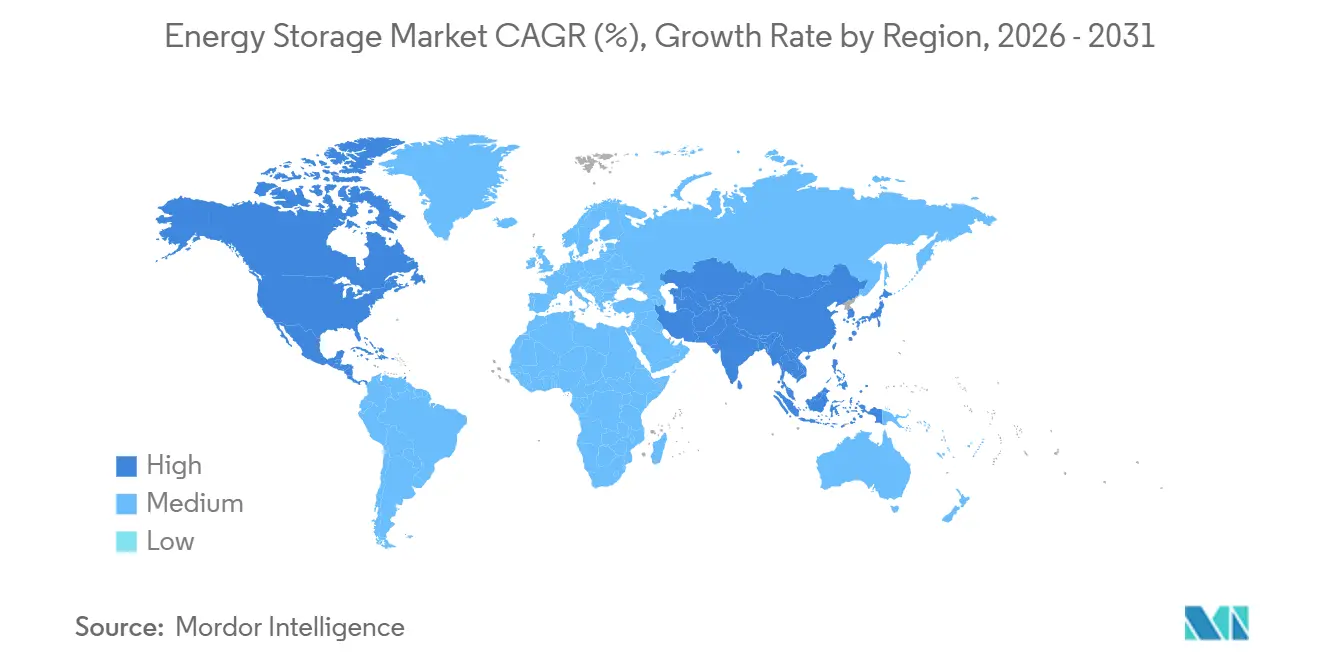
| Fastest Growing Market | North America |
| Largest Market | Asia Pacific |
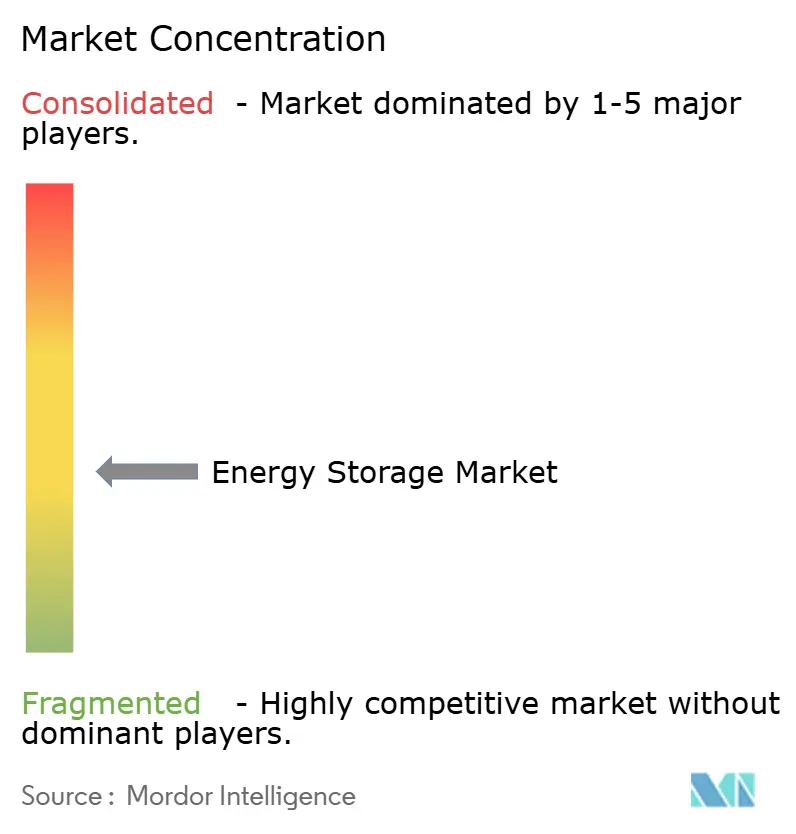
| Market Concentration | Medium |
Major Players *Disclaimer: Major Players sorted in no particular order Image © Mordor Intelligence. Reuse requires attribution under CC BY 4.0. | |
Energy Storage Market Analysis by Mordor Intelligence
The Energy Storage Market size in terms of installed base is expected to grow from 0.54 Terawatt in 2026 to 1.52 Terawatt by 2031, at a CAGR of 23.05% during the forecast period (2026-2031).
Cost breakthroughs in lithium-iron-phosphate batteries, long-duration storage mandates in China, and the U.S. Inflation Reduction Act’s standalone storage investment tax credit are driving a structural pivot from backup-only use toward multi-hour arbitrage and ancillary-service revenue stacking. Utilities are substituting natural-gas peakers with six-hour systems, data-center operators are pairing flywheels with batteries to secure sub-second power quality, and EV-charging corridor developers are embedding storage to avoid costly grid-upgrades. Competitive dynamics favor vertically integrated Chinese cell makers that can undercut Western rivals by 15% on turnkey prices, although North American demand growth is the fastest globally as state-level mandates layer on top of federal incentives.
Key Report Takeaways
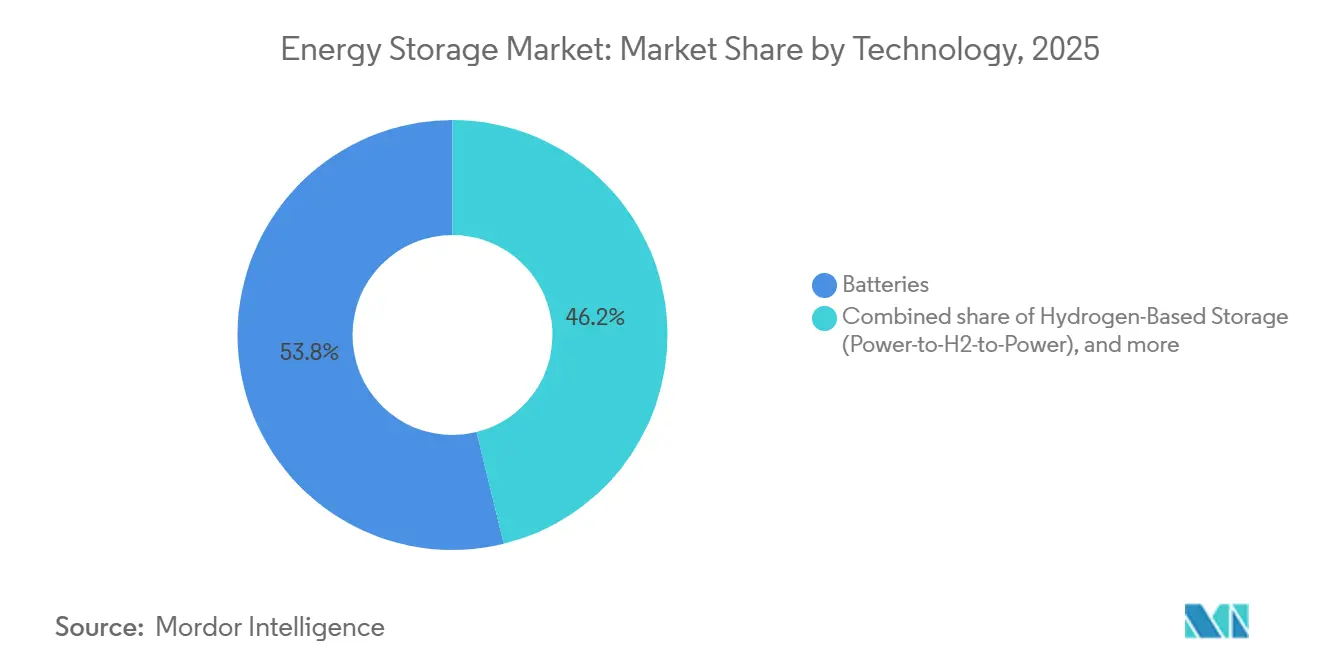
- By technology, batteries held 53.84% of the energy storage market share in 2025, while hydrogen-based storage is poised for a 38.50% CAGR through 2031.
- By connectivity, on-grid systems commanded 93.26% of the 2025 energy storage market size, and off-grid deployments are forecast to expand at a 31.35% CAGR to 2031.
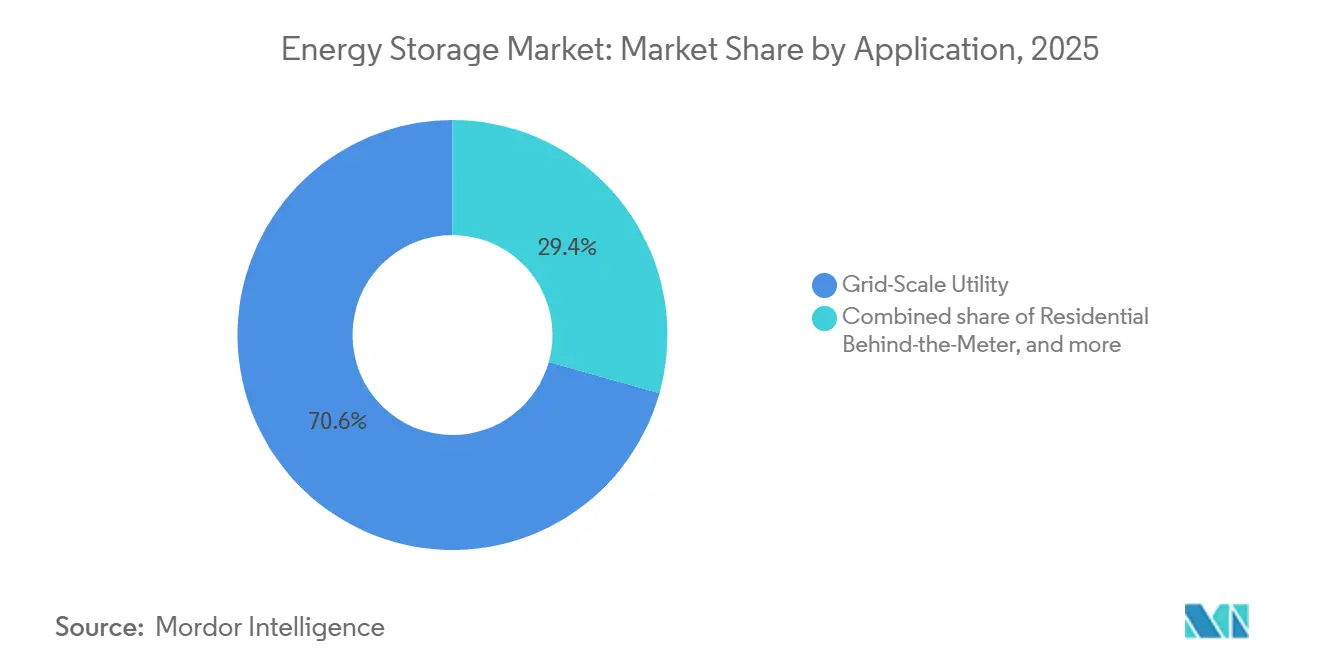
- By application, grid-scale utility projects accounted for 70.63% of the 2025 energy storage market size, whereas EV-charging infrastructure is set to grow at a 29.66% CAGR through 2031.
- By geography, Asia-Pacific captured 45.11% of installed capacity in 2025, and North America leads growth at a 33.47% CAGR through 2031.
Note: Market size and forecast figures in this report are generated using Mordor Intelligence’s proprietary estimation framework, updated with the latest available data and insights as of January 2026.
Global Energy Storage Market Trends and Insights
Drivers Impact Analysis
| Driver | (~) % Impact on CAGR Forecast | Geographic Relevance | Impact Timeline |
|---|---|---|---|
| Rapid LFP battery cost declines driving >6-hour BESS adoption | +4.2% | Asia-Pacific core, spill-over to North America and Europe | Short term (≤ 2 years) |
| Grid-scale incentive schemes (IRA, EU RED III, China long-duration mandate) | +5.8% | North America, EU, China | Medium term (2–4 years) |
| Mandatory GCC renewable-integration targets boosting thermal & CAES | +2.1% | Middle East | Long term (≥ 4 years) |
| Data-center power-quality demands spurring flywheel & BESS | +3.4% | North America, Nordics | Short term (≤ 2 years) |
| EV-charging corridor build-outs requiring stationary storage | +3.7% | Global early gains in U.S. and Germany | Medium term (2–4 years) |
| Corporate PPA surge triggering behind-the-meter storage | +2.9% | EU, Australia, select U.S. states | Medium term (2–4 years) |
| Source: Mordor Intelligence | |||
Rapid LFP Battery Cost Declines Driving above 6-Hour BESS Adoption
Stationary-grade lithium-iron-phosphate cell prices slid to USD 70 per kWh in late 2025, down from USD 115 a year earlier, enabling six-hour and eight-hour installations to beat natural-gas peakers wherever peak-to-off-peak spreads exceed USD 40 per MWh. CATL’s commercial launch of sodium-ion cells in 2025 added extra price pressure by offering utilities a lower-cost option for cold-weather regions. California utilities awarded 3.2 GW of six-hour contracts during 2025 to replace retiring gas turbines under Senate Bill 100 targets.[1]California Public Utilities Commission, “Procurement Tracker 2025,” cpuc.ca.gov Texas ERCOT saw 2.1 GW of merchant storage reach COD in 2025, aimed at exploiting summer price spikes that crest above USD 200 per MWh. Compliance costs tied to IEC 62619 safety certification add USD 5–8 per kWh, yet margins remain robust because the revenue window has widened from four to six hours.
Grid-Scale Incentive Schemes (IRA, EU RED III, China Long-Duration Mandate)
The U.S. Inflation Reduction Act’s 30% standalone storage ITC, in force through 2032, unlocked USD 12 billion of utility-scale financing in 2025, led by projects in Texas, Arizona, and Nevada.[2]U.S. Internal Revenue Service, “Section 48(e) Guidance,” irs.gov Europe’s RED III directive, transposed into national law by mid-2025, obliges member states to secure grid-flexibility assets to reach a 42.5% renewables share by 2030; Germany alone earmarked EUR 500 million (USD 545 million) for a 10 GW build-out. China mandated 180 GW of long-duration storage by 2027 and had 73.76 GW online at end-2024, leaving a 106 GW gap that is propelling compressed-air, pumped-hydro, and hydrogen projects.
Mandatory GCC Renewable-Integration Targets Boosting Thermal & CAES
The United Arab Emirates, Saudi Arabia, and Oman have collectively scheduled more than 120 GW of solar and wind for delivery by 2030, obliging utilities to secure dispatchable storage for evening ramps. Masdar awarded a 19 GWh BESS contract in early 2025 to stabilize a 5.2 GW solar complex, while Saudi Arabia’s Public Investment Fund committed USD 2.5 billion to a 1.5 GW compressed-air facility in a depleted reservoir. Omani tenders favor 12-hour molten-salt tanks to circumvent lithium degradation at 50 °C summer highs. ISO 23551 and IEC 62862 standards are shaping plant specifications.
Data-Center Power-Quality Demands Spurring Flywheel & BESS
Hyperscale operators deployed 3 GW of onsite storage in 2025 to secure power quality for AI workloads that cannot tolerate more than 10 ms voltage sag. Microsoft’s 3 GW multistate BESS order replaced diesel gensets while unlocking ancillary-service revenue streams. Google complemented 20 MW of flywheels with 100 MW of batteries in the Netherlands and Finland for sub-second response, extending battery lifetime from 10 to 15 years. Nordic grid codes now require centers above 10 MW to furnish frequency-containment reserves, effectively subsidizing storage capitalization. Amazon’s USD 1.2 billion rollout across 50 centers cements storage as a default replacement for diesel backup.
Restraints Impact Analysis
| Restraint | (~) % Impact on CAGR Forecast | Geographic Relevance | Impact Timeline |
|---|---|---|---|
| Scarcity of suitable reservoir sites limiting new pumped hydro | −1.8% | Europe, Japan, select U.S. regions | Long term (≥ 4 years) |
| Vanadium/zinc electrolyte volatility hindering flow-battery scale-up | −1.3% | Global, acute in Europe and Australia | Medium term (2–4 years) |
| Stringent fire codes (NFPA 855, IEC 62933) raising urban BESS CAPEX | −2.1% | North America, EU, developed Asia | Short term (≤ 2 years) |
| Revenue-stacking uncertainty in emerging markets | −1.6% | Southeast Asia, Latin America, Africa | Medium term (2–4 years) |
| Source: Mordor Intelligence | |||
Scarcity of Suitable Reservoir Sites Limiting New Pumped Hydro
Europe and Japan face topographical and environmental hurdles that curtail new pumped-hydro projects, holding additions to just 1.2 GW across the EU between 2020 and 2025, while batteries added 28 GW. Natura 2000 habitat protections, seismic risk zoning, and decade-long permitting cycles are steering investors toward compressed-air and hydrogen alternatives. In the U.S., the Federal Energy Regulatory Commission received only 12 license applications during 2024–2025 versus 40 twelve years earlier.[3]Federal Energy Regulatory Commission, “Hydro Licensing Filings 2025,” ferc.gov Australia’s Snowy 2.0 overrun of AUD 2 billion (USD 1.3 billion) in 2025 underscored tunneling risks.
Vanadium/Zinc Electrolyte Supply Volatility Hindering Flow-Battery Scale-Up
Vanadium pentoxide climbed from USD 8 per kg in 2024 to USD 11.2 by mid-2025 after China imposed export quotas, inflating vanadium redox flow battery capital costs by 25%.[4]Metal Bulletin, “Vanadium Market Review,” metalbulletin.com Zinc-bromine chemistry faces its own squeeze because bromine production is concentrated in three countries; a Dead Sea outage raised global prices by 30% in early 2025. Invinity reported electrolyte costs now account for 40% of system expense, up from 28% two years earlier. Consequently, flow batteries held just 2.1% of 2025 capacity and are unlikely to exceed 3% by 2031.
Segment Analysis
By Technology: Electrochemical Dominance Meets Long-Duration Challengers
Batteries accounted for 53.84% of the 2025 energy storage market size, anchored by LFP and growing sodium-ion volumes, while hydrogen storage is forecast to expand at a 38.50% CAGR through 2031 as utilities seek 100-hour seasonal balancing resources. Pumped hydro, thermal molten-salt tanks, compressed-air, liquid-air, flywheel, and gravity systems collectively held a 46.16% share, positioning electrochemical providers to dominate short-cycle revenues even as multi-day technologies close the cost gap.
Solid-state lithium remains confined to pilot lines, lead-acid is losing share in telecom and residential backup, and flow batteries languish below 3% market penetration because of electrolyte volatility. Mitsubishi Power’s Utah hydrogen cavern and Highview Power’s cryogenic plant showcase commercial viability, but capital intensity above USD 400 per kWh limits mainstream uptake. Nonetheless, cumulative cost curves are converging as scale-up proceeds, suggesting long-duration challengers will secure greater energy storage market share beyond 2031.
Note: Segment shares of all individual segments available upon report purchase
Get Detailed Market Forecasts at the Most Granular Levels
Download PDF
By Connectivity: On-Grid Hegemony, Off-Grid Acceleration
On-grid assets represented 93.26% of installed capacity in 2025, reflecting wholesale-market access and multi-stream monetization, yet microgrids and isolated systems are poised for a 31.35% CAGR that outpaces the 22.1% on-grid rate. Texas ERCOT’s 8.2 GW fleet nets USD 120–180 per kW-year via combined services, while California utilities locked 6.8 GW of contracts to replace retiring peakers.
Remote mines, island nations, and rural electrification initiatives are adopting six-hour solar-plus-storage arrays to eliminate diesel. Rio Tinto’s 34 MW Pilbara installation trims fuel bills by AUD 60 million annually, and the Maldives’ 15 MW microgrid will achieve 70% renewable penetration by 2028. Transmission deferral and 8–12% loss avoidance give off-grid schemes rising economic appeal, signaling a gradual decentralization of the energy storage market.
By Application: Utility Scale Anchors, EV Charging Surges
Utility-scale front-of-meter projects controlled 70.63% of the 2025 energy storage market size, underpinned by renewable-integration mandates and capacity-market paybacks; yet EV-charging infrastructure is the fastest-growing slice, charting a 29.66% CAGR through 2031. California’s Moss Landing reached 3 GW/12 GWh in 2025 and demonstrates price-smoothing gains of 10–15% in peak hours.
Residential, C&I, data-center, and remote microgrid installations filled the remaining mix, led by regions where retail tariffs exceed feed-in rates. Tesla, LG Chem, and Sonnen dominate the home segment; Fluence and Wärtsilä capture time-sensitive grid contracts; and railway substations in India are deploying storage to recycle regenerative braking. Diversification of use cases continues as the energy storage market evolves from a single-application solution into a multi-service backbone for clean-energy systems.
Note: Segment shares of all individual segments available upon report purchase
Get Detailed Market Forecasts at the Most Granular Levels
Download PDF
Geography Analysis
Asia-Pacific possessed 45.11% of global capacity in 2025 owing to China’s 73.76 GW installed base, yet growth is moderating as policy emphasis migrates from pure capacity to utilization efficiency. India’s 4.2 GW of 2025 additions stemmed from tenders that bundled eight GW of solar with two GW of four-hour storage, while Japan and South Korea focused on frequency-regulation niches within land-constrained markets.
North America is the velocity leader, forecast to advance at a 33.47% CAGR through 2031 as the Inflation Reduction Act and state mandates converge. The United States added 9.4 GW in 2025, with Texas and California accounting for nearly 75% of that total, and Canada’s Alberta and Ontario provinces following suit. Mexico’s 1.2 GW solar-plus-storage tender remains in regulatory review, signaling latent upside once policy clarity improves.
Europe installed 5.1 GW in 2025, spurred by Germany’s EUR 500 million federal grant program and the UK capacity market’s 15-year contracts. Spain and France integrated storage into renewable auctions, and Nordic countries embedded BESS in expanding data-center clusters to monetize frequency-containment services. The Middle East and Africa contributed 1.6 GW, with the UAE and Saudi Arabia leading deployments that favor thermal and compressed-air chemistries suited for desert climates. South America’s 1.3 GW, mostly in Brazil and Chile, shows that auction frameworks contingent on firm capacity are becoming the region’s primary accelerator.
Get Analysis on Important Geographic Markets
Download PDF
Competitive Landscape
The top 10 providers controlled roughly 55% of 2025 capacity additions, yielding a moderately concentrated field where no single player tops 12% share. CATL leverages vertical integration and USD 70 per kWh turnkey LFP systems to out-price western rivals, while Tesla’s 40 GWh Megapack backlog suffers 18-month lead times that open space for Fluence, Wärtsilä, and Sungrow. LG Energy Solution and Samsung SDI are reallocating R&D toward solid-state prototypes that target high-margin data-center and C&I niches.
Disruption potential centers on long-duration entrants such as Form Energy’s iron-air chemistry and Energy Vault’s gravity systems. Proprietary battery-management software from Tesla, BYD, Fluence, and Wärtsilä lifts cycle life and revenue stacking by up to 50%, forging a services layer that deepens customer lock-in. Compliance with IEC 62933 and UL 9540A fire-propagation testing is turning certification speed into a competitive differentiator, while Siemens Energy’s JV with AES underscores a strategic race to bundle hardware, AI-driven optimization, and long-term O&M contracts.
Energy Storage Industry Leaders
Contemporary Amperex Technology Co. Ltd. (CATL)
Tesla Inc.
LG Energy Solution Ltd.
BYD Co. Ltd.
Fluence Energy Inc.
- *Disclaimer: Major Players sorted in no particular order
Need More Details on Market Players and Competitors?
Download PDF
Recent Industry Developments
- May 2025: TotalEnergies launched six German battery storage projects totaling 100 MW/200 MWh, its largest continental deployment yet.
- April 2025: EVLO commissioned its first storage project in American Samoa, with two more planned, enhancing island resilience.
- February 2025: ACEN Australia started constructing a 200 MW/2-hour BESS at its New England Solar farm, featuring grid-forming inverters.
- January 2025: Saudi Electricity Company contracted 2.5 GW/12.5 GWh of BESS to support 15 GW of upcoming solar capacity.
Research Methodology Framework and Report Scope
Market Definitions and Key Coverage
Our study defines the global energy-storage market as all new, grid-connected or stand-alone systems that accumulate electrical or mechanical energy for later use, including pumped-storage hydro, electrochemical batteries, compressed or liquid air, thermal media, flywheels, gravity, and hydrogen-based solutions. Value is captured at system commissioning and includes turnkey equipment, EPC services, and integrated software.
Scope Exclusion: mobile traction batteries installed in electric vehicles are outside this analysis.
Segmentation Overview
- By Technology
- Batteries (Lithium-ion, Solid-State Li, Sodium-ion, Lead-acid, Sodium-Sulfur, and Flow Batteries (Vanadium, Zinc-Bromine))
- Pumped-Storage Hydroelectricity
- Thermal Energy Storage (Sensible Heat (Molten Salt, Water), Latent Heat (Phase-Change Materials), Thermochemical)
- Compressed Air Energy Storage
- Liquid Air/Cryogenic Storage
- Flywheel Energy Storage
- Gravity-Based Storage
- Hydrogen-Based Storage (Power-to-H2-to-Power)
- Other Emerging Technologies (Iron-Air, Zinc-Air)
- By Connectivity
- On-Grid
- Off-Grid
- By Application
- Grid-Scale Utility (Front-of-Meter)
- Residential Behind-the-Meter
- Commercial and Industrial Behind-the-Meter
- Data Centers and Critical Facilities
- Remote and Off-Grid/Microgrids
- Others (Transportation and Rail Electrification, EV-Charging Infrastructure, Transmission and Distribution Deferral)
- By Geography
- North America
- United States
- Canada
- Mexico
- Europe
- United Kingdom
- Germany
- France
- Spain
- Nordic Countries
- Russia
- Rest of Europe
- Asia-Pacific
- China
- India
- Japan
- South Korea
- ASEAN Countries
- Rest of Asia-Pacific
- South America
- Brazil
- Argentina
- Colombia
- Rest of South America
- Middle East and Africa
- United Arab Emirates
- Saudi Arabia
- South Africa
- Egypt
- Rest of Middle East and Africa
- North America
Detailed Research Methodology and Data Validation
Primary Research
Our team supplements desk work with interviews and structured surveys involving OEM engineering leads, project developers, utility planners, and finance experts across Asia-Pacific, North America, Europe, and selected emerging hubs. These discussions test preliminary assumptions on average selling prices, installation lead times, duration preferences, and policy risk, letting us fine-tune regional multipliers and technology adoption curves.
Desk Research
We begin by mapping supply, demand, and installed-base fundamentals through respected public sources such as the International Hydropower Association, U.S. Energy Information Administration, Eurostat, China National Energy Administration, and industry bodies like the Long Duration Energy Storage Council. Trade statistics, FERC interconnection queues, patent families (Questel), and public tender archives (Tenders Info) give our analysts early signals on capacity pipelines and price trajectories. Company 10-Ks, prospectuses, and credible press releases flesh out project lists, while news aggregators inside Dow Jones Factiva help us track commissioning milestones and policy shifts day by day. These sources illustrate, but do not exhaust, the many datasets we review before sizing and segmenting the market.
Market-Sizing & Forecasting
A top-down build traces global electricity generation, pumped-hydro additions, and storage-to-generation penetration ratios; these totals are cross-checked through bottom-up samples of supplier revenues, unit shipments, and EPC contract awards. Key variables in the model include lithium-ion pack price per kWh, average duration (hours) by application, renewable curtailment rates, grid-scale policy incentives, and announced pumped-hydro refurbishments. Gaps in bottom-up coverage are bridged with weighted averages from analogous geographies before reconciliation. Multivariate regression on GDP growth, renewable build-out, and battery price learning curves feeds an ARIMA forecast that extends from the 2025 baseline to 2030, with scenario bands reflecting raw-material price volatility.
Data Validation & Update Cycle
Outputs pass a three-layer review: automated variance checks, peer analyst audit, and leadership sign-off. We then benchmark against independent capacity trackers and commodity indexes. Reports refresh yearly, and interim updates trigger when new incentives, safety codes, or GW projects materially alter the outlook.
Why Our Energy Storage Baseline Stands Up to Scrutiny
Published numbers often diverge because firms define storage assets, valuation points, and forecast drivers differently. Our analysts anchor estimates to the complete asset stack (hardware plus EPC) and refresh the baseline every twelve months, limiting vintage risk.
Key gap drivers include whether pumped-storage hydro is counted, how battery system prices are normalized, and the timeliness of policy adjustments such as the U.S. investment tax credit expansion or China's 2-hour minimum rule.
Benchmark comparison
| Market Size | Anonymized source | Primary gap driver |
|---|---|---|
| USD 295 bn (2025) | Mordor Intelligence | - |
| USD 90.36 bn (2024) | Global Consultancy A | Excludes pumped-hydro and long-duration mechanical systems; shorter refresh cadence; currency fixed at 2023 averages |
| USD 50.81 bn (2025) | Industry Journal B | Battery-only scope; relies mainly on supplier announcements without triangulating EPC spend or hydro expansions |
The comparison shows why decision-makers seeking a balanced, transparent view rely on Mordor Intelligence: our broader scope, mixed-method modeling, and disciplined update cycle deliver a dependable baseline that aligns with real-world investment flows.
Need A Different Region or Segment?
Customize Now
Key Questions Answered in the Report
How large is the global energy storage market in 2026?
Installed capacity reached 0.54 terawatt in 2026, and it is on track to reach 1.52 terawatt by 2031 at a 23.05% CAGR.
Which technology has the biggest energy storage market share today?
Batteries lead, holding 53.84% of 2025 capacity, well ahead of pumped hydro and thermal systems.
What is driving the fastest growth segment in energy storage?
EV-charging corridor projects are scaling at a 29.66% CAGR as developers avoid costly grid upgrades and monetize demand-charge reductions.
Which region will grow quickest through 2031?
North America is projected to post a 33.47% CAGR thanks to the Inflation Reduction Act tax credit and stacking state mandates.
How are safety regulations affecting urban battery projects?
Compliance with NFPA 855 and IEC 62933 adds USD 50–80 per kWh, pushing total urban CAPEX above USD 550 per kWh and extending payback periods.


