
Digital Soil Mapping Platforms and Applications Market Size and Share
Market Overview
| Study Period | 2021 - 2031 |
|---|---|
| Market Size (2026) | USD 0.59 Billion |
| Market Size (2031) | USD 1.03 Billion |
| Growth Rate (2026 - 2031) | 12.00 % |
| Fastest Growing Market | Asia-Pacific |
| Largest Market | North America |
| Market Concentration | Low |
Major Players *Disclaimer: Major Players sorted in no particular order Image © Mordor Intelligence. Reuse requires attribution under CC BY 4.0. | |
Digital Soil Mapping Platforms and Applications Market Analysis by Mordor Intelligence
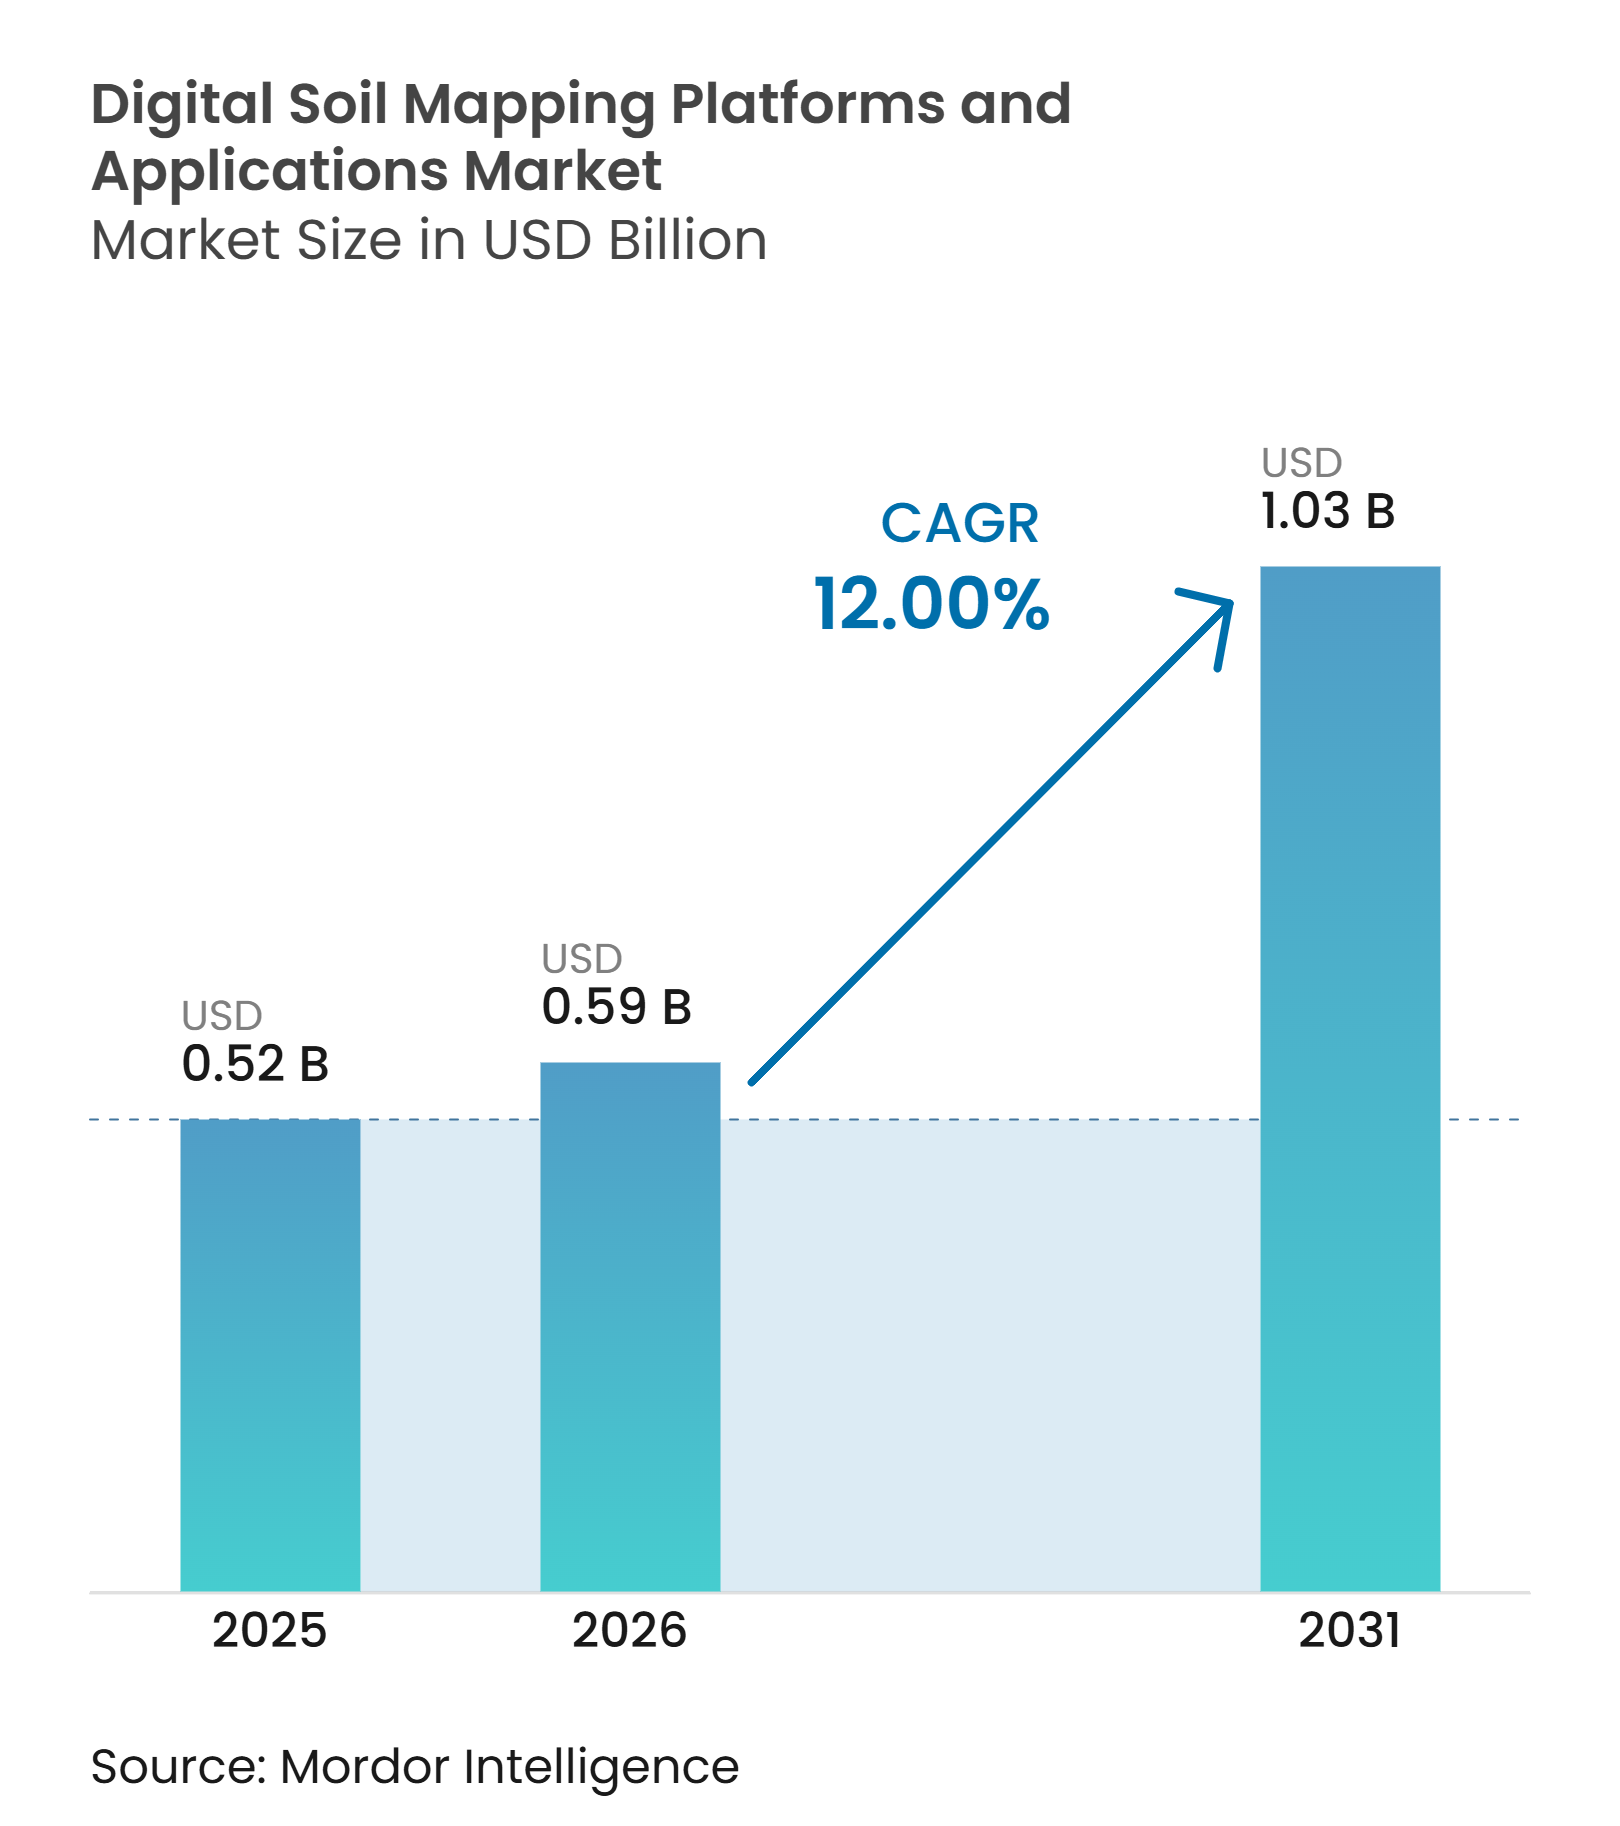
The Digital soil mapping platforms and applications market size is projected to be USD 0.52 billion in 2025, USD 0.59 billion in 2026, and reach USD 1.03 billion by 2031, growing at a CAGR of 12% from 2026 to 2031. The Digital soil mapping platforms and applications market is moving toward field-level soil information that supports variable-rate input decisions, land management, and sustainability reporting. Demand is supported by wider use of spatial soil data in precision agriculture and by public programs that improve the availability of base soil information. Artificial intelligence-based spatial prediction is improving the ability to estimate soil properties at unsampled locations when suitable calibration data are available. This is expanding the role of digital soil mapping platforms from static soil surveys to recurring decision-support tools. Competition centers on model validation, geographic coverage, data integration, and the ability to integrate with farm and land-management workflows.
Key Report Takeaways
- By type, soil property mapping held 55% of the digital soil mapping platforms and applications market share in 2025, while soil classification mapping is forecast to grow at a 13.5% CAGR from 2026 to 2031.
- By technology, drone scouting held 34% of the market in 2025, while mobile scouting is forecast to grow at a 16% CAGR from 2026 to 2031.
- By deployment model, cloud-based platforms accounted for 58% of the digital soil mapping platforms and applications market size in 2025, while web and mobile platforms are forecast to grow at a 15% CAGR from 2026 to 2031.
- By end user, agribusiness companies held 32% of the market in 2025, while agriculture cooperatives are forecast to grow at a 14% CAGR from 2026 to 2031.
- By geography, North America held 34% of the market in 2025, while Africa is forecast to grow at a 17.1% CAGR from 2026 to 2031.
Note: Market size and forecast figures in this report are generated using Mordor Intelligence’s proprietary estimation framework, updated with the latest available data and insights as of January 2026.
Market Trends and Insights
Drivers Impact Analysis of Digital Soil Mapping Platforms and Applications Market*
| Driver | (~) % Impact on CAGR Forecast | Geographic Relevance | Impact Timeline |
|---|---|---|---|
| Rising demand for spatially detailed soil intelligence in precision agriculture | +2.4% | North America, Europe, Asia-Pacific, South America | Medium term (2-4 years) |
| Expansion of government and institutional digital soil information initiatives | +1.9% | Europe, North America, Asia-Pacific, Africa | Long term (≥ 4 years) |
| Increasing integration of digital soil maps into farm and land-management workflows | +1.7% | North America, Europe, South America, Asia-Pacific | Medium term (2-4 years) |
| Adoption of AI-enabled digital soil map generation and spatial prediction | +2.1% | North America, Europe, Asia-Pacific | Short term (≤ 2 years) |
| Integration of digital soil mapping into registry-grade soil carbon MRV | +1.5% | North America, Europe, South America, Oceania | Medium term (2-4 years) |
| Standards-based data integration and API delivery expanding platform accessibility | +1.1% | Europe, North America, Asia-Pacific | Long term (≥ 4 years) |
| Source: Mordor Intelligence | |||
Rising Demand for Spatially Detailed Soil Intelligence in Precision Agriculture
The Digital soil mapping platforms and applications market is driven by farm demand for recommendations that account for differences within a field. Fertilizer, lime, seed, and irrigation decisions depend on information about soil texture, organic matter, pH, and water-holding capacity at a practical resolution. A map based on field averages cannot show these variations as clearly as a spatial model built from soil, terrain, climate, and imagery data. The United States Department of Agriculture has documented the adoption of precision agriculture tools and their connection to input management decisions on farms [1].
Expansion of Government and Institutional Digital Soil Information Initiatives
Public soil information programs provide base datasets and create procurement opportunities for commercial mapping applications. These programs make digital soil information more familiar to public agencies, researchers, advisors, and farmers. The European Commission’s January 2024 INSPIRE soil guidelines establish a common framework for soil data interoperability across institutional workflows. Better public datasets can reduce the initial data gap for platforms entering areas with limited calibration coverage. Public initiatives can also make institutional buyers more ready to adopt digital mapping workflows.
Increasing Integration of Digital Soil Maps Into Farm and Land-Management Workflows
Digital soil maps are gaining value when they are used within daily agronomy, land planning, and sustainability processes. Farm users need spatial data that can move into field records, prescription systems, and reporting tools without manual rework. Platforms with application programming interfaces can make soil attributes available to input providers, advisors, and land-management systems. This expands the commercial role of a map from a one-time deliverable to an input that supports several operating decisions. Workflow integration can also make a platform harder to replace because the data becomes part of an established operating process.
Adoption of AI-Enabled Digital Soil Map Generation and Spatial Prediction
Machine learning is changing digital soil mapping from a mainly survey-based activity into a process that can estimate properties between sampled locations. Platforms combine ground observations with satellite imagery, terrain data, climate information, and other environmental variables. A 2026 peer-reviewed study used 1,019 georeferenced measurements and 79 environmental covariates at 10 m by 10 m resolution to model soil carbon in United States Midwestern fields. This approach can reduce sampling requirements, although it does not remove the need for local calibration and independent validation. Models that show prediction uncertainty are more useful where users need confidence in the result for reporting or investment decisions. The Digital soil mapping platforms and applications market is therefore seeing more interest in platforms that combine spatial predictions with documented accuracy controls.
Restraints Impact Analysis of Digital Soil Mapping Platforms and Applications Market*
| Restraint | (~) % Impact on CAGR Forecast | Geographic Relevance | Impact Timeline |
|---|---|---|---|
| High data, calibration, and ground-validation requirements | -2.20% | Africa, Middle East, South America, Asia-Pacific | Long term (≥ 4 years) |
| Interoperability and soil-data standardization gaps | -1.80% | Africa, Middle East, Asia-Pacific, South America | Long term (≥ 4 years) |
| Model-transfer uncertainty and insufficient validation across heterogeneous landscapes | -1.60% | Africa, Asia-Pacific, South America, Middle East | Medium term (2-4 years) |
| Limited user awareness, technical capacity, and confidence in digital soil map outputs | -1.30% | Africa, Middle East, South America, parts of Asia-Pacific | Medium term (2-4 years) |
| Source: Mordor Intelligence | |||
High Data, Calibration, and Ground-Validation Requirements
Commercially useful soil maps require geographically representative observations, validation samples, and ongoing ground checks. These requirements add cost before a platform can serve a new area with confidence. Wageningen University and Research reported that variogram estimation for spatial uncertainty modeling can require 100 to 150 sample locations using method-of-moments approaches, or at least 50 locations using restricted maximum likelihood. The requirement is particularly difficult in areas where field sampling capacity and historical soil data are limited. Recalibration can also be needed when a platform is applied across different soil types, depth intervals, or climate conditions. Providers that gain access to public or institutional data-collection programs may therefore have a lasting advantage in the Digital soil mapping platforms and applications market.
Interoperability and Soil-Data Standardization Gaps
Soil data is often stored in formats and classification systems that do not readily integrate with other datasets or farm management systems. This can delay platform implementation and limit the use of third-party survey records. The 2024 INSPIRE soil guidelines establish technical requirements for interoperable soil data in European institutional settings[2]. Meeting those requirements may require product changes and additional data management work. Different national standards can also make cross-border deployment more difficult for providers that depend on a single data model. Platforms that have already built connectors to commonly used systems may retain customers more easily, while new providers must invest before they can offer comparable integration.
*Our forecasts treat driver/restraint impacts as directional, not additive. The impact forecasts reflect baseline growth, mix effects, and variable interactions.
Digital Soil Mapping Platforms and Applications Market Segment Analysis
By Type:
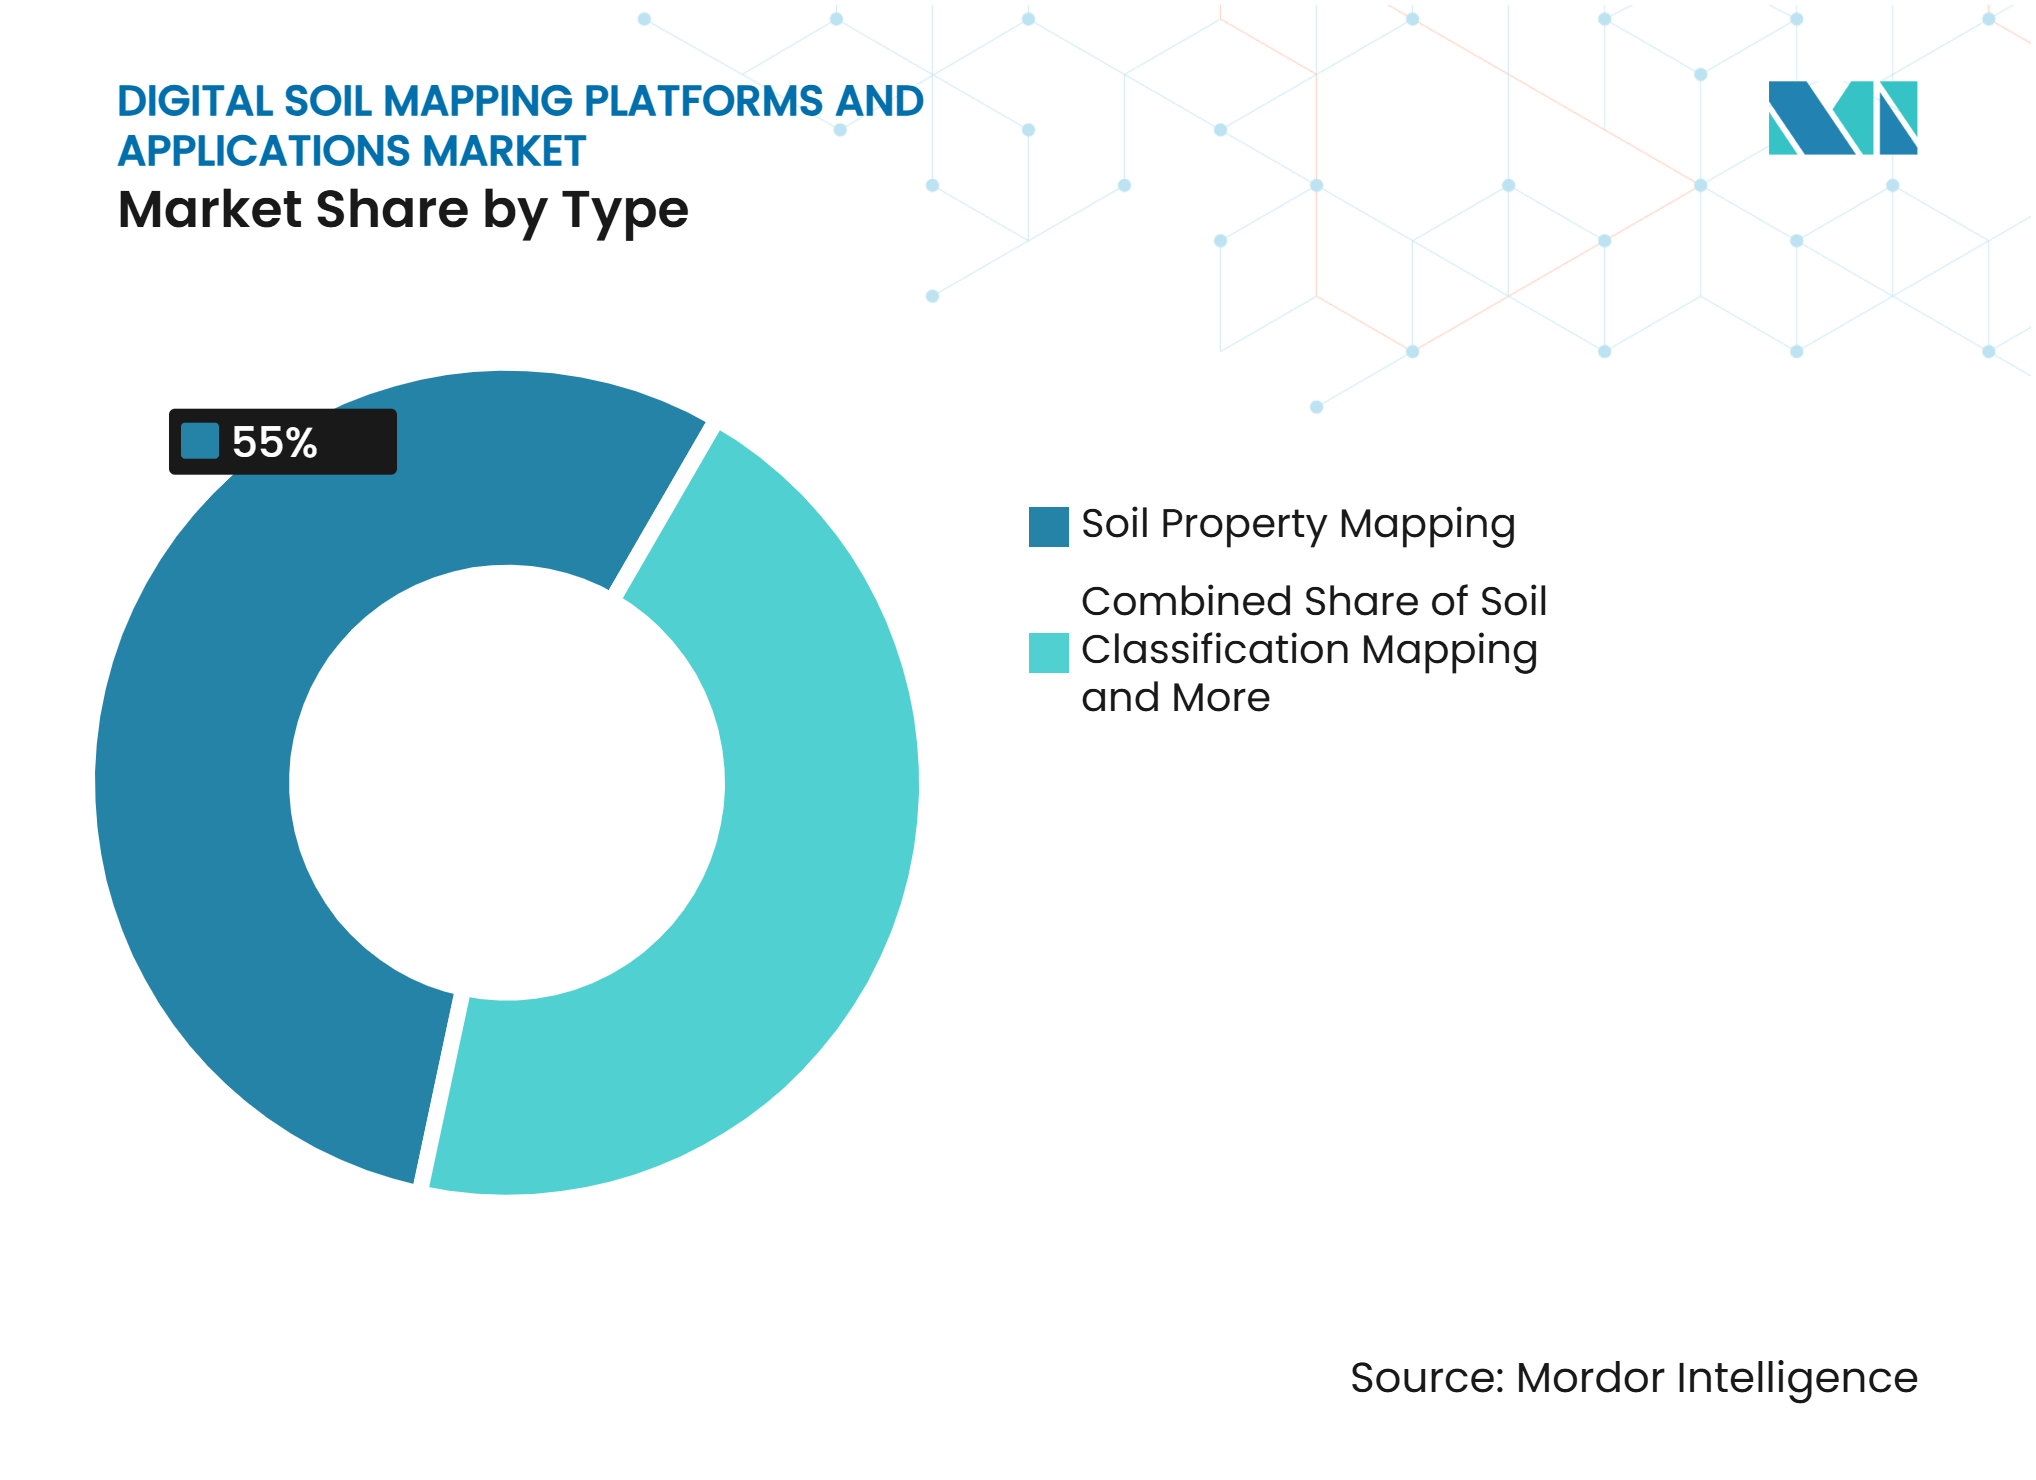
Soil Property Mapping Anchors Agronomic UseSoil Property Mapping accounted for 55% of the market in 2025, making it the largest segment. It supports field-level decisions on fertilizer, lime, seed, and water management through information on texture, organic matter, pH, and moisture-related conditions. Agronomic providers use these outputs to prepare variable-rate prescriptions and field-specific recommendations. The commercial value depends on map resolution, documented data quality, and a practical fit with seasonal input-management work. Satellite imagery, drone-derived observations, terrain data, and selected soil samples can be combined to estimate properties between sampling locations.
Soil Classification Mapping is forecast to grow at a 13.5% CAGR from 2026 to 2031, making it the fastest type segment. Its demand is more closely linked to land assessment, conservation planning, and soil carbon work that require taxonomic characterization. Standardized classifications can help users define comparable soil units across larger areas and longer planning periods. Public soil information programs can strengthen the reference base for commercial providers, enabling them to offer higher-resolution interpretation and application-specific outputs. Other Types remain relevant for customized mapping assignments required by government, institutional, and research users.



By Technology:
Mobile Scouting Expands AccessDrone Scouting held 34% of the market in 2025, making it the largest technology segment. It is used where service providers can maintain repeatable collection workflows and where detailed observations have a clear agronomic value. Drone-derived spectral and multispectral information can be combined with terrain, satellite, and soil data in spatial prediction models. Hardware cost, operating rules, and trained-operator requirements can make this approach more practical in higher-income agricultural areas. The commercial product remains the platform-generated soil map and related analysis rather than the drone itself.
Mobile Scouting is forecast to grow at a 16% CAGR from 2026 to 2031, making it the fastest technology segment. Smartphone-based observations lower the need for dedicated flight equipment and can provide GPS-tagged inputs from agronomists and farm advisors. The approach can support local data collection in Africa, Asia-Pacific, and South America, where lower-cost workflows may encourage initial platform adoption. Its usefulness still depends on consistent observation methods, sound sampling practices, and clear quality controls. Satellite Imagery supports wider-area mapping, while Other Technologies include sensor fusion and geophysical methods used in specialized applications.
By Deployment Model:
Cloud Delivery Supports Broad UseCloud-Based Platforms accounted for 58% of the market in 2025, making them the largest deployment segment. Hosted environments can process the large geospatial datasets used in digital soil mapping and serve users across dispersed locations. Subscription and per-acre models align provider revenue with ongoing use of maps, analytics, and workflow tools. Application programming interfaces can also support data licensing to agricultural and sustainability systems. Clear documentation, access controls, and traceable outputs remain important for users with regulatory or reporting needs.
Web and Mobile Platforms are forecast to grow at a 15% CAGR from 2026 to 2031, making them the fastest deployment segment. Browser and mobile access can reduce reliance on specialized desktop software and help advisors, producers, and public agencies review the same information. These systems suit cooperative data pooling and institutional programs that need shared access and audit trails. Their expansion increases the importance of permission management and reliable handling of user data. Other Platforms, including installed and hybrid configurations, remain relevant where users require greater local control or have data-sensitivity concerns.
By End User:
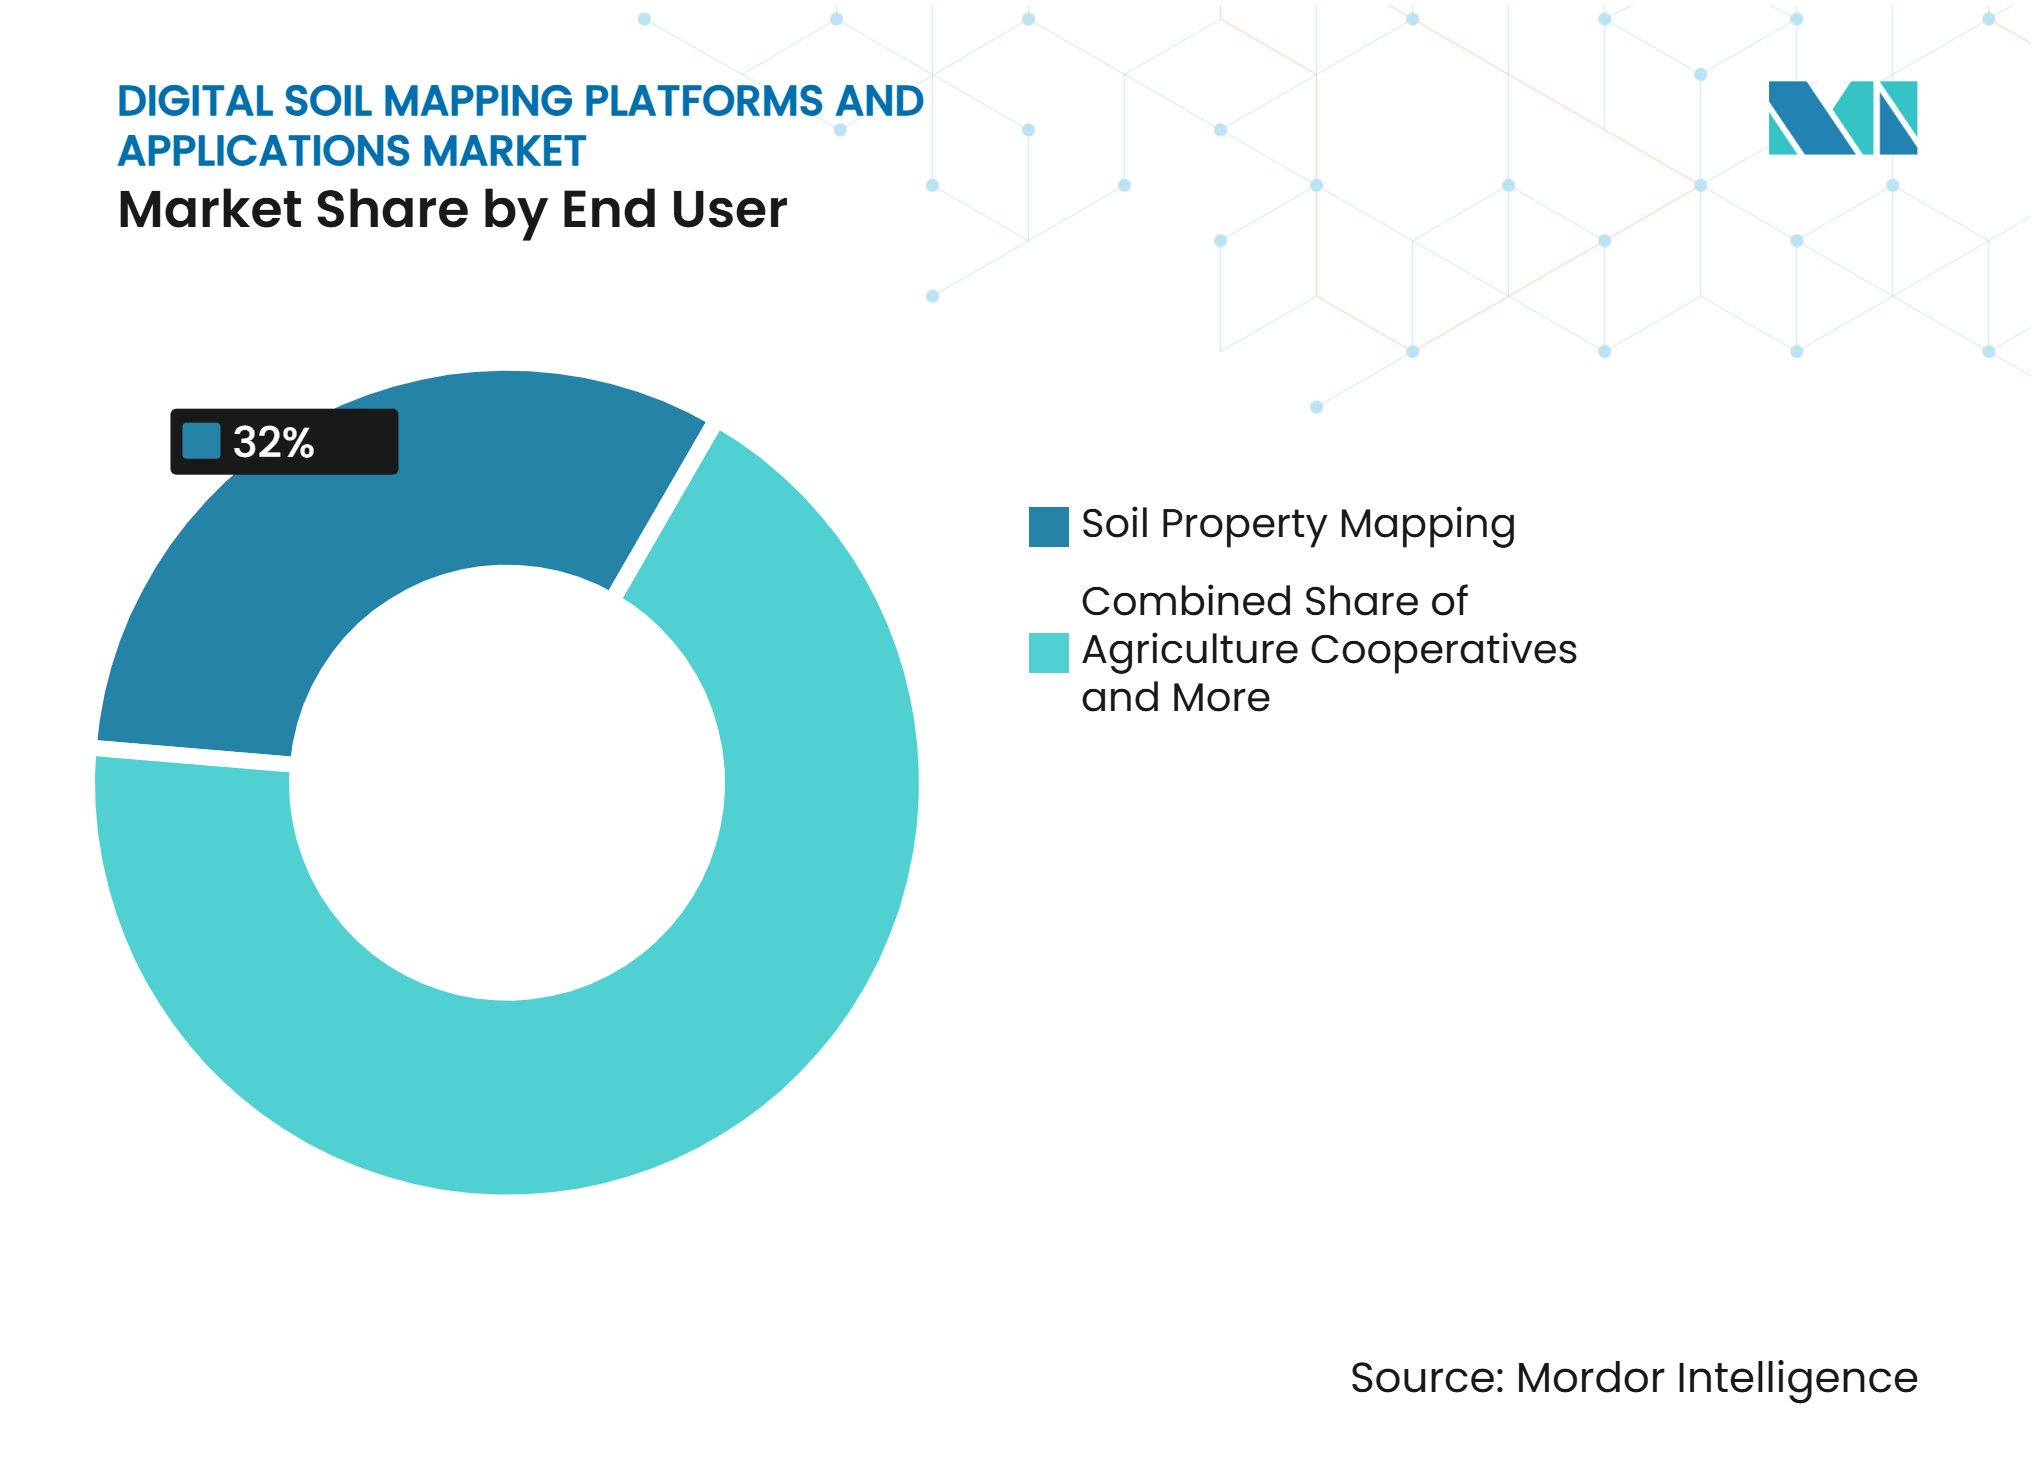
Agribusiness Leads While Cooperatives Grow FasterAgribusiness Companies held 32% of the market in 2025, making them the largest end-user segment. Large farm operators, integrated agribusinesses, and input manufacturers use mapping to manage inputs, support sustainability reporting, and strengthen agronomic services. Their scale can support repeated use over substantial land areas and justify integrating maps with farm records and application plans. Some providers license spatial soil data for use in third-party recommendation systems, creating a business-to-business route beyond direct subscriptions. Government and Research Institutes also matter because their data and procurement can support commercial calibration and platform deployment.
Agriculture Cooperatives are forecast to grow at a 14% CAGR from 2026 to 2031, making them the fastest end-user segment. They can pool subscription costs and share field information among members, helping smaller farms access mapping tools and local data collection. Shared records can deepen local information when members follow consistent processes. The model needs trusted data-sharing arrangements and advisory support that turns map outputs into practical decisions. Other End Users include individual farmers, consultants, and independent advisors, whose adoption can be supported by lower-cost web and mobile delivery.

Geography Analysis
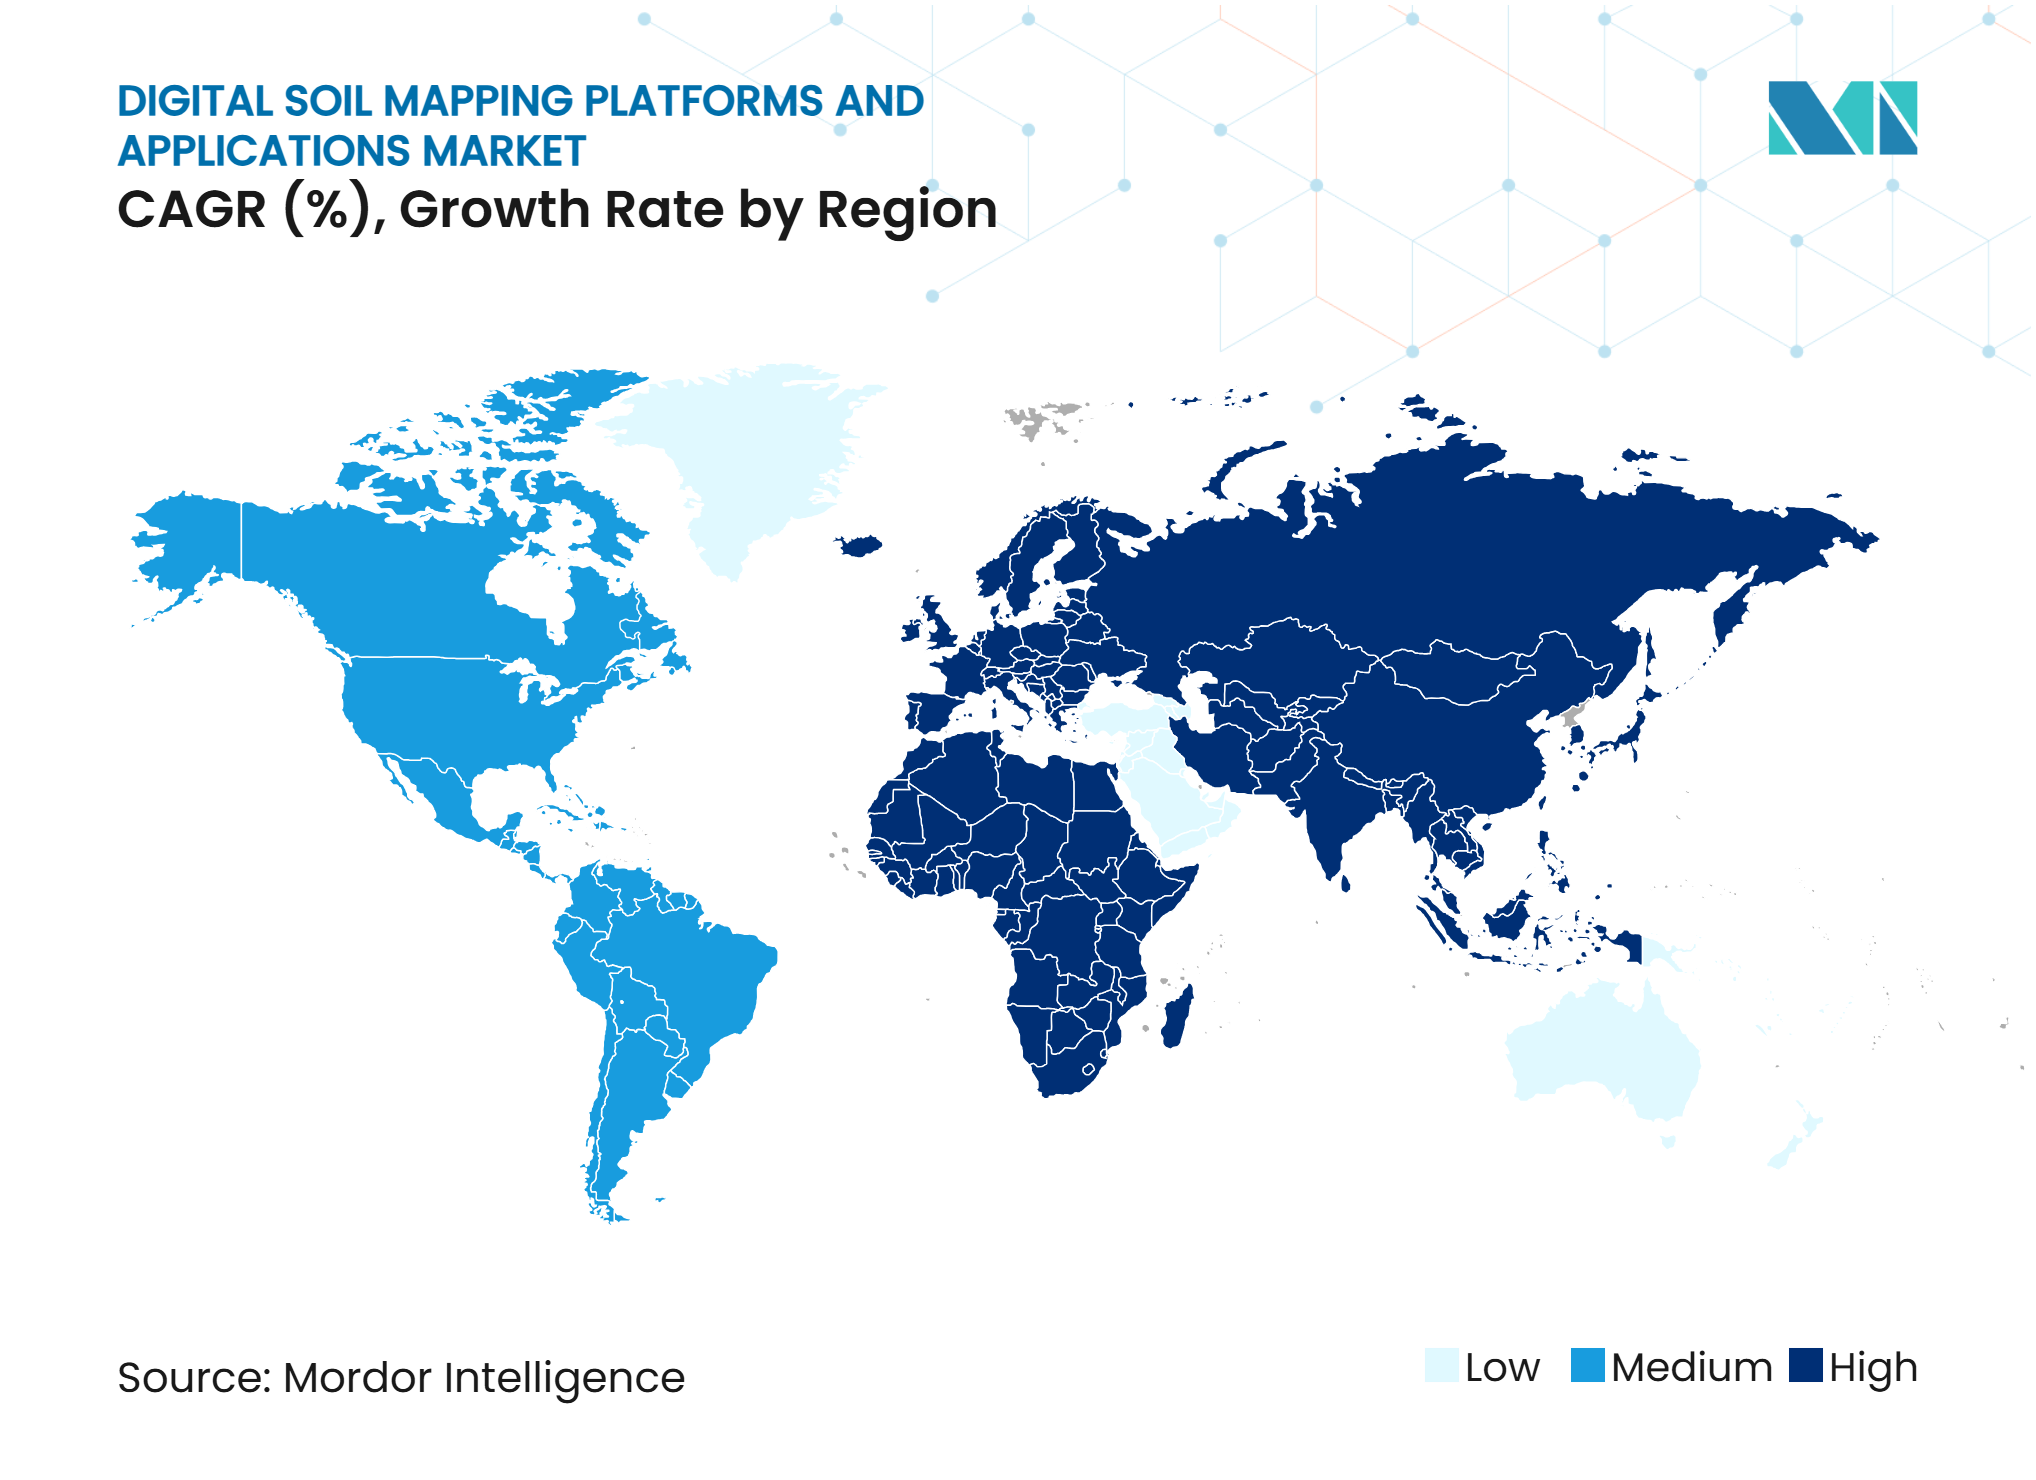
North America held 34% of the regional market in 2025, making it the largest regional market. Precision agriculture service networks in the United States and Canada provide an established channel for field-level mapping and variable-rate prescriptions. The United States Natural Resources Conservation Service Web Soil Survey provides a national baseline that commercial providers can extend with field-level predictions[3]. The United States Department of Agriculture’s Cropland Data Layer will use a 10 m spatial resolution from 2024, derived from Sentinel-2 and Landsat imagery, expanding the information available as a mapping covariate. These conditions support recurring commercial use rather than isolated mapping projects.
Europe is shaped by demand for commercial precision agriculture and by institutional work under the European Union’s soil policy framework. The AI4SoilHealth project is building an open Soil Health Data Cube and plans a mobile application by 2026. The January 2024 INSPIRE soil guidelines set interoperability expectations for platforms serving European public-sector users. Italy’s 2025 Digital Twin of the Italian territory initiative, under the National Recovery and Resilience Plan, illustrates a direct public interest in digital land information. Asia-Pacific has a more varied profile, with Australia supported by established soil programs and China and India showing growing institutional interest but lower commercial penetration.
Africa is forecast to grow at a 17.1% CAGR from 2026 to 2031, making it the fastest regional segment. International soil data initiatives, broader mobile access, and food security needs are increasing the relevance of accessible mapping platforms. The International Fertilizer Development Center reported in 2024 that updated digital soil maps for West Africa and the Sahel were being linked with open-source agronomic advisory platforms. South Africa has the strongest commercial adoption on the continent, while Brazil and Argentina are driving demand through large agribusiness operations, carbon market activity, and precision agriculture initiatives.
Competitive Landscape
Market Concentration
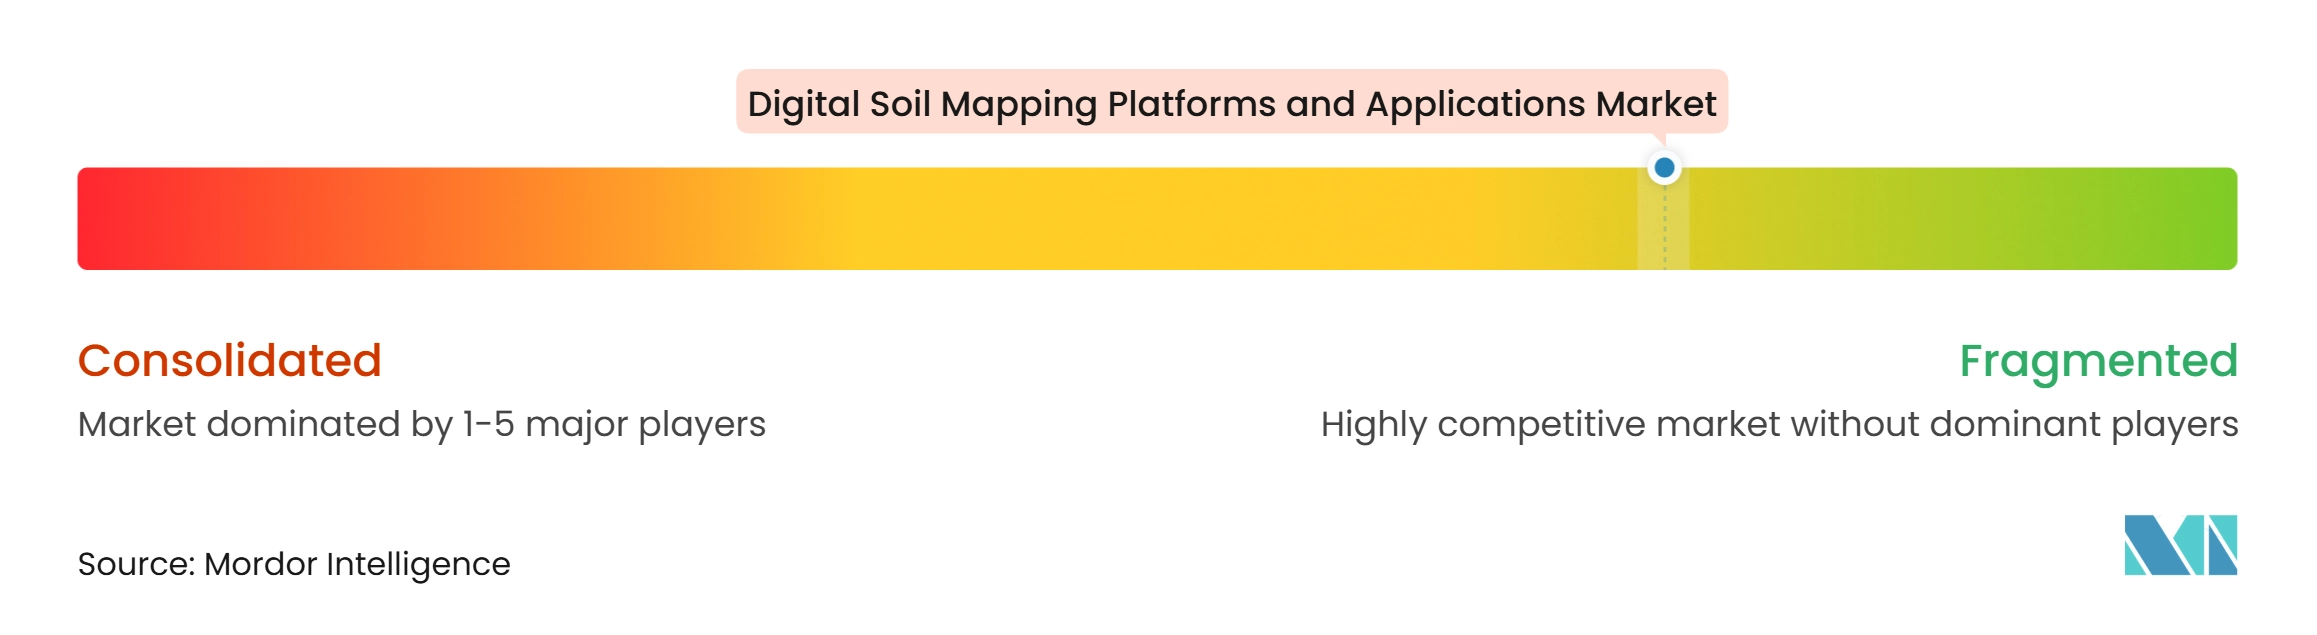
The market is fragmented, with no single provider identified as holding a dominant share. Competition is based on model accuracy, validation depth, geographic coverage, environmental data, and workflow integration. Croptimistic Technology Inc. and SoilOptix Inc. focus on high-resolution agronomic mapping and service-provider channels. Their positioning reflects the importance of making soil information usable in field-level decisions rather than providing maps as isolated technical outputs. Providers that can integrate data into established farm workflows may achieve stronger customer retention.
EOS Data Analytics, Inc. and Perennial Climate Inc. are positioned around digital soil mapping and soil carbon measurement, reporting, and verification. This focus requires providers to address both spatial accuracy and the documentation expected in carbon projects. Advanced Agrilytics Holdings LLC uses a data-as-a-service model via the TerraSYNC application programming interface, enabling third parties to integrate its spatial soil intelligence into their own systems. That approach differs from direct farmer-facing delivery and creates a route to licensing revenue. Providers serving carbon and sustainability use cases must also manage auditable data flows and uncertainty information.
FarmLab Pty Ltd, Senus PLC, and Abelio SAS compete by focusing on geographic markets or workflow specialization. SoilEssentials Ltd, FlyPard Analytics GmbH, Agroxy Limited, United Soils, Inc., SoilOptix Inc., and Xact Agriculture and Forestry add regional or specialized competition. GroundTruth Ag, Inc. uses artificial intelligence-enabled multimodal data and spatial soil prediction models in its soil-mapping activities. As mapping methods become more widely available, established calibration coverage and data libraries become more important sources of differentiation. Long-term public and institutional data partnerships can therefore strengthen a provider’s position in specific geographies.
Digital Soil Mapping Platforms and Applications Industry Leaders
-
Croptimistic Technology Inc.
-
FarmLab Pty Ltd
-
SoilEssentials Ltd
-
Senus PLC
-
EOS Data Analytics, Inc.
- *Disclaimer: Major Players sorted in no particular order
Digital Soil Mapping Platforms and Applications Market Companies Covered in this Report
- Croptimistic Technology Inc.
- FarmLab Pty Ltd
- SoilEssentials Ltd
- Senus PLC
- GroundTruth Ag, Inc.
- FlyPard Analytics GmbH
- Abelio SAS
- Agroxy Limited
- EOS Data Analytics, Inc.
- Perennial Climate Inc.
- Advanced Agrilytics Holdings LLC
- Veris Technologies, Inc.
- United Soils, Inc.
- SoilOptix Inc.
- Xact Agriculture and Forestry
Recent Industry Developments in Digital Soil Mapping Platforms and Applications Market
- December 2025: AgriProve launched HORIZON, a digital soil-carbon platform developed in partnership with EOS Data Analytics (EOSDA). The platform was developed through a USD 12 million investment and uses satellite imagery, machine learning, and more than 20,000 soil samples to provide monthly soil-carbon insights and support annual crediting cycles.
- November 2025: Croptimistic Technology Inc. integrated SWAT MAPS with Farm Credit Canada's AgExpert software. AgExpert Field Premium users can sync SWAT MAPS soil, water, and topography data with field records to support farm planning, recordkeeping, and tracking eligibility for the FCC 4R Incentive.
- August 2025: Verra released VT0014, “Estimating Organic Carbon Stocks Using Digital Soil Mapping,” v1.0, developed by Perennial Climate Inc. The tool guides on developing, calibrating, and validating digital soil mapping models for spatially explicit estimation of soil organic carbon and is approved for use with VM0042 and VM0032 under the Verified Carbon Standard Program.
Global Digital Soil Mapping Platforms and Applications Market Report Scope
The Digital Soil Mapping Platforms and Applications Market Report is segmented by Type (Soil Property Mapping, Soil Classification Mapping, and Other Types), by Technology (Drone Scouting, Mobile Scouting, Satellite Imagery, and Other Technologies), by Deployment Model (Cloud-Based Platforms, Web and Mobile Platforms, and Other Platforms), by End User (Agriculture Cooperatives, Government and Research Institutes, Agribusiness Companies, and Other End Users), and by Geography (North America, Europe, Asia-Pacific, South America, Middle East, and Africa). The Market Forecasts are Provided in Terms of Value (USD).
Segmentation Overview
| Soil Property Mapping |
| Soil Classification Mapping |
| Other Types |
| Drone Scouting |
| Mobile Scouting |
| Satellite Imagery |
| Other Technologies |
| Cloud-Based Platforms |
| Web and Mobile Platforms |
| Other Platforms |
| Agriculture Cooperatives |
| Government and Research Institutes |
| Agribusiness Companies |
| Other End Users |
| North America | United States |
| Canada | |
| Mexico | |
| Rest of North America | |
| Europe | Germany |
| France | |
| Spain | |
| Italy | |
| Russia | |
| Rest of Europe | |
| Asia-Pacific | China |
| India | |
| Japan | |
| Australia | |
| Rest of Asia-Pacific | |
| South America | Brazil |
| Argentina | |
| Rest of South America | |
| Middle East | United Arab Emirates |
| Saudi Arabia | |
| Turkey | |
| Rest of Middle East | |
| Africa | South Africa |
| Rest of Africa |
| By Type | Soil Property Mapping | |
| Soil Classification Mapping | ||
| Other Types | ||
| By Technology | Drone Scouting | |
| Mobile Scouting | ||
| Satellite Imagery | ||
| Other Technologies | ||
| By Deployment Model | Cloud-Based Platforms | |
| Web and Mobile Platforms | ||
| Other Platforms | ||
| By End User | Agriculture Cooperatives | |
| Government and Research Institutes | ||
| Agribusiness Companies | ||
| Other End Users | ||
| By Geography | North America | United States |
| Canada | ||
| Mexico | ||
| Rest of North America | ||
| Europe | Germany | |
| France | ||
| Spain | ||
| Italy | ||
| Russia | ||
| Rest of Europe | ||
| Asia-Pacific | China | |
| India | ||
| Japan | ||
| Australia | ||
| Rest of Asia-Pacific | ||
| South America | Brazil | |
| Argentina | ||
| Rest of South America | ||
| Middle East | United Arab Emirates | |
| Saudi Arabia | ||
| Turkey | ||
| Rest of Middle East | ||
| Africa | South Africa | |
| Rest of Africa | ||
Key Questions Answered in the Report
What is the projected size of the digital soil mapping platforms and applications market?
The market is projected to reach USD 1.03 billion by 2031 from USD 0.59 billion in 2026, at a 12% CAGR from 2026 to 2031.
Which digital soil mapping platform type is the largest?
Soil Property Mapping was the largest type, with 55% share in 2025. It supports spatial decisions on fertilizer, lime, seed, and water management.
Which technology is growing fastest for digital soil mapping applications?
Mobile Scouting is the fastest technology segment, with a forecast CAGR of 16% from 2026 to 2031. It uses smartphone-based observations as inputs to mapping workflows.
How are digital soil maps used in soil carbon projects?
They can support spatial estimates of soil organic carbon and provide documented uncertainty information for eligible carbon-project measurement, reporting, and verification workflows.