Cybersecurity Mesh Architecture Market Size and Share
Market Overview
| Study Period | 2024 - 2030 |
|---|---|
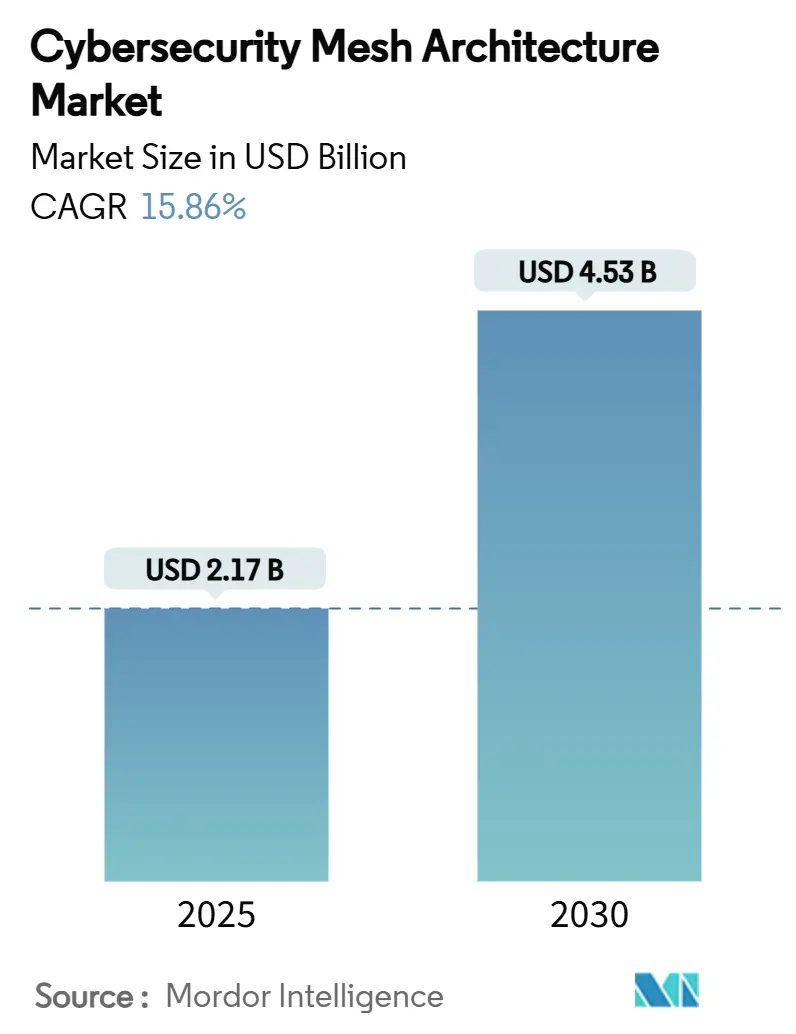
| Market Size (2025) | USD 2.17 Billion |
| Market Size (2030) | USD 4.53 Billion |
| Growth Rate (2025 - 2030) | 15.86% CAGR |
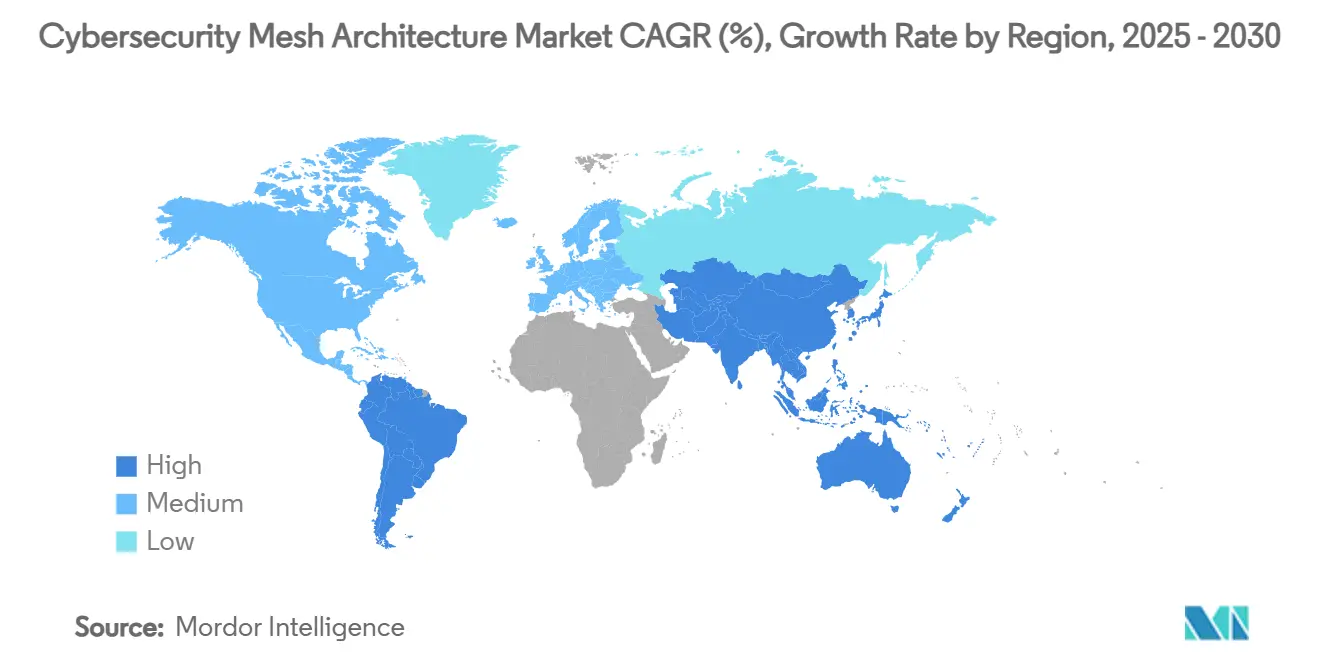
| Fastest Growing Market | Asia Pacific |
| Largest Market | North America |
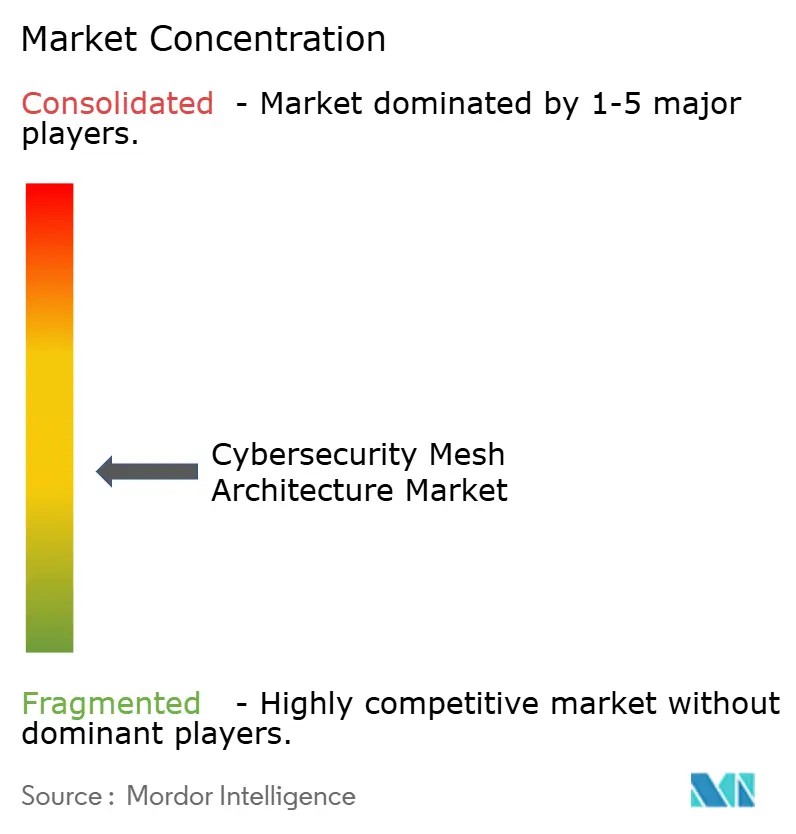
| Market Concentration | Medium |
Major Players
*Disclaimer: Major Players sorted in no particular order Image © Mordor Intelligence. Reuse requires attribution under CC BY 4.0. |
|
Cybersecurity Mesh Architecture Market Analysis by Mordor Intelligence
The cybersecurity mesh architecture market size stood at USD 2.17 billion in 2025 and is forecast to reach USD 4.53 billion by 2030, advancing at a 15.86% CAGR during 2025-2030. Current expansion is rooted in the shift from perimeter defences to identity-centric frameworks that safeguard distributed users, cloud workloads, and edge devices. Early enterprise pilots proved that mesh-based zero-trust controls reduce attack dwell time, driving board-level support for multi-year rollouts. Vendor consolidation, most notably Palo Alto Networks’ USD 700 million purchase of Protect AI, signals rising demand for integrated platforms that collapse point tools into a single policy fabric [1]Palo Alto Networks, “Palo Alto Networks to Acquire Protect AI,” paloaltonetworks.com. Skills shortages continue to encourage managed service uptake, while sector-specific regulations such as NIS2 heighten the need for unified telemetry across hybrid infrastructures.
Key Report Takeaways
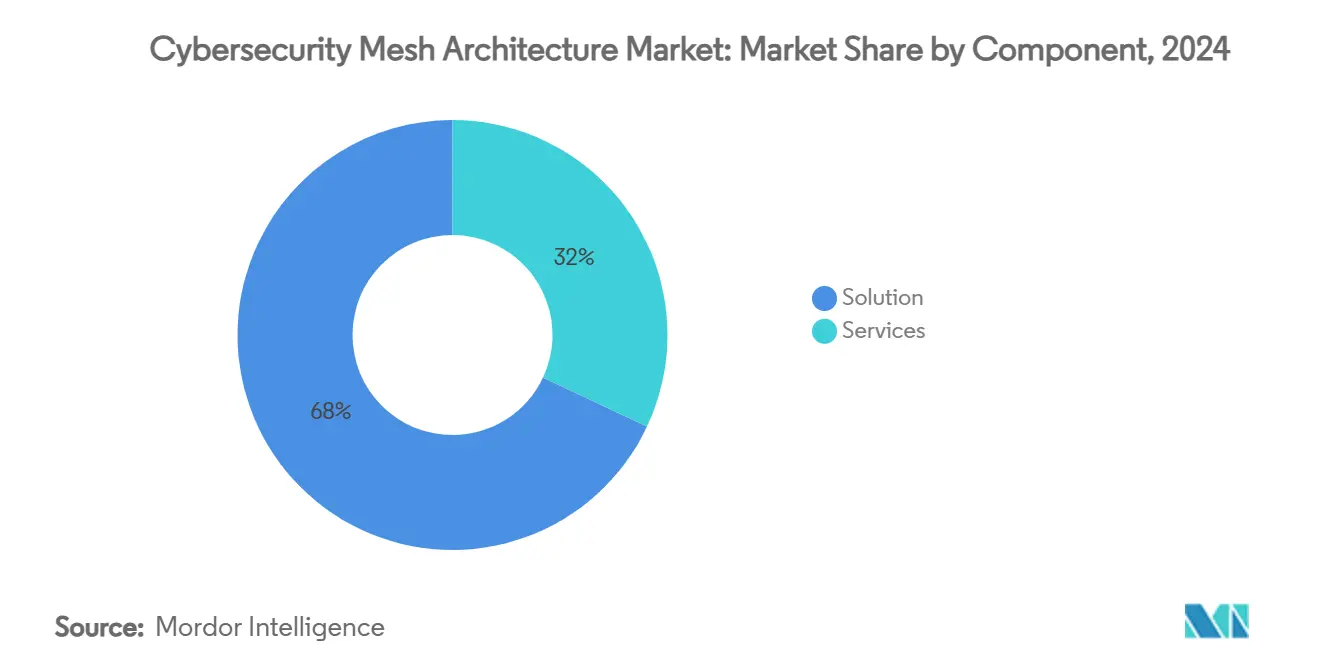
- By component, solutions generated 68% revenue in 2024; services are expanding at a 22.16% CAGR through 2030.
- By deployment mode, cloud accounted for 57% of the cybersecurity mesh architecture market share in 2024, whereas hybrid models are poised to grow at 19.22% CAGR.
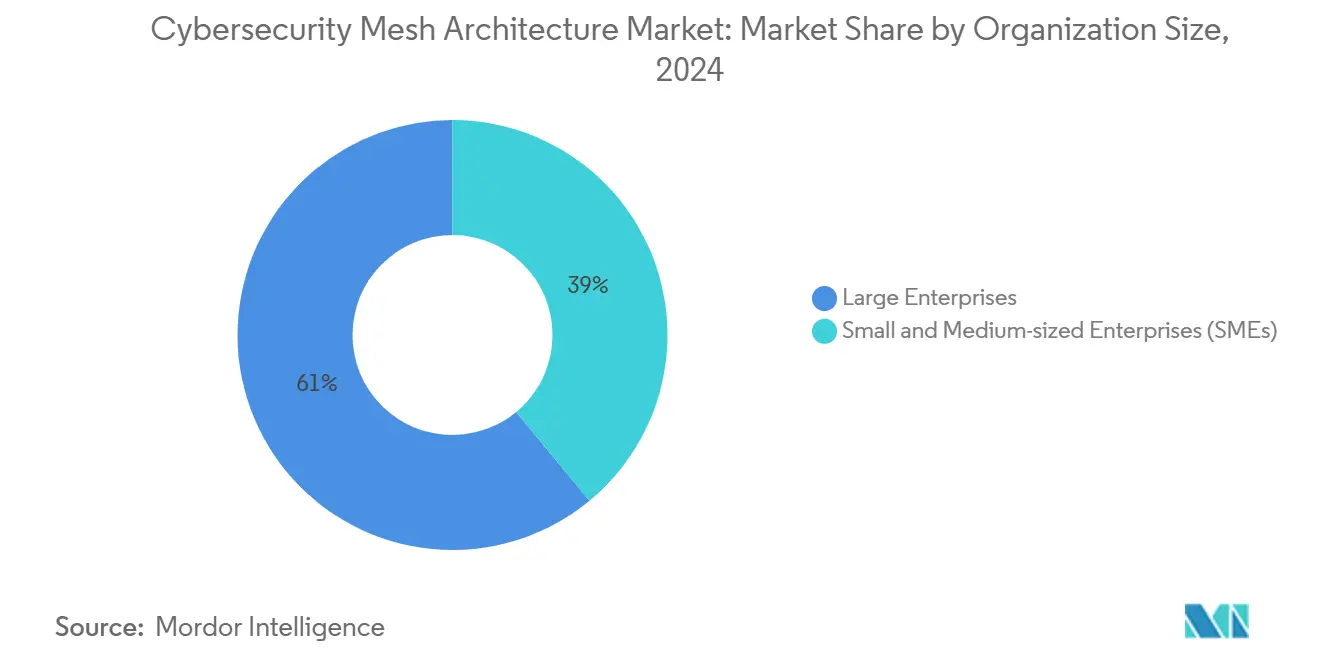
- By organization size, large enterprises captured 61% of the cybersecurity mesh architecture market size in 2024; small and medium-sized enterprises will accelerate at 20.71% CAGR to 2030.
- By industry vertical, BFSI led with 24% revenue share in 2024, and healthcare is advancing at a 20.22% CAGR through 2030.
- By geography, North America held 38% share in 2024, while Asia-Pacific is projected to post a 21.50% CAGR over the forecast horizon.
Global Cybersecurity Mesh Architecture Market Trends and Insights
Drivers Impact Analysis
| Driver | (~) % Impact on CAGR Forecast | Geographic Relevance | Impact Timeline |
|---|---|---|---|
| Surge in Zero-Trust and ZTNA deployments | 4.20% | Global, with North America and Europe leading adoption | Medium term (2-4 years) |
| Cloud and multi-cloud sprawl expanding attack surface | 3.80% | Global, particularly strong in APAC and North America | Short term (≤ 2 years) |
| Remote-work normalisation creating identity perimeters | 2.90% | Global, with emphasis on developed markets | Medium term (2-4 years) |
| Regulatory demand for unified security telemetry | 2.10% | Europe and North America primarily, expanding to APAC | Long term (≥ 4 years) |
| Open Cybersecurity Schema Framework (OCSF) catalysing interoperability | 1.70% | Global, with early adoption in North America | Long term (≥ 4 years) |
| AI and machine learning integration enhancing threat detection | 1.50% | Global, with concentrated adoption in developed markets | Medium term (2-4 years) |
| Source: Mordor Intelligence | |||
Surge in Zero-Trust and ZTNA deployments
Sixty-three percent of enterprises either deployed or expanded ZTNA in 2024, displacing VPNs that cannot authenticate users or devices continuously. Alaska Airlines recorded a 40% drop in security incidents after fortifying remote access with ZTNA[2]Fortinet, “Key Findings from the 2024 Cloud Security Report,” fortinet.com. Executive orders in the United States mandate federal zero-trust adoption by 2025, prompting parallel investment across critical-infrastructure operators. Vendors now bundle identity, micro-segmentation, and secure web gateways into unified mesh nodes, reducing policy drift and operational overhead.
Cloud and Multi-Cloud Sprawl Expanding Attack Surface
Seventy-eight percent of organisations run hybrid or multi-cloud estates, yet 72% lack the specialised skills to secure them effectively. Fragmented tooling produces blind spots that adversaries exploit, illustrated by breaches such as the 2024 Change Healthcare compromise. Enterprises therefore prioritise mesh platforms that enforce consistent controls across AWS, Azure, GCP, and on-premises workloads, shifting spending from isolated cloud-native controls to orchestrated policy engines.
Remote-Work Normalization Creating Identity Perimeters
Permanent distributed work elevates user and device identity to the primary control plane. Yelp’s migration from VPNs to a WireGuard-based zero-trust mesh improved authentication speed and minimised lateral movement risks. Microsoft’s security revenue surpassed USD 20 billion in 2025, underscoring commercial appetite for identity-first architectures. In finance and technology, continuous authentication has become a board-mandated safeguard for privileged access, reinforcing demand for adaptive policy engines within the cybersecurity mesh architecture market.
Regulatory Demand for Unified Security Telemetry
Frameworks such as NIS2 and sector-specific mandates now require continuous monitoring and evidentiary reporting, compelling organisations to centralise logs and threat intelligence. Integrated SIEM and XDR modules within mesh platforms correlate events from endpoints, clouds, and OT devices, providing auditors with consolidated dashboards. BFSI and healthcare adopters report audit preparation time reductions of 30%, freeing resources for proactive threat hunting.
Restraints Impact Analysis
| Restraint | (~) % Impact on CAGR Forecast | Geographic Relevance | Impact Timeline |
|---|---|---|---|
| Integration complexity and skills shortage | -2.80% | Global, particularly acute in emerging markets | Short term (≤ 2 years) |
| Organisational silos between SecOps and NetOps | -1.90% | Global, with greater impact in large enterprises | Medium term (2-4 years) |
| Proprietary data models causing vendor lock-in | -1.40% | Global, affecting all market segments | Long term (≥ 4 years) |
| High implementation costs and ROI uncertainty | -1.20% | Global, with stronger impact on SMEs and emerging markets | Short term (≤ 2 years) |
| Source: Mordor Intelligence | |||
Integration Complexity and Skills Shortage
The global cybersecurity workforce gap remains near 3.5 million openings, with cloud security and identity expertise in highest demand. Organisations cite a 12-month average lead time to recruit senior mesh architects, slowing project timelines. Managed security service providers (MSSPs) partly offset the deficit, yet high demand inflates costs and lengthens onboarding, tempering near-term adoption.
Organisational Silos Between SecOps and NetOps
Separate reporting lines hinder the cross-functional collaboration required for real-time policy enforcement. Enterprises that merged teams recorded 30% faster mean-time-to-detect, but culture change lags behind technology upgrades. Integrated dashboards that visualise network and security telemetry together are helping to bridge the divide, yet process re-engineering remains a multiyear effort.
Segment Analysis
By Component: Solutions Dominate Amid Services Acceleration
Solutions contributed 68% of 2024 revenue, reflecting demand for converged platforms that embed identity, network, endpoint, and cloud controls inside a single policy fabric. Vendors differentiate through AI-driven anomaly detection and API-first extensibility, features that resonate with large enterprises managing tens of thousands of users. Services, however, are expanding at 22.16% CAGR as the cybersecurity mesh architecture market deepens, with professional services guiding architectural design and change management. Managed detection and response packages leverage vendor telemetry to deliver 24/7 monitoring, a popular option for resource-constrained firms. Vendor acquisitions such as Fortinet’s USD 1.2 billion purchase of Lacework illustrate bidirectional expansion, with product suppliers adding consulting depth to secure renewal revenue.
Ongoing platform optimisation, policy tuning, and threat-led red-team exercises sustain post-deployment spending, cementing services’ role in lifetime value creation. Firms that outsource tier-one monitoring report 35% faster incident containment, validating the services growth thesis. As interoperability standards mature, solution-service bundles should widen addressable opportunity, reinforcing a positive feedback loop within the cybersecurity mesh architecture market.
By Deployment Mode: Cloud Leadership with Hybrid Momentum
Cloud deployments accounted for 57% of total revenue in 2024, benefiting from near-instant provisioning and consumption-based pricing. Early adopters enjoy elastic scaling that accommodates traffic spikes triggered by merger integrations or remote-work surges. Hybrid models, though, are registering a 19.22% CAGR because many enterprises retain sensitive workloads on-premises to satisfy data-sovereignty rules.
The hybrid approach requires policy synchronisation across SaaS, IaaS, and private data centres. Mesh gateways broker traffic, enforce attribute-based access, and feed real-time telemetry into central analytics engines. Organisations adopting hybrid report a 15-point improvement in compliance audit scores after unifying control planes. Edge-native deployment options that run on lightweight hardware extend mesh coverage to factories and retail outlets, broadening the cybersecurity mesh architecture market footprint.
By Organization Size: Enterprise Dominance With SME Acceleration
Large enterprises held 61% revenue share in 2024, attracted by the ability of mesh architectures to rationalise sprawling legacy estates and enforce least-privilege at scale. Case studies show Fortune 100 firms onboarding 120 applications in under a year and cutting access provisioning cycles to six hours. Smaller firms, however, will post a 20.71% CAGR to 2030 as SaaS consumption models eliminate upfront hardware expenditure.
Packaged reference architectures and templated policy sets reduce configuration complexity, enabling SMEs to achieve parity with larger peers. MSSPs bundle monitoring, threat hunting, and compliance reporting, turning capital expenditure into predictable operational outlays. This democratisation expands the cybersecurity mesh architecture market size among mid-market buyers, raising overall platform volume and encouraging further price normalisation.
Note: Segment shares of all individual segments available upon report purchase
By Industry Vertical: BFSI Leadership with Healthcare Surge
BFSI generated 24% of 2024 revenue, leveraging mesh architectures to comply with stringent regulations and protect high-value digital assets. Continuous authentication and transaction-level micro-segmentation reduce fraud exposure, while integrated SIEM feeds satisfy audit trail requirements. Healthcare and life sciences will grow at 20.22% CAGR as telemedicine and connected medical devices proliferate.
Mesh nodes deployed at hospital edges secure traffic from imaging systems and IoT sensors, feeding analytics that pinpoint anomalous device behaviour. Manufacturing and retail increasingly adopt mesh to secure supply chains and point-of-sale networks, evidencing the horizontal applicability of identity-centric protection. Cross-industry uptake cushions vendors against vertical-specific spending shocks and diversifies the cybersecurity mesh architecture market.
Geography Analysis
North America retained 38% share in 2024, underpinned by early adoption of zero-trust mandates and a robust venture capital ecosystem that accelerates product maturation. Federal policy now requires civilian agencies to implement mesh-aligned architectures, sustaining demand across public-sector integrators and cloud service providers. Financial institutions in the region standardise on unified identity and network controls to reduce audit costs and streamline merger integrations.
Asia-Pacific is the fastest-growing theatre, projected at 21.50% CAGR through 2030. National cybersecurity frameworks in India and regulatory tightening across ASEAN member states stimulate mesh deployments that can accommodate diverse cloud providers while enforcing data localisation. The prevalence of mobile first workforces and Industry 4.0 investments expands attack surfaces, prompting manufacturers and telecom operators to embed distributed enforcement points across factories and cell sites.
Europe maintains steady growth driven by GDPR and the NIS2 directive. Firms prioritise mesh capabilities that support policy-based routing and local data processing to comply with sovereignty rules. Hybrid deployment preference is strong, with enterprises balancing public-cloud elasticity against on-premises control for sensitive datasets. Government incentives targeting critical infrastructure upgrades further anchor demand, ensuring the cybersecurity mesh architecture market remains resilient despite macroeconomic headwinds.[4]AT&T, “AT&T and Palo Alto Networks Revolutionize Business Security,” about.att.com
Competitive Landscape
The market exhibits moderate fragmentation with increasing consolidation momentum. Top-tier vendors pursue acquisitions to enrich identity, analytics, and hardware portfolios, aiming to deliver end-to-end platforms that simplify procurement and operations. Palo Alto Networks’ acquisition spree, including Protect AI and the pending SentinelOne deal, exemplifies this logic. Cisco, Fortinet, and Check Point integrate network and security functions, creating value propositions that resonate with enterprises collapsing siloed teams.
Emerging specialists focus on cloud-native, API-first designs that interoperate via OCSF schemas, thereby slotting into heterogeneous estates without vendor lock-in. Partners such as AT&T and T-Mobile bundle secure connectivity and mesh enforcement at the carrier layer, broadening reach into mid-market customers. Artificial intelligence and machine learning capabilities differentiate detection accuracy and automate policy remediation, driving measurable reductions in mean-time-to-respond.
Competitive factors include proof of efficacy, platform breadth, ecosystem integrations, and managed service depth. Customer references increasingly demand quantifiable ROI such as reduced breach dwell time, regulatory fine avoidance, and operational efficiencies. Vendors that demonstrate rapid deployment, flexible licensing, and strong partner programmes are best positioned to capture incremental spend as the cybersecurity mesh architecture market matures.[3]IT Security Guru, “Check Point and Illumio Team Up to Advance Zero Trust,” itsecurityguru.org
Cybersecurity Mesh Architecture Industry Leaders
-
Palo Alto Networks, Inc.
-
Fortinet, Inc.
-
Cisco Systems, Inc.
-
International Business Machines Corporation
-
Zscaler, Inc.
- *Disclaimer: Major Players sorted in no particular order
Recent Industry Developments
- July 2025: Palo Alto Networks extended its zero-trust alliance with Okta to enhance identity threat protection through integrated visibility and secure browser controls.
- May 2025: Okta introduced Cross App Access to secure AI agents that interface with enterprise data.
- April 2025: T-Mobile and Palo Alto Networks launched a managed SASE offering that merges 5G Advanced connectivity with Prisma SASE 5G security.
- April 2025: AT&T and Palo Alto Networks formed a strategic agreement to embed AI-powered threat prevention inside AT&T’s network backbone.
Key Questions Answered in the Report
What is the projected value of the cybersecurity mesh architecture market by 2030?
The market is forecast to reach USD 4.53 billion by 2030.
Which region shows the fastest growth for cybersecurity mesh adoption?
Asia-Pacific is expected to register a 21.50% CAGR through 2030.
Why are services growing faster than solutions in this segment?
Complex implementations and talent shortages drive enterprises to seek professional and managed services that ensure continuous optimisation and monitoring.
How does a mesh architecture support regulatory compliance?
It unifies security telemetry across cloud and on-premises assets, enabling continuous monitoring and audit-ready reporting aligned with mandates such as NIS2 and GDPR.
Which vertical currently leads spending?
Banking, financial services, and insurance hold the largest slice at 24% of 2024 revenue.
What deployment model is gaining momentum among highly regulated firms?
Hybrid architectures are expanding at a 19.22% CAGR as organisations balance cloud scalability with on-premises data sovereignty controls.
Page last updated on:


