
Cross-Border Fiber Route Market Size and Share
Market Overview
| Study Period | 2020 - 2031 |
|---|---|
| Market Size (2026) | USD 22.65 Billion |
| Market Size (2031) | USD 36.82 Billion |
| Growth Rate (2026 - 2031) | 10.21 % |
| Fastest Growing Market | Africa |
| Largest Market | Asia-Pacific |
| Market Concentration | Medium |
Major Players *Disclaimer: Major Players sorted in no particular order Image © Mordor Intelligence. Reuse requires attribution under CC BY 4.0. | |
Cross-Border Fiber Route Market Analysis by Mordor Intelligence
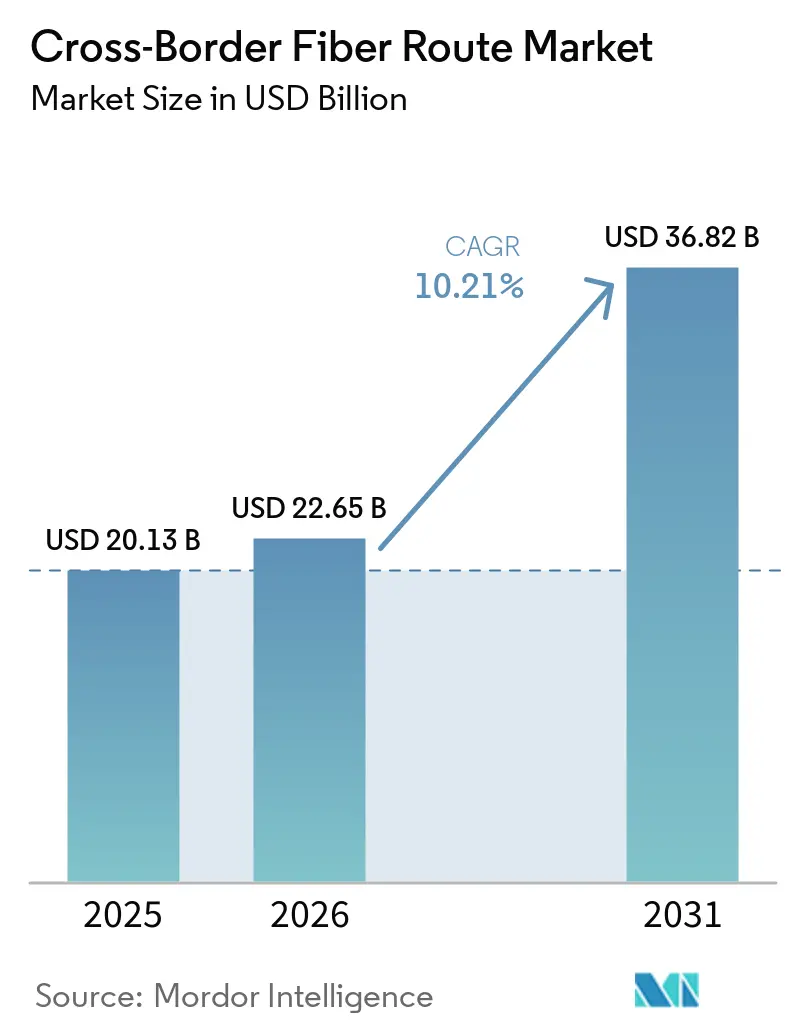
The Cross-border fiber route market size was valued at USD 20.13 billion in 2025 and estimated to grow from USD 22.65 billion in 2026 to reach USD 36.82 billion by 2031, at a CAGR of 10.21% during the forecast period (2026-2031). Investment is moving toward routes that connect data centers across national borders and provide several physical paths for critical traffic. AI computing has increased the need for dedicated capacity between geographically dispersed facilities, while cloud providers have also increased direct participation in cable projects. The Cross-border fiber route market is therefore seeing stronger demand for route diversity, controllable capacity, and faster recovery options. This change is challenging carrier models that relied mainly on managed network services, because some large users now seek fiber pairs and private systems. Investment opportunities are strongest where terrestrial and submarine assets can be combined, where permitting is predictable, and where new routes reduce reliance on congested corridors.
Key Report Takeaways
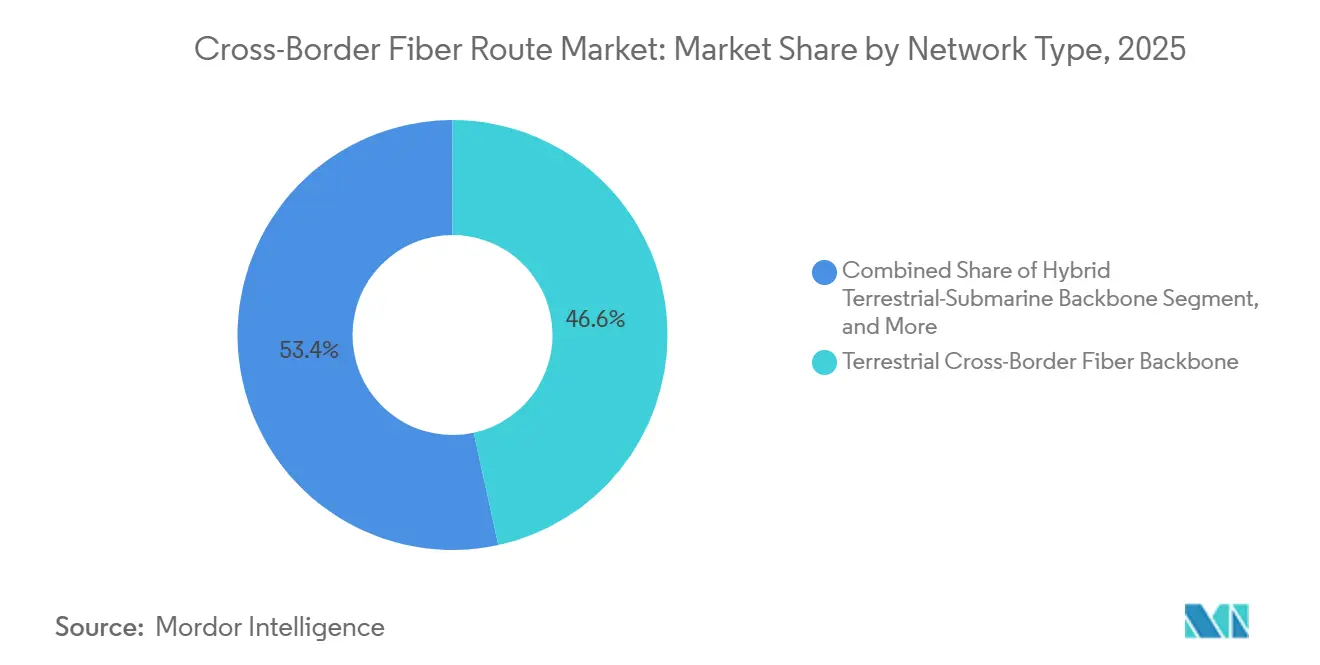
- By network type, terrestrial cross-border fiber backbones held 46.58% of the Cross-border fiber route market share in 2025, while hybrid terrestrial-submarine backbones are projected to expand at a 11.59% CAGR through 2031.
- By ownership type, consortium ownership held 43.93% of the sector in 2025, while wholesale neutral host ownership is expected to grow at a CAGR of 11.37% through 2031.
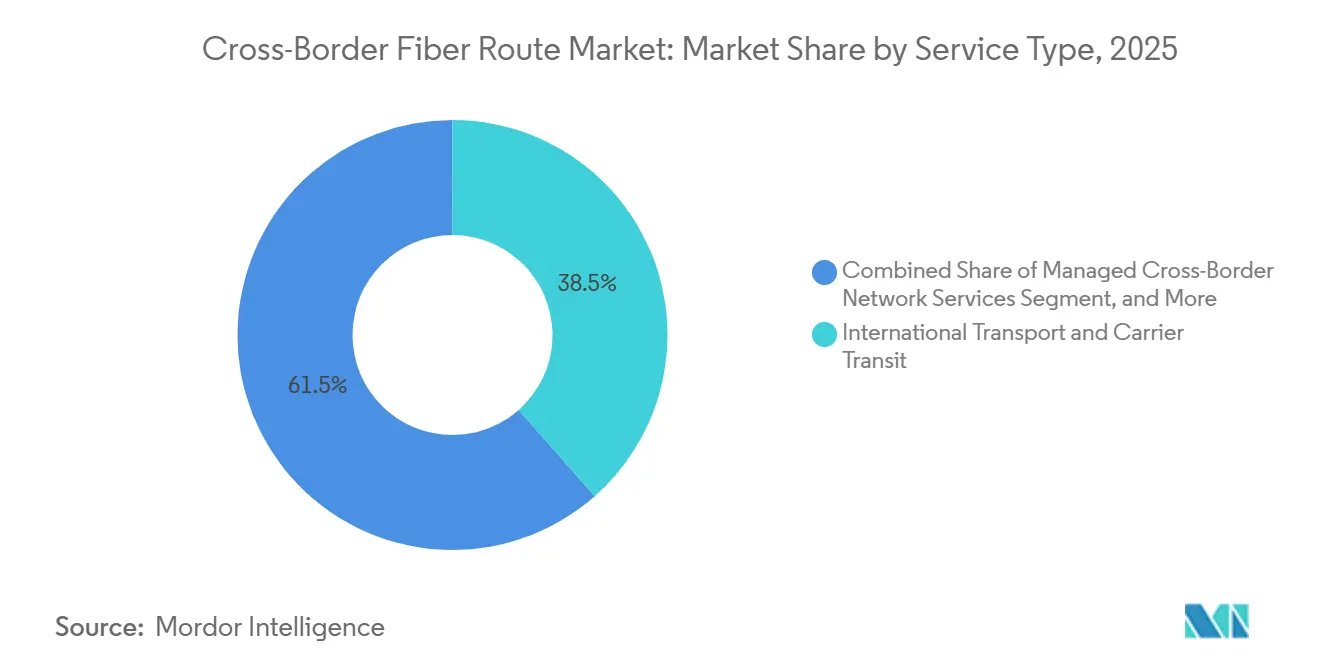
- By service type, international transport and carrier transit accounted for 38.49% of the Cross-border fiber route market in 2025, while dark fiber and fiber-pair IRUs are projected to grow at a 11.86% CAGR through 2031.
- By application, telecom carrier transit held 32.67% of the sector in 2025, while hyperscaler and cloud interconnect is projected to expand at a 12.26% CAGR through 2031.
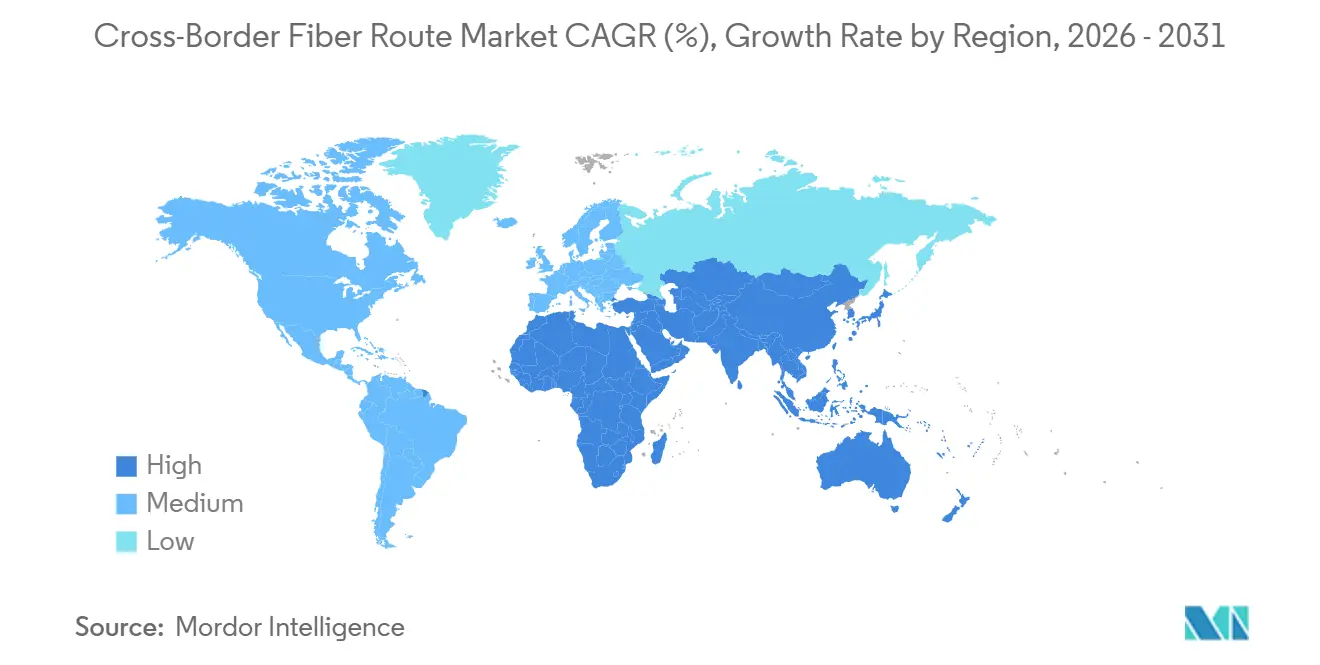
- By geography, Asia-Pacific held 35.42% share in 2025, while Africa is projected to expand at a 12.65% CAGR through 2031.
Note: Market size and forecast figures in this report are generated using Mordor Intelligence’s proprietary estimation framework, updated with the latest available data and insights as of January 2026.
Market Trends and Insights
Drivers Impact Analysis of Cross-Border Fiber Route Market*
| Driver | (~) % Impact on CAGR Forecast | Geographic Relevance | Impact Timeline |
|---|---|---|---|
| Hyperscaler and AI-Cluster Interconnection Demand | +3.2% | Global, concentrated in Asia-Pacific and North America-Europe corridors | Short term (≤ 2 years) |
| Direct Private-Cable Ownership by Content Providers | +2.1% | Global, Pacific, Atlantic, and Indian Ocean routes | Short term (≤ 2 years) |
| Sovereign Connectivity and Data-Localization Mandates | +1.6% | Asia-Pacific, Europe, Middle East and Africa, with spillover to South America | Medium term (2-4 years) |
| Route Diversification Away From Geopolitical Chokepoints | +1.2% | Middle East and Africa, Asia-Pacific, with early gains in India-Gulf and ASEAN corridors | Medium term (2-4 years) |
| Digital Corridor Programs in Underserved Regions | +0.9% | Africa and South America, with spillover to South Asian hinterland | Long term (≥ 4 years) |
| Predictive Route Engineering for Distributed AI Workloads | +0.5% | Global, with early gains in North America and Northern Europe | Medium term (2-4 years) |
| Source: Mordor Intelligence | |||
Hyperscaler and AI-Cluster Interconnection Demand
Hyperscalers held 75% of total international subsea bandwidth in 2025, after having a negligible share in 2010. They also participated in more than two-thirds of planned submarine cable deployments in 2025. AI training and inference workloads move very large datasets between data centers in different jurisdictions. This requirement favors dedicated fiber pairs and routes with predictable latency and low packet loss. The Cross-border fiber route market is shifting toward links between GPU-dense locations rather than only traditional consumer internet city pairs. EXA Infrastructure reported in 2026 that financial services customers had moved from 1G and 10G orders to 100G and 400G orders as they brought data into AI models.
Direct Private-Cable Ownership by Content Providers
Content providers are moving from leased capacity toward direct ownership of submarine and terrestrial fiber assets. This approach gives them greater control over capacity, security, and upgrade decisions on routes used for cloud and AI traffic. Larger private systems in the Cross-border fiber route market also change the balance of demand available to wholesale carriers. Some jointly built systems provide commercial parties with access to fiber pairs or spectrum, yet that capacity is not assured to remain available as internal demand grows. The Cross-border fiber route market increasingly favors operators that can combine terrestrial, subsea, and landing-station assets into a single service design. Smaller wholesale providers can face a material disadvantage when customers require end-to-end capacity from a single supplier on high-priority international corridors.
Sovereign Connectivity and Data-Localization Mandates
Data-localization rules increase demand in the Cross-border fiber route market for transport paths that can meet jurisdictional, security, and recovery requirements. The Council of the European Union stressed in 2025 the need for redundant cross-border terrestrial fiber-optic connections and submarine cables to support Europe’s global connectivity and strategic autonomy.[1] Buyers with sovereignty requirements can accept greater cost and complexity when routing avoids politically exposed locations. The Gigabit Infrastructure Act entered into force in November 2024 and set measures intended to ease the rollout of high-capacity connectivity networks. These measures support the deployment of passive infrastructure and can strengthen future demand for the backbone. In the Cross-border fiber route market, providers that can document control over route geography and operational recovery can differentiate themselves from commodity capacity suppliers.
Route Diversification Away from Geopolitical Chokepoints
Reliance on a limited number of cable corridors has increased the value of alternative physical paths in the Cross-border fiber route market. The International Telecommunication Union and the International Cable Protection Committee reported that approvals for Red Sea cable repairs took up to 8 weeks during events in March 2024. Delays of this kind can leave carriers exposed when their networks depend on a single route. The European Commission allocated EUR 389 million (USD 440 million) in the 2025 fourth funding round of the Connecting Europe Facility Digital program for cable, 5G, and quantum communication infrastructure. The program supports resilient terrestrial and subsea links that reduce dependence on congested or politically sensitive corridors. Hybrid systems can offer a practical alternative where an all-subsea route cannot avoid sensitive transit points without adding unacceptable delay.
Restraints Impact Analysis of Cross-Border Fiber Route Market*
| Restraint | (~) % Impact on CAGR Forecast | Geographic Relevance | Impact Timeline |
|---|---|---|---|
| High Marine, Landing-Station, and Cross-Border Backhaul Capex | -2.5% | Global, most acute in the South Atlantic, Africa, and Pacific Islands | Long term (≥ 4 years) |
| Permitting and Environmental-Approval Delays | -1.8% | Global, with the most severe effects in the Mediterranean, Pacific Islands, and United States federal waters | Medium term (2-4 years) |
| Repair-Vessel and Specialized Component Bottlenecks | -1.1% | South Atlantic, Africa, and South Indian Ocean | Long term (≥ 4 years) |
| Corridor-Specific Security Exposure and Insurance Repricing | -0.8% | Middle East and Africa and Asia-Pacific, with early pressure in the North Atlantic | Short term (≤ 2 years) |
| Source: Mordor Intelligence | |||
High Marine, Landing-Station, and Cross-Border Backhaul Capex
Marine cable systems, landing stations, and terrestrial backhaul require major upfront funding. Cable-build lead times had increased from 18 months to 48 months by 2026 due to constrained manufacturing capacity among a small group of cable-system vendors. That change requires investors to commit capital for longer periods before revenue is certain. It also widens the gap between hyperscalers with internal funding flexibility and smaller operators that depend on project finance. EXA Infrastructure’s London-Frankfurt-Amsterdam-Brussels route, deployed in July 2025, included the company’s 21st and 22nd cable landing stations. Civil works, power supply, regulatory bonding, marine planning fees, and coastal-state access charges raise the total cost of a new route in the Cross-border fiber route market.
Permitting and Environmental-Approval Delays
Permitting poses operational risk for the Cross-border fiber route market because approval periods vary widely across jurisdictions. The ITU and ICPC found in 2026 that landing rights and environmental approvals took 6 to 12 months or more in standard cases. Complex coastal and environmentally sensitive settings could extend this process to 24-36 months. U.S. testimony in 2025 described projects that extended beyond 3 years and involved up to 11 federal agencies with overlapping responsibilities. Long approval windows favor participants with established regulatory teams and government relationships, thereby raising entry barriers in the Cross-border fiber route market.
*Our forecasts treat driver/restraint impacts as directional, not additive. The impact forecasts reflect baseline growth, mix effects, and variable interactions.
Cross-Border Fiber Route Market Segment Analysis
By Network Type:
Hybrid Routes Outpace Terrestrial IncumbencyTerrestrial cross-border fiber backbones accounted for 46.58% of the Cross-border fiber route market in 2025. Their position reflects established rights-of-way, lower repair complexity, and mature carrier relationships across land corridors. These systems remain important in the Americas, Europe, and Central Asia, where they connect metropolitan networks and international gateways. Submarine backbone systems provide the intercontinental links that connect these terrestrial networks. Their essential role in high-volume ocean traffic means the Cross-border fiber route market depends on both land and marine assets rather than a single infrastructure format.
Hybrid terrestrial-submarine backbones are projected to record an 11.59% CAGR through 2031. They combine marine and overland sections when a single infrastructure type cannot provide sufficient diversity, latency control, or resilience. A 2026 technical demonstration achieved 400G per wavelength over 5,682 km of subsea cable using coherent pluggable optics. The result indicates that long subsea sections can support higher-capacity services without discrete transponder regeneration, while GÉANT demonstrated 400G transmission over a 3,403 km terrestrial link in 2025 without regeneration.[2] These developments make hybrid route designs more relevant for AI-oriented connectivity requirements.

By Ownership Type:
Open-Access Models Challenge Consortium DominanceConsortium ownership accounted for 43.93% of the sector in 2025. This model allows several carriers to share the capital risk of systems on important oceanic corridors. It remains appropriate where a route serves several operators with aligned strategic needs. PCCW Global, Sparkle, Telecom Egypt, and Zain Omantel International signed a memorandum of understanding for the AAE-2 cable system in June 2025. The project shows that consortium structures retain value for complex intercontinental systems and can distribute risk across the entities that use the capacity.
Wholesale neutral-host ownership is expected to grow at a 11.37% CAGR from 2026 to 2031. Open-access platforms can sell dark fiber, wavelengths, or managed capacity without competing directly for end-user business. This arrangement can help smaller carriers, public entities, and enterprises that cannot commit to a full IRU position, while supporting development where no single party wants to finance a complete system. Single ownership remains relevant for private systems where users require full traffic control and isolation. The Cross-border fiber route market can support both ownership models because buyers differ in their funding capacity, security needs, and willingness to share infrastructure.
By Service Type:
Dark Fiber IRUs Emerge as a Strategic Capacity LayerInternational transport and carrier transit accounted for 38.49% of the Cross-border fiber route market in 2025. This service supports wholesale IP transit used by mobile and fixed broadband networks. Carrier transit remains central to global backbone operations, although its share is under pressure as large enterprises and cloud providers acquire direct physical capacity. Dark fiber services give customers greater control over performance and equipment choices. Managed network services remain important for organizations without internal network operations resources.
Dark fiber and fiber-pair IRUs are projected to grow at an 11.86% CAGR through 2031. Users adopt these services when they want control over the wavelength and fiber levels rather than relying on carrier-managed pricing and performance. This transition can reduce managed-service revenue for carriers even when traffic continues on the same physical route. Orange Wholesale opened new dark fiber routes between Spain and Germany in 2025 through the Pyrenees. The routes offered an alternative to congested Mediterranean and Atlantic corridors, while wavelength and spectrum services offer flexibility without requiring users to operate a fiber pair.
By Application:
AI Interconnect Redefines Demand HierarchyTelecom carrier transit held 32.67% of the sector in 2025. It supports mobile and fixed broadband traffic and remains the largest application by volume. Financial services and low-latency trading have an outsized effect on route design because users will pay for very low delay. Anova Financial Networks introduced a CME-to-London service in June 2025 that combined microwave connectivity from Chicago to New Jersey with transatlantic fiber. These deployments show how early trading applications can establish demand for advanced route technologies.
Hyperscaler and cloud interconnect is expected to be the fastest-growing application, with a 12.26% CAGR from 2026 to 2031. AI workloads require links between geographically dispersed GPU clusters and place strict demands on delay consistency and packet loss. These requirements are difficult to meet with a generic carrier transit alone. Private fiber pairs can give cloud providers more direct control over transport capacity. Government, defense, content delivery, and media applications sustain demand for resilience and geographic redundancy, moving the Cross-border fiber route market toward applications that value physical route diversity as much as nominal bandwidth.
Geography Analysis
APAC Cross-Border Fiber Route Market
Asia-Pacific held 35.42% of the Cross-border fiber route market share in 2025. The region combines subsea landing infrastructure, hyperscaler data centers, and AI computing capacity across China, Japan, India, South Korea, and Southeast Asia. Chunghwa Telecom invested more than NTD 2.4 billion (USD 73 million) in the AUG East intra-Asian subsea cable in July 2025.[3] The system is expected to have landings on Taiwan’s Yilan and Taitung coasts and target completion in 2029. The SJC2 intra-Asia cable became operational in 2025 with a design capacity of 126 Tbps, connecting Hong Kong, Japan, and Singapore, while Tata Communications committed USD 152 million in 2026 to expand India-Singapore capacity via the MIST Cable System and a new Chennai-Singapore consortium cable.
North America and Europe Cross-Border Fiber Route Market
North America and Europe continue to attract major cross-border route investment. EXA Infrastructure launched Project Visegrád in September 2025, connecting Warsaw, Prague, Bratislava, and Budapest through new international routes. EXA completed its acquisition of Aqua Comms in December 2025, adding 9 North Atlantic routes and expanding its cable landing portfolio to 29 stations. The Cross-border fiber route market benefits in this region from established demand centers and the European Commission’s 2025 funding for secure backbone fiber, 5G, and quantum communications. The funding favors additional interconnections across Central and Eastern Europe.
Africa Cross-Border Fiber Route Market
Africa is projected to grow at a 12.65% CAGR from 2026 to 2031, the highest regional rate in the Cross-border fiber route market. The African Development Bank approved a USD 200 million loan for Nigeria’s Digital Value Chain Infrastructure Project in April 2026, targeting expansion of the national fiber backbone from 30,000 km to 120,000 km and links to Benin, Cameroon, Niger, and Chad. Seacom deployed a Nairobi-Kampala terrestrial route in June 2026 with 1 Tbps of initial capacity that can scale to 30 Tbps, improving inland access to coastal landing stations. Repair capacity remains a regional constraint because the ITU and ICPC reported in 2026 that the South Indian Ocean had no permanently stationed repair vessels.
Competitive Landscape
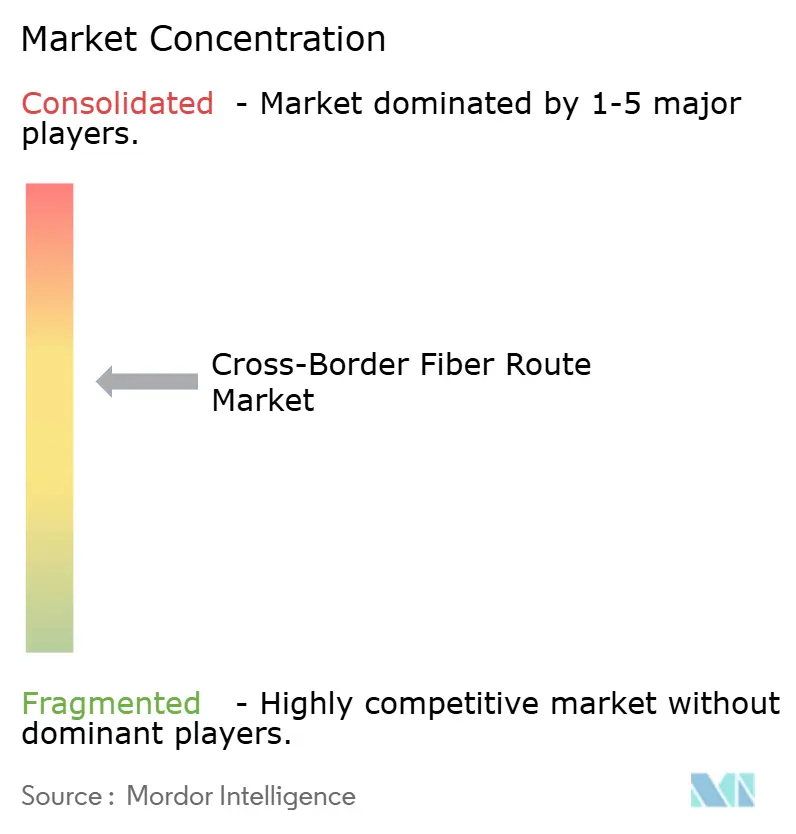
The Cross-border fiber route market is moderately concentrated on major intercontinental corridors. Arelion, Colt Technology Services, and EXA Infrastructure hold significant capacity on important continental and transoceanic routes. Hyperscalers also participated in more than two-thirds of planned submarine cable deployments in 2025. Their preference for private infrastructure can reduce the wholesale capacity available on high-value corridors. Carriers are responding through neutral-host models, AI-focused route design, and investment in corridors with less private hyperscaler capacity, leaving room for independent providers that offer secure and diverse end-to-end routes.
Zayo completed the acquisition of Crown Castle’s Fiber Solutions business in 2026 for a combined transaction value of USD 8.5 billion.[4] ZAYO The transaction expanded metro reach and strengthened Zayo’s ability to provide continuous connectivity to AI-oriented customers. EXA Infrastructure added 9 North Atlantic routes through its Aqua Comms acquisition in December 2025. Tata Communications expanded its India-Singapore capacity position in 2026 through MIST and a new consortium cable. These moves make scale, landing assets, and metro access more important for serving customers seeking a single provider across long-haul and local network segments.
Technology is becoming a more important basis for differentiation as conventional capacity advantages narrow. Coherent optical pluggables can increase capacity on installed fiber pairs without replacing subsea wet plant. Multi-vendor IPoDWDM testing has shown how operators can automate capacity control across international network domains. Unserved trans-Andean and Central Asian routes can offer opportunities for open-access IRU arrangements before private builds reach scale, while standards participation and interoperable optical systems can shorten the time needed to introduce capacity products. The Cross-border fiber route industry is balancing physical expansion with software control, equipment compatibility, and access to landing and terrestrial assets.
Cross-Border Fiber Route Industry Leaders
-
Arelion AB
-
Colt Technology Services Group Limited
-
Zayo Group Holdings, Inc.
-
EXA Infrastructure Services UK Limited
-
RETN Limited
- *Disclaimer: Major Players sorted in no particular order
Cross-Border Fiber Route Market Companies Covered in this Report
- Arelion AB
- Colt Technology Services Group Limited
- Zayo Group Holdings, Inc.
- EXA Infrastructure Services UK Limited
- RETN Limited
- Tata Communications Limited
- NTT DOCOMO BUSINESS, Inc.
- Orange S.A.
- Telecom Italia Sparkle S.p.A.
- PCCW Global, Inc.
- Lumen Technologies, Inc.
- GTT Communications, Inc.
- GlobalConnect A/S
- Cogent Communications Holdings, Inc.
- Deutsche Telekom AG
- Telefónica Global Solutions, S.L.U.
- Singapore Telecommunications Limited
- SubCom, LLC
- NEC Corporation
- Alcatel Submarine Networks SAS
- HMN Technologies Co., Ltd.
- Ciena Corporation
- Nokia Corporation
- Telxius Telecom, S.A.
Recent Industry Developments in Cross-Border Fiber Route Market
- July 2026: Lightstorm, Microsoft, Singtel, and Tata Communications signed contracts to build the India-Southeast Asia (I-2SEA) submarine cable, appointing NEC Corporation as system supplier. The 3,600 km system targets a 2029 ready-for-service date and is purpose-built for AI, GPU, and hyperscale enterprise connectivity across the India-Malaysia-Singapore corridor.
- June 2026: Seacom deployed a new high-capacity Nairobi-Kampala terrestrial fiber route, activating 1 Tbps of initial capacity with scalability to 30 Tbps, reinforcing one of East Africa’s most critical digital corridors and improving inland access to subsea cable landing stations at Mombasa.
- April 2026: The African Development Bank approved a USD 200 million loan for Nigeria’s Digital Value Chain Infrastructure Project, targeting expansion of the national backbone from 30,000 km to 120,000 km and establishing cross-border fiber links to Benin, Cameroon, Niger, and Chad.
- October 2025: NTT DOCOMO BUSINESS and NTT Com Asia launched the APN InterLink service in Hong Kong using All-Photonic Network technology, targeting ultra-low-latency cross-border connectivity for financial institutions and algorithmic trading operations at the Hong Kong Stock Exchange.
Global Cross-Border Fiber Route Market Report Scope
The cross-border fiber route market encompasses the development, deployment, operation, and management of fiber-optic network routes connecting two or more countries to support international data transmission. The scope of the report includes an analysis of market trends, growth drivers, restraints, opportunities, infrastructure investments, regulatory developments, and competitive dynamics related to terrestrial and submarine cross-border fiber connectivity.
The Cross-Border Fiber Route Market Report is Segmented by Network Type (Terrestrial Cross-Border Fiber Backbone, Submarine Fiber Backbone, and Hybrid Terrestrial-Submarine Backbone), Ownership Type (Single Ownership, Consortium Ownership, and Wholesale Neutral Host Ownership), Service Type (Dark Fiber and Fiber-Pair IRUs, Wavelength and Spectrum Capacity, International Transport and Carrier Transit, and Managed Cross-Border Network Services), Application (Hyperscaler and Cloud Interconnect, Telecom Carrier Transit, Data Center Interconnect, Government and Defense Connectivity, Financial Services and Low-Latency Trading Connectivity, and Content Delivery and Media Distribution), and Geography (North America, South America, Europe, Asia-Pacific, Middle East, and Africa). The Market Forecasts are Provided in Terms of Value (USD).
| Terrestrial Cross-Border Fiber Backbone |
| Submarine Fiber Backbone |
| Hybrid Terrestrial-Submarine Backbone |
| Single Ownership |
| Consortium Ownership |
| Wholesale Neutral Host Ownership |
| Dark Fiber and Fiber-Pair IRUs |
| Wavelength and Spectrum Capacity |
| International Transport and Carrier Transit |
| Managed Cross-Border Network Services |
| Hyperscaler and Cloud Interconnect |
| Telecom Carrier Transit |
| Data Center Interconnect |
| Government and Defense Connectivity |
| Financial Services and Low-Latency Trading Connectivity |
| Content Delivery and Media Distribution |
| North America | United States |
| Canada | |
| Mexico | |
| South America | Brazil |
| Chile | |
| Argentina | |
| Rest of South America | |
| Europe | Germany |
| United Kingdom | |
| France | |
| Russia | |
| Rest of Europe | |
| Asia-Pacific | China |
| Japan | |
| India | |
| South Korea | |
| Rest of Asia-Pacific | |
| Middle East | Saudi Arabia |
| United Arab Emirates | |
| Turkey | |
| Rest of Middle East | |
| Africa | South Africa |
| Nigeria | |
| Egypt | |
| Rest of Africa |
| By Network Type | Terrestrial Cross-Border Fiber Backbone | |
| Submarine Fiber Backbone | ||
| Hybrid Terrestrial-Submarine Backbone | ||
| By Ownership Type | Single Ownership | |
| Consortium Ownership | ||
| Wholesale Neutral Host Ownership | ||
| By Service Type | Dark Fiber and Fiber-Pair IRUs | |
| Wavelength and Spectrum Capacity | ||
| International Transport and Carrier Transit | ||
| Managed Cross-Border Network Services | ||
| By Application | Hyperscaler and Cloud Interconnect | |
| Telecom Carrier Transit | ||
| Data Center Interconnect | ||
| Government and Defense Connectivity | ||
| Financial Services and Low-Latency Trading Connectivity | ||
| Content Delivery and Media Distribution | ||
| By Geography | North America | United States |
| Canada | ||
| Mexico | ||
| South America | Brazil | |
| Chile | ||
| Argentina | ||
| Rest of South America | ||
| Europe | Germany | |
| United Kingdom | ||
| France | ||
| Russia | ||
| Rest of Europe | ||
| Asia-Pacific | China | |
| Japan | ||
| India | ||
| South Korea | ||
| Rest of Asia-Pacific | ||
| Middle East | Saudi Arabia | |
| United Arab Emirates | ||
| Turkey | ||
| Rest of Middle East | ||
| Africa | South Africa | |
| Nigeria | ||
| Egypt | ||
| Rest of Africa | ||
Key Questions Answered in the Report
What is the size of the Cross-border fiber route market?
The Cross-border fiber route market was valued at USD 20.13 billion in 2025, is estimated at USD 22.65 billion in 2026, and is forecast to reach USD 36.82 billion by 2031.
What CAGR is forecast for cross-border fiber routes through 2031?
The sector is forecast to grow at a 10.21% CAGR from 2026 to 2031, supported by cloud interconnect, AI workloads, and route-diversification needs.
Which network configuration is growing fastest?
Hybrid terrestrial-submarine backbones are projected to grow at a 11.59% CAGR through 2031 because they combine route diversity with long-distance capacity.
Why are cloud providers investing in private fiber systems?
Dedicated fiber pairs provide greater control over capacity, latency, security, and upgrades for AI and cloud traffic between dispersed data centers.
Which region is expected to grow fastest?
Africa is expected to grow at a 12.65% CAGR through 2031, supported by new terrestrial corridors and national backbone expansion projects.