
Dark Fiber Pricing Benchmarking Market Size and Share
Market Overview
| Study Period | 2020 - 2031 |
|---|---|
| Market Size (2026) | USD 5.24 Billion |
| Market Size (2031) | USD 7.68 Billion |
| Growth Rate (2026 - 2031) | 7.95 % |
| Fastest Growing Market | Asia-Pacific |
| Largest Market | North America |
| Market Concentration | Medium |
Major Players *Disclaimer: Major Players sorted in no particular order Image © Mordor Intelligence. Reuse requires attribution under CC BY 4.0. | |
Dark Fiber Pricing Benchmarking Market Analysis by Mordor Intelligence
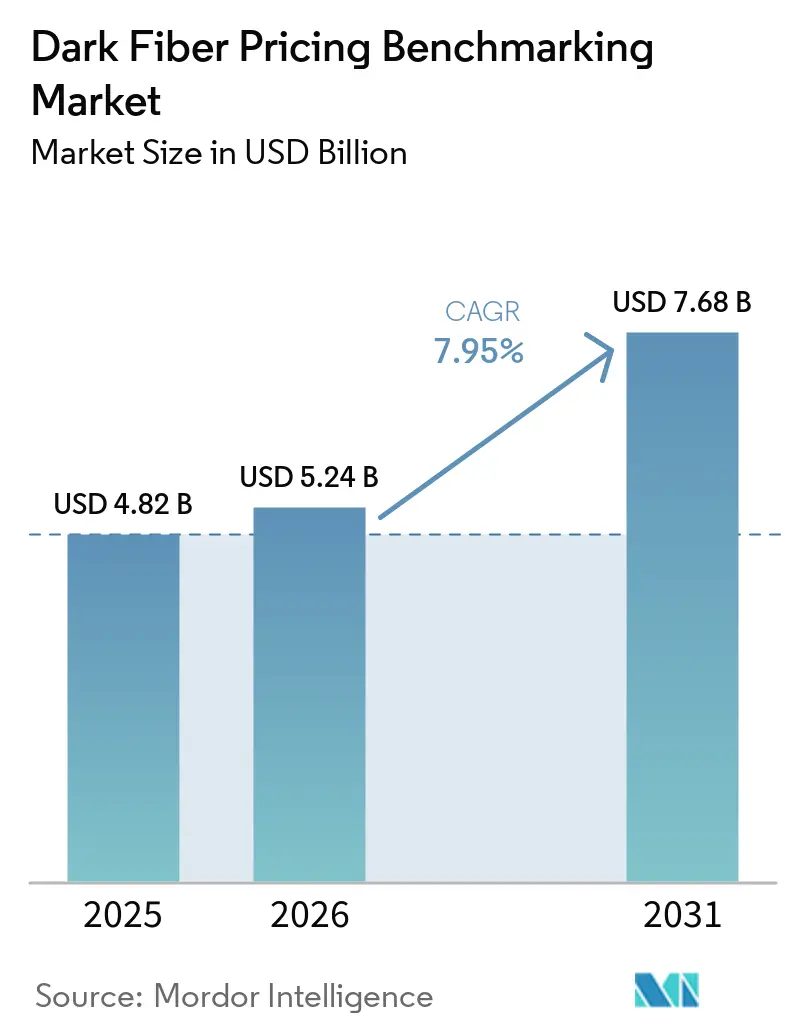
The dark fiber pricing benchmarking market size was valued at USD 4.82 billion in 2025 and is estimated to grow from USD 5.24 billion in 2026 to reach USD 7.68 billion by 2031, at a CAGR of 7.95% during the forecast period (2026-2031). Buyers are reserving long-duration capacity before route construction begins, moving price discovery away from standard per-strand-mile rate cards. AI data center demand, 5G densification, and sovereign cloud requirements are raising the value of routes with specific performance, location, and resilience characteristics. Negotiated IRU terms can differ sharply by route, fiber quality, maintenance obligations, and delivery timing. Providers are using acquisitions, route extensions, and purpose-built capacity to serve large customers with more control over network paths. Reliable benchmarks need to distinguish between urban, long-haul, submarine, and regulated routes rather than treating all fiber capacity as interchangeable.
Key Report Takeaways
- By network type, Metro Networks held 56.24% of the dark fiber pricing benchmarking market share in 2025, while Submarine Networks are projected to expand at a 8.38% CAGR through 2031.
- By pricing model, Indefeasible Right of Use held 43.82% of the dark fiber pricing benchmarking market share in 2025, while Hybrid Lease-to-IRU and Capacity Buy-Down structures are projected to expand at a 8.64% CAGR through 2031.
- By application, Data Center Interconnect accounted for 31.76% of the dark fiber pricing benchmarking market size in 2025, while 5G Fronthaul, Midhaul, and Backhaul are projected to expand at a 9.12% CAGR through 2031.
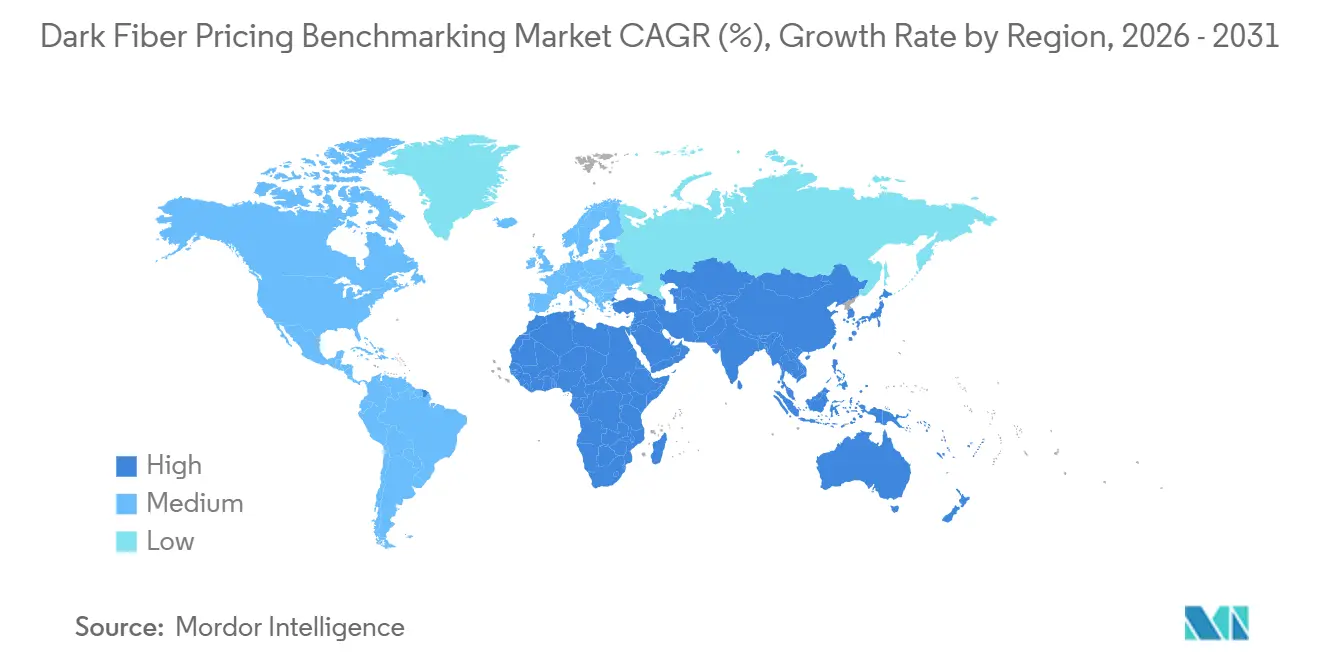
- By geography, North America held 35.84% of the dark fiber pricing benchmarking market share in 2025, while Asia-Pacific is projected to expand at a 8.82% CAGR through 2031.
Note: Market size and forecast figures in this report are generated using Mordor Intelligence’s proprietary estimation framework, updated with the latest available data and insights as of January 2026.
Market Trends and Insights
Drivers Impact Analysis of Dark Fiber Pricing Benchmarking Market*
| Driver | (~) % Impact on CAGR Forecast | Geographic Relevance | Impact Timeline |
|---|---|---|---|
| AI Data Center Interconnect Bandwidth Expansion | +2.5% | Global, concentrated in North America and Asia-Pacific core markets | Short term (≤ 2 years) |
| 5G Fronthaul, Midhaul and Backhaul Densification | +1.8% | Asia-Pacific core markets, with spillover to the Middle East and Africa | Medium term (2-4 years) |
| Hyperscaler Shift Toward Owned Optical Capacity | +1.5% | North America and Europe, expanding to Asia-Pacific | Short term (≤ 2 years) |
| Sovereign Cloud and Data Localization Routing Requirements | +0.8% | Europe, the Middle East, and Asia-Pacific regulatory hubs | Medium term (2-4 years) |
| Public Broadband and Open-Access Fiber Programs | +0.6% | North America, Europe, and national markets in Asia-Pacific and Africa | Long term (≥ 4 years) |
| Multi-Terabit Optical Economics Favoring Dark Fiber | +0.5% | Global | Medium term (2-4 years) |
| Source: Mordor Intelligence | |||
AI Data Center Interconnect Bandwidth Expansion
Hyperscale AI infrastructure is raising demand for dark fiber across long-haul and metro routes. Zayo reported that long-haul dark fiber demand doubled between 2024 and 2025, while metro demand grew at a 12% CAGR from 2021 to 2025. Buyers are procuring 12 to 48 fiber pairs on some routes, rather than the 4-pair pattern used previously, to preserve redundancy for distributed training activities. Cisco and ACG Research found that dark fiber can reduce the total cost of ownership by 48% versus Carrier Ethernet at 400G and by 55% versus wavelength services in metro data center interconnect use.[1] This demand is changing price discovery because contracts in dense AI corridors are increasingly set through bilateral negotiations. It also increases the value of routes that connect multiple data center campuses or provide physically separate restoration paths. Providers that can document route diversity and delivery certainty have a clearer basis for differentiating their offerings. Palo Alto's published July 2025 tariff of USD 476.46 per fiber mile per month remains a public reference, but it does not capture the scarcity conditions on constrained commercial routes.
5G Fronthaul, Midhaul and Backhaul Densification
Dense 5G deployments are increasing the need for direct fiber paths between radio and network functions. eCPRI fronthaul requires sub-100-microsecond one-way latency, which can limit the usable fiber path to 20 km. China had installed more than 4 million 5G cells by early 2025, creating a large requirement for additional fronthaul links. Mobile operators commonly align 5- to 10-year fronthaul leases with radio upgrade cycles. Hyperscalers and large enterprises more often use 20-year IRUs, so the two contract types should not be compared through a single per-strand-mile benchmark. Work on radio-over-fiber and multicore fronthaul systems is also raising the importance of fiber specifications, which can create a premium over standard commercial strands.
Hyperscaler Shift Toward Owned Optical Capacity
Cloud and content providers are moving from managed bandwidth toward direct control of optical capacity. This shift transfers more pricing activity into private IRU negotiations and reduces the visibility of transactions that would otherwise support public rate cards. In 2025, Uniti stated that its hyperscaler contracts use prepaid 20-year IRUs, including a USD 100 million contract that demonstrates the scale of these arrangements. A buyer that operates its own optical equipment can expand capacity on an existing fiber pair without purchasing a new managed service. That flexibility can make owned capacity more attractive when data center traffic rises quickly. It also means published benchmarks may increasingly describe secondary demand rather than the terms paid by the largest buyers.
Sovereign Cloud and Data Localization Routing Requirements
Data localization requirements are making the physical route of a connection more important for some buyers. Equinix launched Fabric Geo Zones in May 2026 to help enterprises keep data within selected geographic boundaries during rerouting across hybrid multicloud environments. Google Cloud described Deutsche Telekom's sovereign data platform as an architecture that combines external key management with geographically bounded operations for regulated workloads. Dark fiber can give buyers greater control over the transmission path than a carrier-managed service. This is relevant where automatic cross-border rerouting or shared infrastructure could conflict with internal compliance policies. It can create a separate premium for routes with defined routing and jurisdiction conditions.
Restraints Impact Analysis of Dark Fiber Pricing Benchmarking Market*
| Restraint | (~) % Impact on CAGR Forecast | Geographic Relevance | Impact Timeline |
|---|---|---|---|
| High Upfront CapEx and Optical Engineering Complexity | -1.2% | Global, most acute in Asia-Pacific and South America | Long term (≥ 4 years) |
| Right-of-Way, Permitting and Make-Ready Delays | -0.9% | North America, Europe, and national markets in South America | Medium term (2-4 years) |
| Scarcity of Diverse Routes and Specialty Fiber Components | -0.7% | Global | Short term (≤ 2 years) |
| Substitution by Competitive Wavelength Services on Underutilized Routes | -0.5% | Global, most acute on lower-demand intercity routes | Medium term (2-4 years) |
| Source: Mordor Intelligence | |||
High Upfront CapEx and Optical Engineering Complexity
Dark fiber projects require upfront spending on civil work, conduit, cable, and make-ready activity before service can begin. Urban underground routes can cost more than USD 10 million per route mile, limiting participation by smaller buyers. Buyers of IRUs also need to account for ongoing operations and maintenance charges after the initial payment. The resulting commitment favors well-capitalized carriers, hyperscalers, and infrastructure funds. Smaller enterprises may use leased capacity rather than enter the primary IRU market. This creates separate customer tiers and reduces comparable transaction data across the dark fiber pricing benchmarking market.
Right-of-Way, Permitting, and Make-Ready Delays
Dark fiber deployment can involve approvals from county road agencies, state departments of transportation, waterway authorities, and rail operators. USTelecom told the FCC that some North Carolina municipalities exceeded the state's 30-day review limit by 2 to 3 months, while some jurisdictions did not meet statutory 60-day timelines. The FCC circulated a June 2026 proposal under WC Docket No. 25-253 that includes national shot-clock standards, cost-based fee caps, and deemed-granted outcomes for delayed decisions. Delayed approvals extend construction schedules and make new-build capacity less comparable with capacity on established routes. They also increase uncertainty in route-specific IRU pricing. Standardized permitting could improve delivery timing and support more consistent benchmark comparisons.
*Our forecasts treat driver/restraint impacts as directional, not additive. The impact forecasts reflect baseline growth, mix effects, and variable interactions.
Dark Fiber Pricing Benchmarking Market Segment Analysis
By Network Type:
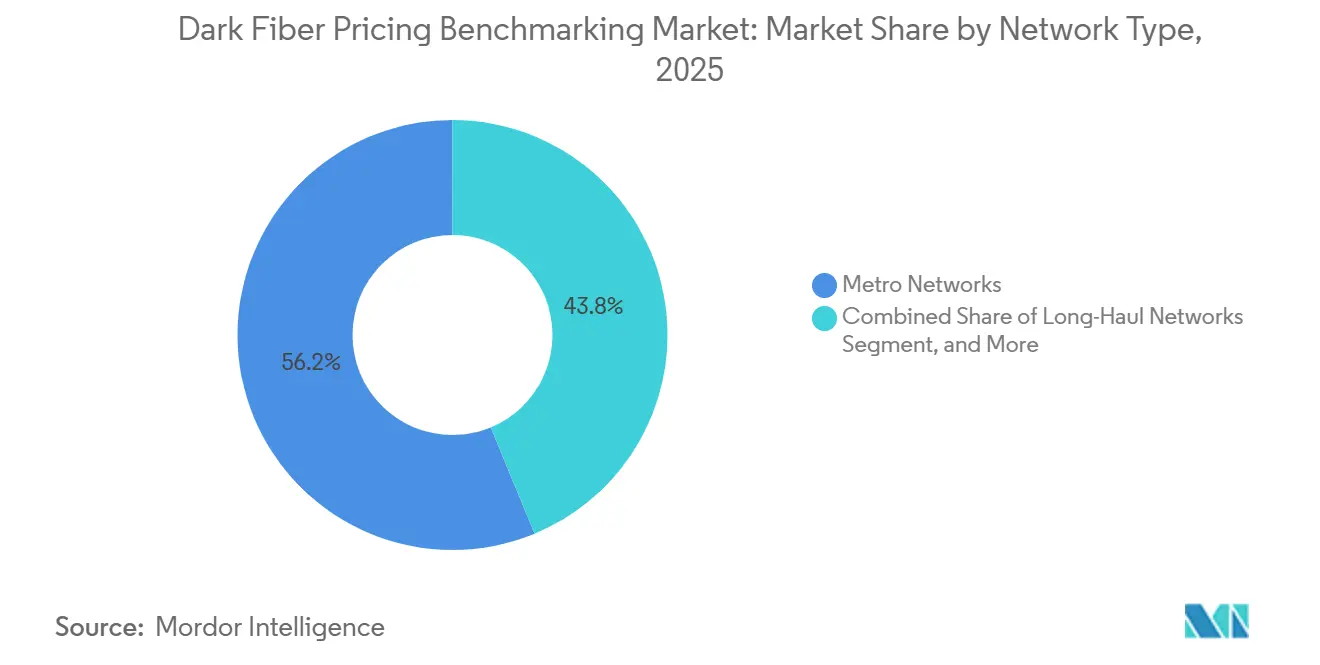
Metro Routes Face AI-Driven Capacity TighteningMetro Networks held 56.24% market share in the dark fiber pricing benchmarking market in 2025. Zayo identified New York, Chicago, and Dallas as AI-driven metros where data center density, cloud connectivity, and AI workloads are lifting demand. These corridors need route diversity, rapid provisioning, and reliable access to major facilities. Public tariffs offer a local reference, although commercial contracts can command higher values where alternatives are scarce. Palo Alto's July 2025 schedule listed USD 476.46 per fiber mile per month.
Long-Haul Networks serve intercity and national backbone requirements, with pricing influenced by exclusivity, fiber specification, and access rather than distance alone. Backhaul and Fronthaul Networks can command premiums because eCPRI latency requirements limit the use of indirect shared paths. Submarine Networks are projected to expand at an 8.38% CAGR through 2031. NTT reported in March 2026 that its 192-core submarine system is designed to achieve 4 times the transmission capacity without replacing existing cable infrastructure.[2] Practical deployment is targeted around 2029 and could change cost-per-terabit comparisons on high-volume transoceanic routes.

By Pricing Model:
IRUs Retain Leadership While Flexible Conversion Gains UseIRU held 43.82% market share in the dark fiber pricing benchmarking market in 2025. The model gives large buyers long-term control and more cost certainty over a 20-year horizon. Illinois Century Network lists a price of USD 900 per strand-mile for a 20-year IRU. Buyers can light and scale the fiber with their own equipment as traffic needs change. Accounting under ASC 842 and IFRS 16 can also influence the choice between a long-term lease and an IRU.
Hybrid Lease-to-IRU and Capacity Buy-Down structures are projected to grow at an 8.64% CAGR through 2031. They give mid-sized enterprises and newer AI infrastructure operators access to capacity while allowing capital spending to be staged. Monthly operating leases remain relevant for enterprise networks and regional carriers with shorter planning horizons. Build-to-Suit and Dedicated Construction contracts are used where route inventory is unavailable. Uniti announced a USD 100 million, 20-year hyperscaler IRU for 130 route miles in January 2025.
By Application:
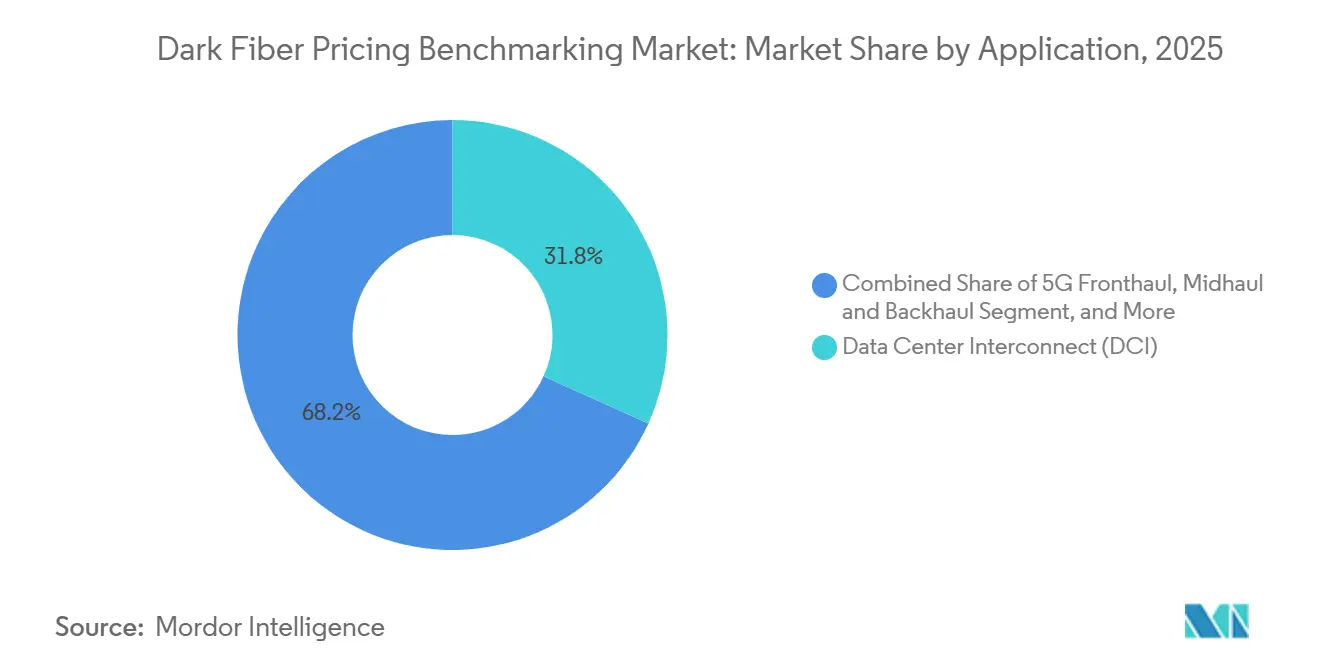
Data Center Interconnect Leads as 5G Raises Fronthaul RequirementsData Center Interconnect accounted for 31.76% of the dark fiber pricing benchmarking market size in 2025. It supports high-bandwidth data center links where buyers value predictable latency and capacity control. Cisco and ACG Research found that dark fiber can lower the total cost of ownership compared with Carrier Ethernet and wavelength services for 400G metro DCI use. Enterprise networks, cloud delivery, smart city programs, industrial automation, and IoT deployments account for the remaining use cases.
Military, emergency, and mission-critical communications can command premiums for commitments to security, diversity, and availability. 5G Fronthaul, Midhaul and Backhaul is projected to grow at a 9.12% CAGR through 2031. Operators need direct, geographically precise links that meet strict latency requirements in dense deployments. Their contracts can be shorter and use fewer fiber pairs than long-haul IRUs. Mobile fronthaul, therefore, requires separate benchmarks instead of a single global price index. Application-specific benchmarking can better reflect contract duration, service requirements, and fiber quality.
Geography Analysis
North America Dark Fiber Pricing Benchmarking Market
North America held 35.84% of the dark fiber pricing benchmarking market share in 2025. Zayo completed its USD 4.25 billion acquisition of Crown Castle's Fiber Solutions business in 2026, adding 90,000 metro route miles and 40,000 on-net enterprise locations to a combined network of 224,000 route miles. Lumen stated in February 2026 that it had deployed 17 million intercity fiber miles by the end of 2025 and plans to reach 58 million miles by 2031.[3] The USD 42.45 billion BEAD program supports open-access infrastructure in underserved U.S. corridors. California's USD 1.86 billion final proposal received approval in July 2026, with construction expected in the second half of 2026.
Europe Dark Fiber Pricing Benchmarking Market
Europe differentiates through route diversity, fiber specifications, and sovereign-compliant routing. EXA completed its Aqua Comms acquisition in January 2026, creating a wholly owned route from North America through Ireland and the United Kingdom into mainland Europe. Project Visegrád adds Central European links to the Berlin, Frankfurt, and Vienna backbone. Spain's CNMC published wholesale dark-fiber reference prices in February 2025, and Arelion's Baltic Ring has CEF2 support.
APAC, MEA and South America Dark Fiber Pricing Benchmarking Market
Asia-Pacific is projected to grow at an 8.82% CAGR through 2031, the fastest regional rate in the dark fiber pricing benchmarking market. Its growth is supported by 5G densification, data center construction, and submarine capacity expansion. NTT DATA and its partners formed Intra-Asia Marine Networks in January 2026 to construct the I-AM Cable. The system is designed for 320 terabits per second across 8,100 km and is planned to enter service in early fiscal year 2029. Africa and South America are attracting investment, while the Middle East is developing as a sovereign cloud routing location with less transparent contract terms.
Competitive Landscape
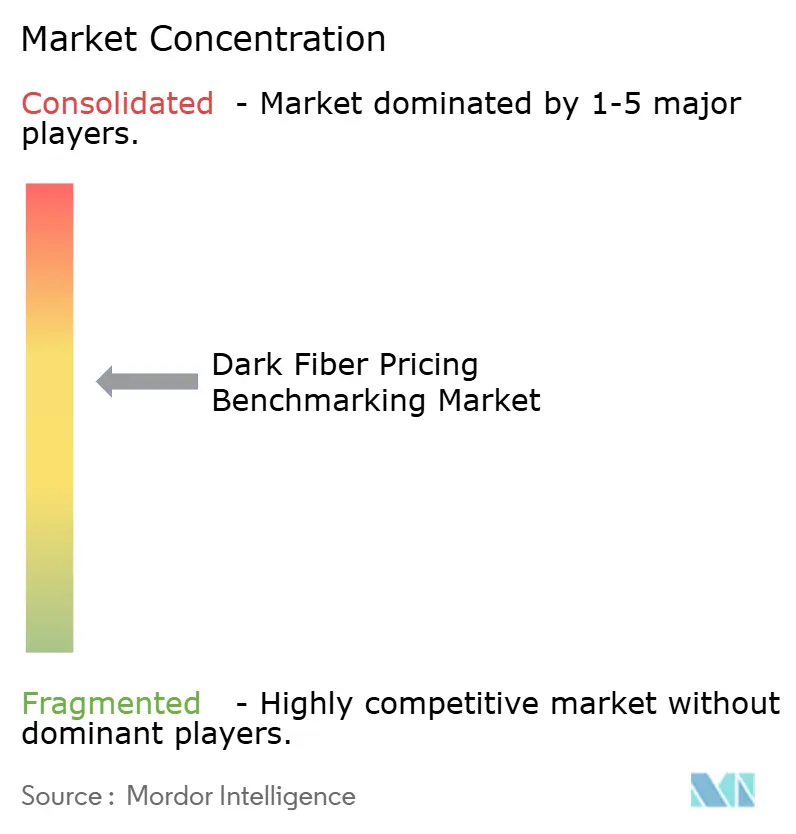
The dark fiber pricing benchmarking market is moderately concentrated across global backbone routes but remains fragmented across regional and national networks. Zayo, Lumen Technologies, Verizon Communications Inc., and AT&T Inc. hold important long-haul and transatlantic inventory that influences pricing for large customers. GTT completed a global 400G upgrade in 2025 and said the network can support customer scaling to 800G.[4] Network coverage, operational support, and AI-ready optical capacity are increasingly important competitive factors.
EXA is expanding its G.652D overbuild program across Europe and targets more than 2 million km of new optical fiber. Zayo announced an August 2026 collaboration with NVIDIA to build more than 8,000 miles of long-haul fiber across AI corridors. Lumen is building purpose-built connectivity for large customers, including Anthropic. EXA is combining acquisitions with cross-border route construction to strengthen European and transatlantic coverage. FCC cable-landing processes can affect submarine providers' ability to develop and operate international systems.
Regional providers can compete through dense local networks and data center connectivity, where national backbone owners have less presence. GlobalConnect, Neos Networks, and Lyntia Networks are extending regional routes and local interconnection. euNetworks deployed its longest hollow-core fiber system for Euronext in January 2025, creating an ultra-low-latency option for financial traffic. Hollow-core fiber, multicore submarine systems, and coherent pluggables may form specialized pricing tiers when standard fiber performance is insufficient.
Dark Fiber Pricing Benchmarking Industry Leaders
-
Zayo Group, LLC
-
Lumen Technologies, Inc.
-
Verizon Communications Inc.
-
AT&T Inc.
-
Colt Technology Services Group Limited
- *Disclaimer: Major Players sorted in no particular order
Dark Fiber Pricing Benchmarking Market Companies Covered in this Report
- Zayo Group, LLC
- Lumen Technologies, Inc.
- Verizon Communications Inc.
- AT&T Inc.
- Colt Technology Services Group Limited
- euNetworks Group Limited
- EXA Infrastructure Limited
- Eurofiber Nederland B.V.
- GTT Communications, Inc.
- FiberLight, LLC
- FirstLight Fiber, Inc.
- Uniti Group Inc.
- CityFibre Infrastructure Holdings plc
- Neos Networks Limited
- GlobalConnect A/S
- Lyntia Networks, S.A.
- Dark Fibre Africa (Pty) Ltd
- NTT Communications Corporation
- Arelion Sweden AB
- Consolidated Communications, Inc.
- Comcast Corporation
- Fatbeam, LLC
Recent Industry Developments in Dark Fiber Pricing Benchmarking Market
- August 2026: Zayo announced a collaboration with NVIDIA to build more than 8,000 miles of new long-haul fiber across the fastest-growing AI corridors, covering 6 net-new long-haul routes and overbuilds across 10 high-demand markets. The announcement followed Zayo's completion of its USD 4.25 billion acquisition of Crown Castle's Fiber Solutions business, which added 90,000 metro route miles and created a combined North American network of 224,000 route miles serving more than 400 markets globally.
- July 2026: California's BEAD Final Proposal received NTIA approval, unlocking a USD 1.86 billion broadband infrastructure allocation as part of the USD 42.45 billion national BEAD program, with construction activity expected to commence in the second half of 2026.
- May 2026: Equinix launched Fabric Geo Zones globally, described as the first network-level data sovereignty enforcement layer operating across interconnected clouds and providers. The product keeps data within defined geographic boundaries automatically during rerouting events, targeting compliance with GDPR, DORA, LGPD, and APRA requirements.
- February 2026: Lumen Technologies confirmed at its 2026 Investor Day that the company had deployed 17 million intercity fiber miles by the end of 2025, with a target of 58 million miles by 2031 supported by USD 2.5 billion in recent new private connectivity fiber agreements and USD 13 billion in total agreements to date, including a purpose-built network for Anthropic.
Global Dark Fiber Pricing Benchmarking Market Report Scope
The dark fiber pricing benchmarking market involves analyzing and comparing pricing models, lease rates, contract terms, route availability, and capacity options for unused optical fiber infrastructure. It also evaluates factors influencing pricing, such as network density, route length, fiber-pair availability, bandwidth requirements, and service-level agreements.
The Dark Fiber Pricing Benchmarking Market Report is Segmented by Network Type (Metro Networks, Long-Haul Networks, Submarine Networks, and Backhaul and Fronthaul Networks), Pricing Model (Monthly Operating Lease, Indefeasible Right of Use, Build-to-Suit and Dedicated Construction, and Hybrid Lease-to-IRU and Capacity Buy-Down), Application (Data Center Interconnect, 5G Fronthaul, Midhaul and Backhaul, Enterprise Wide-Area Networking, Cloud and Content Delivery, Industrial Automation and IoT, Military, Emergency and Mission-Critical Communications, and Smart City and Public Broadband), and Geography (North America, South America, Europe, Asia-Pacific, Middle East, and Africa). The Market Forecasts are Provided in Terms of Value (USD).
Segmentation Overview
| Metro Networks |
| Long-Haul Networks |
| Submarine Networks |
| Backhaul and Fronthaul Networks |
| Monthly Operating Lease |
| Indefeasible Right of Use |
| Build-to-Suit and Dedicated Construction |
| Hybrid Lease-to-IRU and Capacity Buy-Down |
| Data Center Interconnect |
| 5G Fronthaul, Midhaul and Backhaul |
| Enterprise Wide-Area Networking |
| Cloud and Content Delivery |
| Industrial Automation and IoT |
| Military, Emergency and Mission-Critical Communications |
| Smart City and Public Broadband |
| North America | United States |
| Canada | |
| Mexico | |
| South America | Brazil |
| Argentina | |
| Colombia | |
| Rest of South America | |
| Europe | United Kingdom |
| Germany | |
| France | |
| Italy | |
| Spain | |
| Russia | |
| Rest of Europe | |
| Asia-Pacific | China |
| Japan | |
| India | |
| South Korea | |
| Australia | |
| Singapore | |
| Rest of Asia-Pacific | |
| Middle East | Saudi Arabia |
| United Arab Emirates | |
| Turkey | |
| Rest of Middle East | |
| Africa | South Africa |
| Egypt | |
| Rest of Africa |
| By Network Type | Metro Networks | |
| Long-Haul Networks | ||
| Submarine Networks | ||
| Backhaul and Fronthaul Networks | ||
| By Pricing Model | Monthly Operating Lease | |
| Indefeasible Right of Use | ||
| Build-to-Suit and Dedicated Construction | ||
| Hybrid Lease-to-IRU and Capacity Buy-Down | ||
| By Application | Data Center Interconnect | |
| 5G Fronthaul, Midhaul and Backhaul | ||
| Enterprise Wide-Area Networking | ||
| Cloud and Content Delivery | ||
| Industrial Automation and IoT | ||
| Military, Emergency and Mission-Critical Communications | ||
| Smart City and Public Broadband | ||
| By Geography | North America | United States |
| Canada | ||
| Mexico | ||
| South America | Brazil | |
| Argentina | ||
| Colombia | ||
| Rest of South America | ||
| Europe | United Kingdom | |
| Germany | ||
| France | ||
| Italy | ||
| Spain | ||
| Russia | ||
| Rest of Europe | ||
| Asia-Pacific | China | |
| Japan | ||
| India | ||
| South Korea | ||
| Australia | ||
| Singapore | ||
| Rest of Asia-Pacific | ||
| Middle East | Saudi Arabia | |
| United Arab Emirates | ||
| Turkey | ||
| Rest of Middle East | ||
| Africa | South Africa | |
| Egypt | ||
| Rest of Africa | ||
Key Questions Answered in the Report
What is the size of the dark fiber pricing benchmarking market?
The dark fiber pricing benchmarking market size is estimated at USD 5.24 billion in 2026 and is forecast to reach USD 7.68 billion by 2031 at a 7.95% CAGR.
Which network type held the largest share in 2025?
Metro Networks held 56.24% in 2025, supported by demand from high-density urban data center corridors.
Which pricing model led dark fiber contracts in 2025?
Indefeasible Right of Use held 43.82% of 2025 revenue because it provides long-term capacity control and cost certainty.
What application is expected to grow the fastest through 2031?
5G Fronthaul, Midhaul and Backhaul is projected to grow at a 9.12% CAGR through 2031.
Which region is projected to grow the fastest through 2031?
Asia-Pacific is projected to expand at an 8.82% CAGR, supported by 5G, data center, and submarine cable investment.
Why are route-specific benchmarks becoming more important?
AI workloads, direct fronthaul paths, and data localization needs can make contract terms differ substantially by route and fiber specification.