
Strategic Subsea Cable Corridors Market Size and Share
Market Overview
| Study Period | 2020 - 2031 |
|---|---|
| Market Size (2026) | USD 23.94 Billion |
| Market Size (2031) | USD 36.47 Billion |
| Growth Rate (2026 - 2031) | 8.78 % |
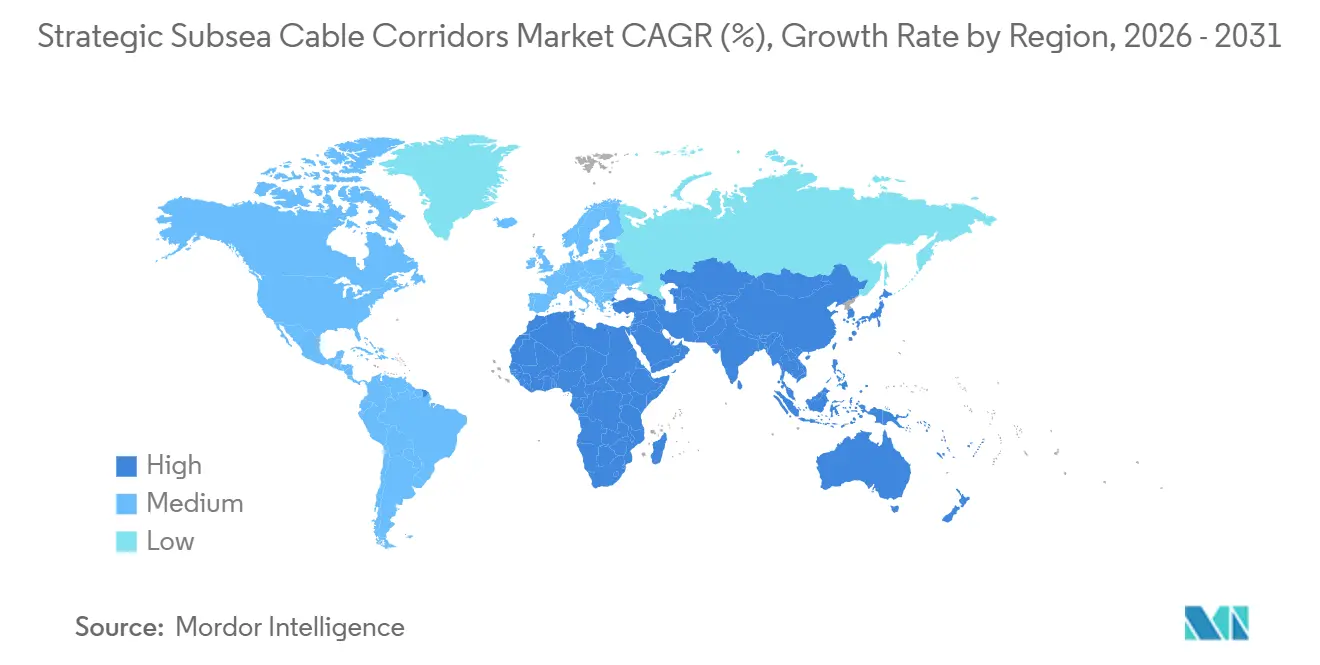
| Fastest Growing Market | Asia-Pacific |
| Largest Market | North America |
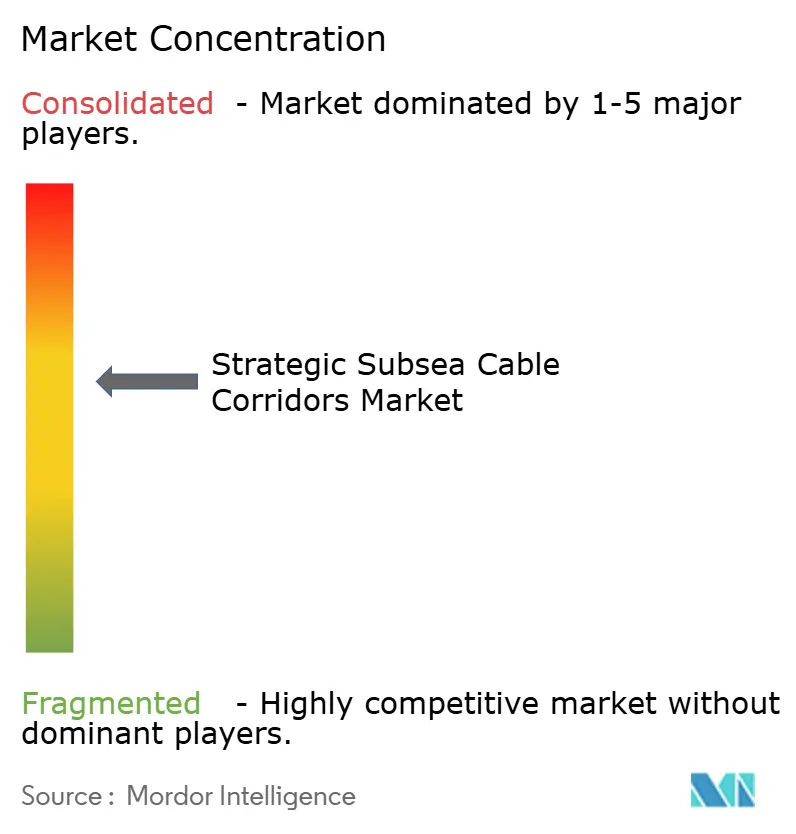
| Market Concentration | Medium |
Major Players *Disclaimer: Major Players sorted in no particular order Image © Mordor Intelligence. Reuse requires attribution under CC BY 4.0. | |
Strategic Subsea Cable Corridors Market Analysis by Mordor Intelligence
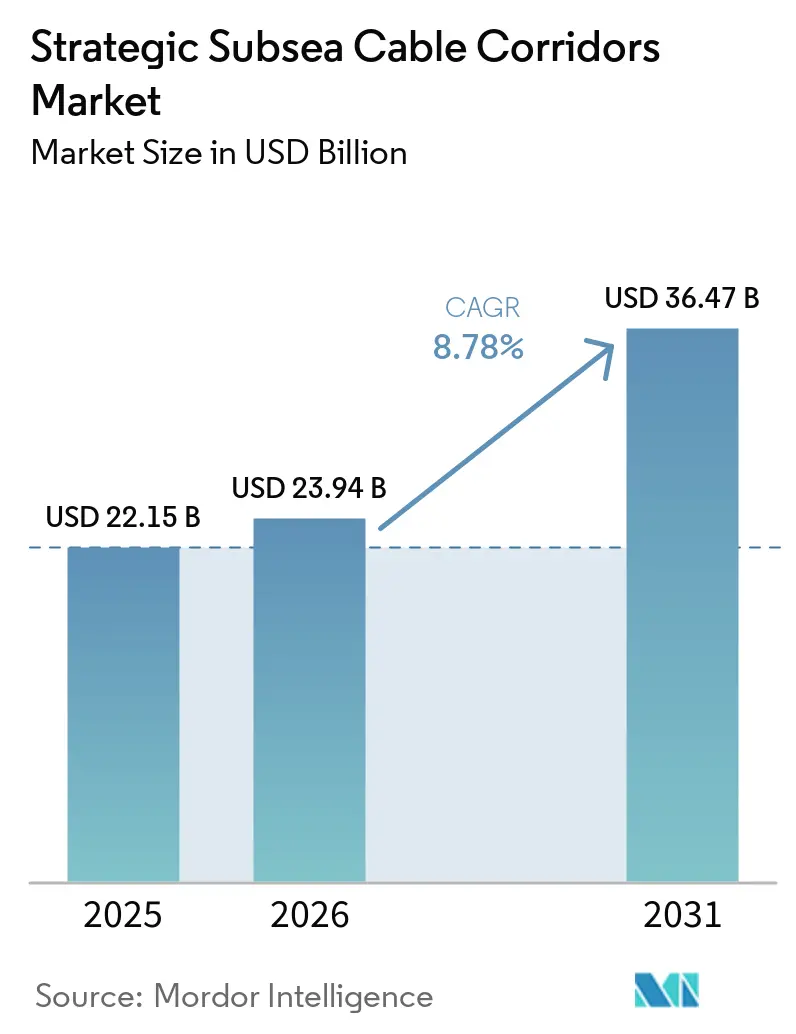
The strategic subsea cable corridors market size was valued at USD 22.15 billion in 2025 and estimated to grow from USD 23.94 billion in 2026 to reach USD 36.47 billion by 2031, at a CAGR of 8.78% during the forecast period (2026-2031). The strategic subsea cable corridors market is being shaped by a large reinvestment cycle in long-distance digital infrastructure. More than 570 active submarine systems carry most intercontinental internet traffic, while cloud services and artificial intelligence workloads are increasing the need for resilient capacity. Private investment is shifting toward routes that connect major cloud regions directly and reduce reliance on traditional transit hubs. Governments are also providing funding, route guidance, and resilience programs for corridors that have strategic value but limited stand-alone commercial returns. These patterns widen opportunities for system suppliers, installation providers, route engineers, and operators with access to landing infrastructure.
Key Report Takeaways
- By service offering, Installation and Commissioning Services held 48.65% of the strategic subsea cable corridors market share in 2025, while System Upgrade Services are projected to expand at a 9.36% CAGR through 2031.
- By ownership model, Consortium and Multiple-Ownership Systems held 54.12% share in 2025, while Single-Ownership and Private Systems are projected to expand at a 10.32% CAGR through 2031.
- By fiber-pair capacity, 8-16 Fiber Pair systems held 44.92% share in 2025, while systems with 25 or more fiber pairs are projected to expand at a 9.78% CAGR through 2031.
- By corridor type, Transpacific Corridors held 24.61% share in 2025, while Europe-Africa Corridors are projected to expand at a 10.61% CAGR through 2031.
- By geography, North America held 32.58% share in 2025, while Asia-Pacific is projected to expand at a 10.63% CAGR through 2031.
Note: Market size and forecast figures in this report are generated using Mordor Intelligence’s proprietary estimation framework, updated with the latest available data and insights as of January 2026.
Market Trends and Insights
Drivers Impact Analysis of Strategic Subsea Cable Corridors Market*
| Driver | (~) % Impact on CAGR Forecast | Geographic Relevance | Impact Timeline |
|---|---|---|---|
| 5G, Cloud, AI, and Data Center Bandwidth Expansion | +3.2% | Global | Short term (≤ 2 years) |
| Hyperscaler-Owned and Consortium-Funded Transoceanic Routes | +2.5% | Global, concentrated in North America, Asia-Pacific, and Europe | Medium term (2-4 years) |
| Government-Led Digital Sovereignty and Cable Resilience Programs | +1.3% | Europe, Asia-Pacific, and Africa | Medium term (2-4 years) |
| Offshore Wind and Cross-Border Grid Interconnection Build-Out | +1.0% | Europe, including the North Sea and Mediterranean, and Asia-Pacific | Medium term (2-4 years) |
| Strategic Route Diversification Around Chokepoints | +0.7% | Middle East and Southeast Asia | Short term (≤ 2 years) |
| Reuse of Retired Cables for Island and Emerging-Market Redundancy | +0.3% | Pacific Island Corridors, Africa, and the Caribbean | Long term (≥ 4 years) |
| Source: Mordor Intelligence | |||
5G, Cloud, AI, and Data Center Bandwidth Expansion
Cloud services and artificial intelligence applications are raising the required capacity and flexibility of the strategic subsea cable corridors market. The IEEE Communications Society reported that more than 11,000 data centers, including over 1,000 hyperscale facilities, generate substantial wide-area traffic and increase demand for fiber connectivity between regions.[1] Distributed artificial intelligence inference can create irregular traffic patterns outside established high-volume routes. That condition favors route diversity and systems that can support future capacity upgrades. The JUNO trans-Pacific cable reached Point-of-Presence Ready-for-Service status in May 2025 with 20 fiber pairs and a 360 Tbps design capacity. A November 2025 trial on the same system demonstrated 20 Tbps transmission over 10,000 km, showing how new system designs can support high-throughput intercontinental workloads
Hyperscaler-Owned and Consortium-Funded Transoceanic Routes
Hyperscalers are increasingly planning and funding their own routes instead of acting only as bandwidth buyers in the strategic subsea cable corridors market. The IEEE Communications Society stated that hyperscalers controlled 71% of international subsea capacity in 2026, compared with 10% a decade earlier. This model supports long-term procurement for repeaters, wet-plant components, and submarine line terminal equipment. Keppel secured the final fiber-pair commitment on the Bifrost cable system in July 2026, bringing total contract value to USD 1.3 billion. The system provides a direct Singapore-to-U.S. West Coast connection through Indonesia and has capacity above 240 Tbps. As private fiber-pair rights become more concentrated, carriers can remain relevant through landing-station access, national permits, and local operating relationships.
Government-Led Digital Sovereignty and Cable Resilience Programs
Public programs are making more routes financeable within the strategic subsea cable corridors market. The European Commission allocated EUR 347 million (USD 382 million) for strategic cable projects, repair modules, and sensor equipment under the Connecting Europe Facility Digital program. The Commission stated that total related commitments under the current Multiannual Financial Framework were nearly EUR 1 billion (USD 1.1 billion). Japan's Ministry of Internal Affairs and Communications is supporting branch lines and branching devices on international cables to reinforce Japan's role as a data distribution hub. Australia's Cable Connectivity and Resilience Center provides technical support and training to Indo-Pacific partner governments. These measures can improve the economics of Pacific Island, East African, North African, and Mediterranean landings that otherwise face limited private demand.
Offshore Wind and Cross-Border Grid Interconnection Build-Out
Offshore power projects compete with telecom systems for seabed access, vessels, and manufacturing capacity across the strategic subsea cable corridors market. TGS reported that the installed offshore wind cable length reached 55,500 km in 2025 and projected an additional 117,640 km of cable demand from 2026 through 2040. NKT signed a EUR 2.2 billion (USD 2.42 billion) contract for the 580 km Eastern Green Link 3 connection between Scotland and England in January 2026. Germany and Denmark agreed in January 2026 to jointly develop the Bornholm Energy Island project, which includes 3 GW of offshore wind and requires submarine interconnectors. Suppliers that manufacture both telecom and power cables can balance capacity across adjacent projects. The overlap also raises the value of vessel planning and procurement discipline for large infrastructure programs.
Restraints Impact Analysis of Strategic Subsea Cable Corridors Market*
| Restraint | (~) % Impact on CAGR Forecast | Geographic Relevance | Impact Timeline |
|---|---|---|---|
| Specialized Cable Ship and Repair Vessel Constraints | -1.5% | Global | Short term (≤ 2 years) |
| Geopolitical Vendor Restrictions and Security Screening | -0.9% | North America, Europe, and Asia-Pacific | Medium term (2-4 years) |
| Route Permitting Across Multiple Exclusive Economic Zones | -0.5% | Asia-Pacific, Middle East, and Africa | Medium term (2-4 years) |
| Concentrated Supply of Repeaters, High-Voltage Conductors, and Wet-Plant Components | -0.4% | Global, most acute in SDM deployments | Long term (≥ 4 years) |
| Source: Mordor Intelligence | |||
Specialized Cable Ship and Repair Vessel Constraints
The limited availability of cable-laying and repair vessels is a material constraint on the delivery of strategic subsea cable corridors. The International Telecommunication Union reported in July 2026 that restoration timelines were lengthening in several regions due to constrained vessel availability, permitting, and mobilization lead times. The report cited a 3-5 day mobilization lead time for a repair event. Power-cable projects and telecom routes draw on overlapping specialist vessel capacity. New vessel construction requires long lead times, which limit the fleet's ability to respond quickly to more awards. Operators that secure vessel access early are better placed to provide dependable installation schedules and repair support.
Geopolitical Vendor Restrictions and Security Screening
Security requirements are extending project preparation and changing supplier choices in the strategic subsea cable corridors market. The U.S. Federal Communications Commission issued rules in July 2026 that require certain entities with disqualifying ownership structures to seek individual licenses rather than rely on blanket authorization. The rules also address foreign adversary-controlled equipment and ownership in systems landing in the United States. The European Commission has set out a Cable Security Toolbox with risk-assessment and stress-testing obligations for cable systems landing in member states. These requirements can limit the pool of eligible vendors for systems connected to the United States or Europe. Consortium members must now consider licensing, vendor provenance, and ownership structure earlier in the route planning process.
*Our forecasts treat driver/restraint impacts as directional, not additive. The impact forecasts reflect baseline growth, mix effects, and variable interactions.
Strategic Subsea Cable Corridors Market Segment Analysis
By Service Offering:
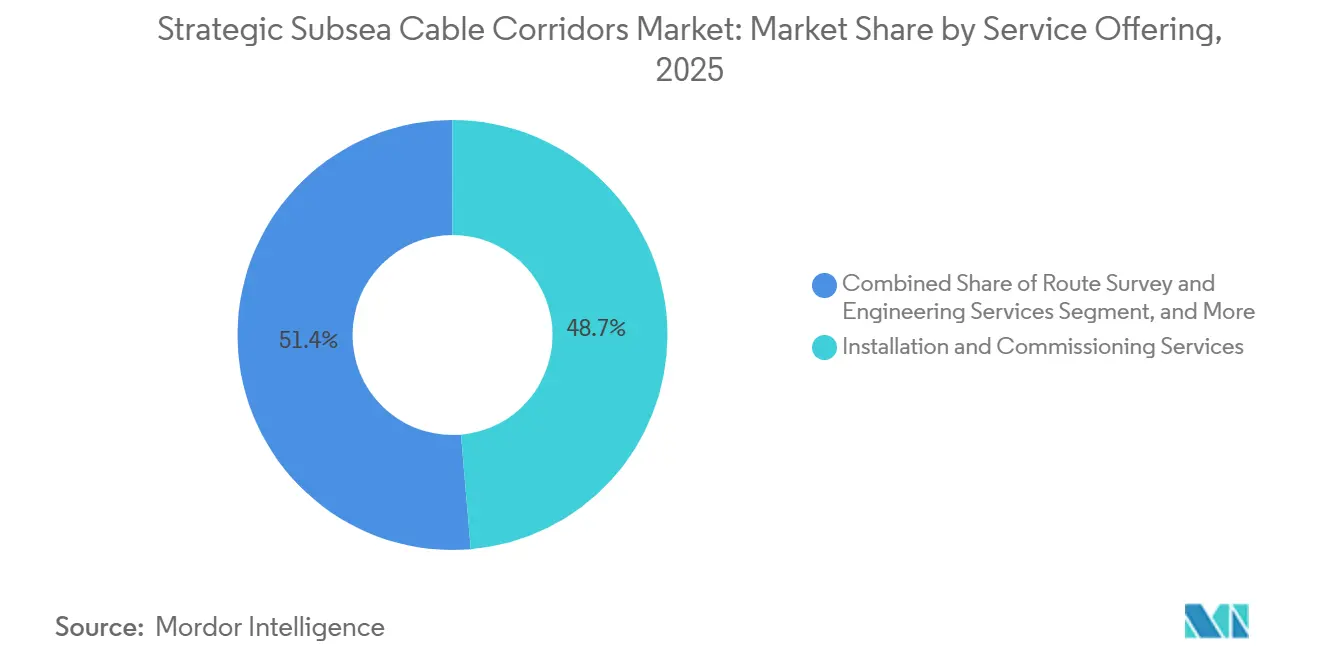
Installation Leads While Upgrades Add Long-Term ValueInstallation and Commissioning Services commanded 48.65% of the strategic subsea cable corridors market share in 2025. This service line is the entry point for new systems, as every route requires engineering, wet-plant integration, installation, and final testing. Greenfield awards, therefore, support installation activity across major transoceanic corridors. System Upgrade Services are projected to advance at a 9.36% CAGR through 2031. Upgrades to shore-end terminal equipment and optical systems can expand capacity without requiring a new seabed installation window. This gives operators a way to respond to demand when specialist vessel schedules are constrained.
The strategic subsea cable corridors market size for installed systems also supports recurring upgrade work over the life of each route. Open cable designs allow suppliers to improve optical performance on systems they did not originally install. That creates an opening for providers of programmable terminal equipment and related software. Maintenance and Repair Services provide recurring demand because active systems require fault localization, mobilization, and repairs. Route Survey and Engineering Services remain limited in scope, but they are important where routes cross exclusive economic zones, seismic areas, or protected environments. These services can command value when early route selection determines the final permitting and construction schedule.

By Ownership Model:
Private Systems Challenge Consortium EconomicsConsortium and Multiple-Ownership Systems held 54.12% of segment revenue in 2025. These structures remain useful on routes with many landing countries, where local access and co-investment requirements favor shared governance. Government and multilateral development bank-backed systems serve a smaller role in island chains and developing regions where strategic access matters more than near-term returns. Orange and 6 partners signed a memorandum of understanding for the Via Africa open consortium system in May 2026.[2] The project targets a Europe-to-South Africa route along the Atlantic coast of West Africa. It illustrates how consortium structures can work with development-oriented partners and flexible cable architecture.
Single-Ownership and Private Systems are projected to expand at a 10.32% CAGR through 2031. Cerberus Capital Management closed a USD 2.3 billion continuation vehicle for SubCom in April 2026. Full fiber-pair control allows owners to set capacity allocation, latency priorities, and upgrade timing over a route's life. Private ownership can put pressure on consortia's economics when high-value participants leave pooled structures. Remaining carriers can still contribute through landing-station access, permitting knowledge, and national network integration. The strategic subsea cable corridors industry therefore retains a role for operators that provide these essential local capabilities.
By Fiber-Pair Capacity:
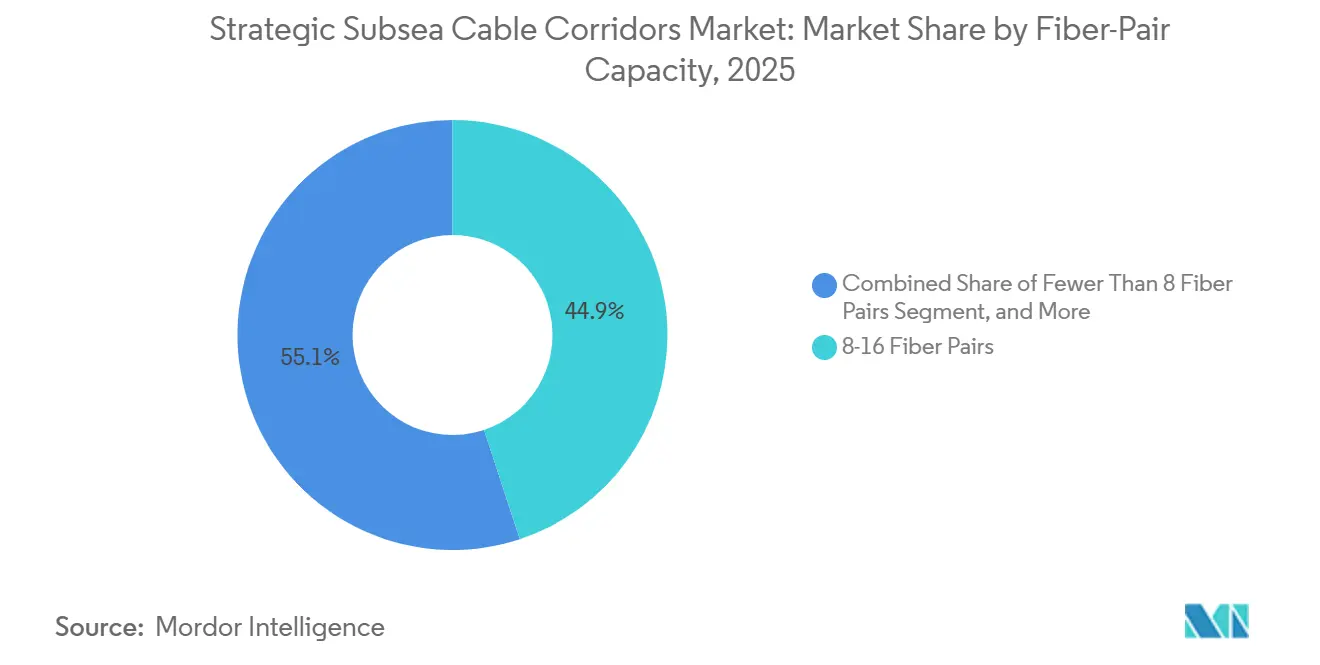
SDM Raises Capacity per Route8-16 Fiber Pair systems held 44.92% of deployed capacity in 2025. This configuration serves many mid-ocean routes with established installation practices and widely available components. Systems with fewer than 8 fiber pairs continue to support island connectivity and redundancy where resilience matters more than maximum throughput. The 17-24 fiber-pair category is gaining relevance as thinner fiber coatings allow more pairs within standard cable diameters. ITU-T guidance published in March 2025 addresses standardization for optical fibers used in space-division multiplexing systems. This work supports compatibility with established optical fiber standards.
Systems with 25 or more fiber pairs are projected to expand at a 9.78% CAGR through 2031. The strategic subsea cable corridors market size for this tier is supported by hyperscaler procurement and the need to reduce cost per unit of capacity. An Optical Fiber Communication Conference paper in 2025 reported a deployed SDM transatlantic capacity of 24 Tbps using probabilistic shaping and forward-error-correction gain sharing. Meta, SoftBank, IPS, TM, XLSmart, and NEC announced the Candle system in September 2025, featuring a 24-fiber-pair design. Higher fiber-pair systems require dependable repeaters, amplifiers, and wet-plant supplies. Buyers that arrange component purchases early are better able to protect project schedules.
By Corridor Type:
Transpacific Routes Lead as Europe-Africa ExpandsTranspacific Corridors held 24.61% of corridor revenue in 2025. The segment is supported by direct links between North American data centers and hubs in Japan, Singapore, and Australia. Google's Sol system connects the United States, Bermuda, the Azores, and Spain, showing that large cloud providers can manage route portfolios across several corridor types. Pacific Island Corridors are shaped by national connectivity and redundancy goals. America's Corridors also benefit from data hub development and new regional landing points. SubCom's MANTA system contract, announced in March 2025, links Mexico and the United States with Central and South America.
Europe-Africa Corridors are projected to expand at a 10.61% CAGR through 2031. Demand comes from digital inclusion programs, European funding, and the need for alternatives to concentrated routes. The Medusa ViaTunisia segment became Ready for Service in June 2026, creating a direct 1,050 km link between Marseille and Bizerte. The European Union funded 30% of construction costs through the Connecting Europe Facility Digital program. Europe-Asia Corridors retain importance for commercial traffic but are being redesigned to reduce exposure to vulnerable passages. Middle East-India routes are likewise using more mixed subsea and terrestrial configurations.
Geography Analysis
North America Strategic Subsea Cable Corridors Market
North America held 32.58% of regional revenue in 2025. The United States is a principal termination hub for both Atlantic and Pacific systems because major cloud operators and data centers are concentrated there. California, Oregon, and Washington are key landing areas for transpacific links. Canada's growing data center activity and Mexico's role in the Americas Corridor landings broaden the regional network. SubCom's MANTA contract added new landing access points in Veracruz, Mexico, and San Blas, Florida. Growth is more moderate than in Asia-Pacific because dedicated hyperscaler systems can reduce revenue available to independent carriers on core routes.
APAC, South America and Oceania Strategic Subsea Cable Corridors Market
Asia-Pacific is projected to expand at a 10.63% CAGR through 2031. The strategic subsea cable corridors market size in the region is driven by new intra-Asia and trans-Pacific routes connecting data centers and cloud regions. NEC contracted to lay the 8,900 km AUG East cable in July 2025 to connect Singapore and Japan via 7 Asia-Pacific economies, with completion targeted for Q3 2029.[3] Google and Chile signed an agreement in June 2025 for a 14,800-km trans-Pacific cable linking Valparaíso to Australia, with onward connections to Asia. Singapore's land and power constraints are encouraging investment in alternative gateways through Indonesia and the Philippines. India is also gaining attention as routes add connections between South and Southeast Asia.
EMEA and South America Strategic Subsea Cable Corridors Market
Europe is combining telecom corridor investment with substantial offshore power cable programs. The European Union's cable-security funding supports repair capacity, sensor integration, and priority projects across Mediterranean and Europe-Africa connections. NKT's contracts for the Eastern Green Link 3 and other Scottish connections show the scale of power projects competing for submarine installation resources. Africa is becoming an important extension of Europe-Africa routes, including the Medusa Africa initiative toward West Africa. South America is attracting direct links designed for higher-capacity service. The Middle East is adjusting route design to reduce dependence on chokepoints. These conditions make geographic diversity a central part of the strategic subsea cable corridors market. They also encourage developers to assess vessel access, repair capability, and landing readiness alongside demand forecasts. This broader planning approach can determine whether a proposed route is practical to build and operate.
Competitive Landscape
The strategic subsea cable corridors market is moderately concentrated among large system integrators, including SubCom, Alcatel Submarine Networks, NEC, and HMN Technologies. These companies have advantages in system design, manufacturing, installation expertise, and access to vessels. Their ability to secure cable ships or long-term charters is especially important when installation capacity is limited. NEC stated that it plans to invest JPY 100 billion (USD 636 million) in submarine cable technology and vessel capacity over 5 years. Alcatel Submarine Networks signed a contract for the SX Tasman Express system, which adds 400 Tbps of capacity across 16 fiber pairs and uses an open cable architecture. These moves show that suppliers are competing on both physical delivery capacity and the ability to support later technology upgrades.
Competition in cable manufacturing is moving toward vertical integration and turnkey delivery. Taihan Cable secured a second cable-laying vessel in May 2026 to build its ability to compete for offshore wind and subsea corridor work. Subsea won a turnkey supply-and-install contract for the Dunkerque offshore wind farm in France. Prysmian received a notice to proceed in June 2026 for the ELMED Italy-Tunisia electrical interconnector, valued at EUR 460 million (USD 499 million).[4] These examples illustrate how power and telecom capability can strengthen supplier positioning. Vessel ownership alone may not be enough for suppliers seeking upgrade revenue from open cable systems.
White-space opportunities remain in Pacific Island connectivity, East African branches, and routes where experienced incumbents have a limited operating history. Vendor screening can also narrow the eligible field for systems connected to the United States and Europe. This favors suppliers that can demonstrate compliant ownership, secure component sourcing, and credible delivery schedules. Operators with landing rights and relationships with national authorities remain important partners for private system owners. The strategic subsea cable corridors industry is therefore competitive at the integrator level but broader across manufacturing, repair, landing operations, and specialized engineering. In the strategic subsea cable corridors market, a supplier's position depends on whether it can combine technical capability with practical delivery resources.
Strategic Subsea Cable Corridors Industry Leaders
-
SubCom, LLC
-
Alcatel Submarine Networks SAS
-
NEC Corporation
-
Prysmian S.p.A.
-
Nexans S.A.
- *Disclaimer: Major Players sorted in no particular order
Strategic Subsea Cable Corridors Market Companies Covered in this Report
- SubCom, LLC
- Alcatel Submarine Networks SAS
- NEC Corporation
- Prysmian S.p.A.
- Nexans S.A.
- HENGTONG GROUP CO., LTD.
- HMN Technologies Co., Ltd.
- NKT A/S
- Sumitomo Electric Industries, Ltd.
- LS Cable & System Ltd.
- Ningbo Orient Wires & Cables Co., Ltd.
- Jiangsu Zhongtian Technology Co., Ltd.
- Hellenic Cables S.A.
- Taihan Cable & Solution Co., Ltd.
- Furukawa Electric Co., Ltd.
- TFKable Group
Recent Industry Developments in Strategic Subsea Cable Corridors Market
- August 2026: Jan De Nul completed the offshore export cable connection at the 495 MW Fengmiao 1 offshore wind farm in Taiwan, pulling 2 high-voltage export cables into the offshore substation and completing the offshore grid connection. The project reached financial close in 2025 and is scheduled for commercial operation in 2027.
- July 2026: Keppel secured the 5th and final fiber-pair commitment on the Bifrost Cable System, the first direct Singapore-to-U.S. west coast link through Indonesia spanning more than 20,000 km. The total contract value reached USD 1.3 billion, and the system supports artificial intelligence and cloud-native workloads with capacity above 240 Tbps.
- May 2026: Orange and 6 partners signed a memorandum of understanding to launch Via Africa, an open consortium submarine cable targeting connections from Europe to South Africa along the Atlantic coast of West Africa.
- April 2026: Cerberus Capital Management closed a USD 2.3 billion single-asset continuation vehicle for SubCom. The vehicle extended Cerberus's controlling stake and provided growth capital for global installation and manufacturing capacity.
Global Strategic Subsea Cable Corridors Market Report Scope
The Strategic Subsea Cable Corridors Market encompasses the planning, development, deployment, and maintenance of designated subsea routes that support telecommunications, power transmission, and data connectivity between regions. The report analyzes market trends, demand drivers, technological developments, competitive dynamics, and regulatory factors influencing the development of strategic subsea cable corridors across key geographic regions.
The Strategic Subsea Cable Corridors Market Report is Segmented by Service Offering (Installation and Commissioning Services, Maintenance and Repair Services, System Upgrade Services, and Route Survey and Engineering Services), Ownership Model (Consortium and Multiple-Ownership Systems, Single-Ownership and Private Systems, and Government and Multilateral Development Bank-Backed Systems), Fiber-Pair Capacity (Fewer Than 8 Fiber Pairs, 8-16 Fiber Pairs, 17-24 Fiber Pairs, and 25 or More Fiber Pairs), Corridor Type (Transatlantic Corridors, Transpacific Corridors, Europe-Asia Corridors, Europe-Africa Corridors, Intra-Asia Corridors, Americas Corridors, Middle East-India Corridors, and Pacific Island Corridors), and Geography (North America, South America, Europe, Asia-Pacific, Middle East, and Africa). The Market Forecasts are Provided in Terms of Value (USD).
Segmentation Overview
| Installation and Commissioning Services |
| Maintenance and Repair Services |
| System Upgrade Services |
| Route Survey and Engineering Services |
| Consortium and Multiple-Ownership Systems |
| Single-Ownership and Private Systems |
| Government and Multilateral Development Bank-Backed Systems |
| Fewer Than 8 Fiber Pairs |
| 8-16 Fiber Pairs |
| 17-24 Fiber Pairs |
| 25 or More Fiber Pairs |
| Transatlantic Corridors |
| Transpacific Corridors |
| Europe-Asia Corridors |
| Europe-Africa Corridors |
| Intra-Asia Corridors |
| Americas Corridors |
| Middle East-India Corridors |
| Pacific Island Corridors |
| North America | United States |
| Canada | |
| Mexico | |
| South America | Brazil |
| Chile | |
| Argentina | |
| Rest of South America | |
| Europe | Germany |
| United Kingdom | |
| France | |
| Netherlands | |
| Russia | |
| Rest of Europe | |
| Asia-Pacific | China |
| India | |
| Japan | |
| Singapore | |
| Australia | |
| Rest of Asia-Pacific | |
| Middle East | United Arab Emirates |
| Saudi Arabia | |
| Qatar | |
| Turkey | |
| Rest of Middle East | |
| Africa | South Africa |
| Egypt | |
| Kenya | |
| Rest of Africa |
| By Service Offering | Installation and Commissioning Services | |
| Maintenance and Repair Services | ||
| System Upgrade Services | ||
| Route Survey and Engineering Services | ||
| By Ownership Model | Consortium and Multiple-Ownership Systems | |
| Single-Ownership and Private Systems | ||
| Government and Multilateral Development Bank-Backed Systems | ||
| By Fiber-Pair Capacity | Fewer Than 8 Fiber Pairs | |
| 8-16 Fiber Pairs | ||
| 17-24 Fiber Pairs | ||
| 25 or More Fiber Pairs | ||
| By Corridor Type | Transatlantic Corridors | |
| Transpacific Corridors | ||
| Europe-Asia Corridors | ||
| Europe-Africa Corridors | ||
| Intra-Asia Corridors | ||
| Americas Corridors | ||
| Middle East-India Corridors | ||
| Pacific Island Corridors | ||
| By Geography | North America | United States |
| Canada | ||
| Mexico | ||
| South America | Brazil | |
| Chile | ||
| Argentina | ||
| Rest of South America | ||
| Europe | Germany | |
| United Kingdom | ||
| France | ||
| Netherlands | ||
| Russia | ||
| Rest of Europe | ||
| Asia-Pacific | China | |
| India | ||
| Japan | ||
| Singapore | ||
| Australia | ||
| Rest of Asia-Pacific | ||
| Middle East | United Arab Emirates | |
| Saudi Arabia | ||
| Qatar | ||
| Turkey | ||
| Rest of Middle East | ||
| Africa | South Africa | |
| Egypt | ||
| Kenya | ||
| Rest of Africa | ||
Key Questions Answered in the Report
What is the current scale of the strategic subsea cable corridors sector?
The sector was valued at USD 22.15 billion in 2025, is estimated at USD 23.94 billion in 2026, and is forecast to reach USD 36.47 billion by 2031.
What is driving demand for strategic subsea cable corridors?
Cloud expansion, artificial intelligence workloads, private hyperscaler routes, public resilience programs, and offshore power projects are increasing demand.
Which service offering held the largest share in 2025?
Installation and Commissioning Services held 48.65% share in 2025 because each new cable system requires route engineering, installation, and commissioning.
Which ownership model is growing fastest?
Single-Ownership and Private Systems are projected to grow at a 10.32% CAGR through 2031 as hyperscalers seek direct control of capacity and upgrades.
Which region is expected to grow fastest?
Asia-Pacific is projected to grow at a 10.63% CAGR through 2031, supported by new intra-Asia and transpacific routes.