Market Overview
| Study Period | 2020 - 2031 |
|---|---|
| Forecast Data Period | 2026 - 2031 |
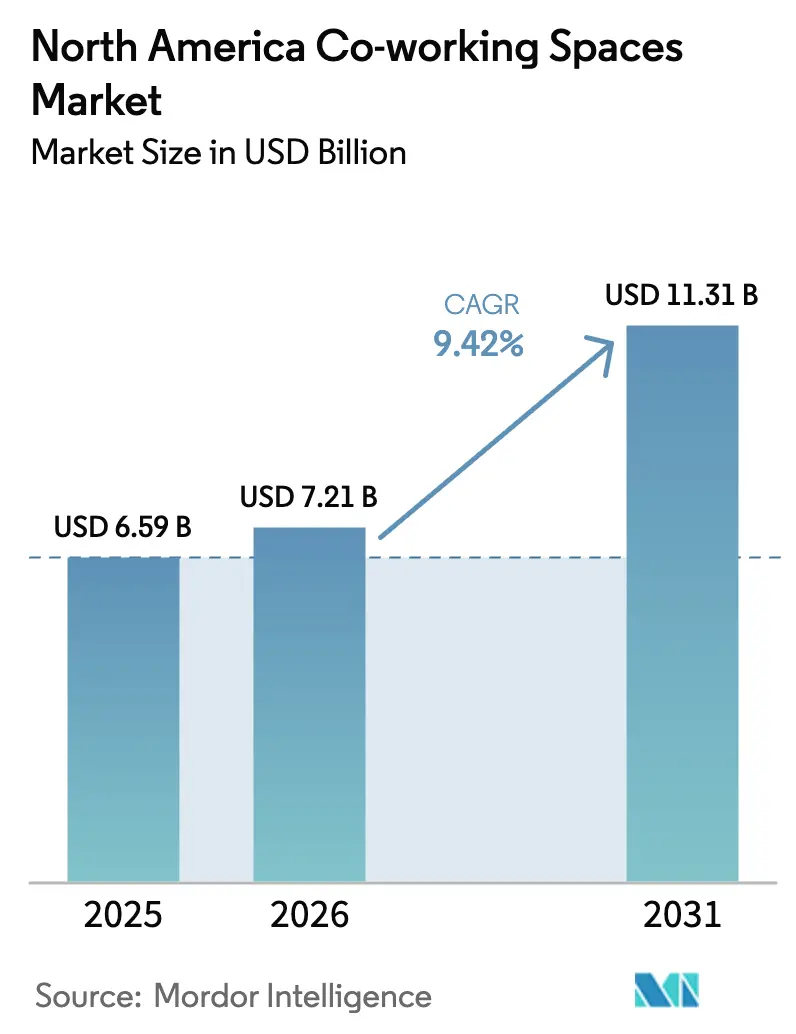
| Base Year Market Size (2025) | USD 6.59 Billion |
| Market Size (2026) | USD 7.21 Billion |
| Market Size (2031) | USD 11.31 Billion |
| Growth Rate (2026 - 2031) | 9.42% CAGR |
| Market Concentration | Low |
Major Players *Disclaimer: Major Players sorted in no particular order Image © Mordor Intelligence. Reuse requires attribution under CC BY 4.0. | |
North America Co-working Spaces Market Analysis by Mordor Intelligence
The North America Co-working Spaces Market size was valued at USD 6.59 billion in 2025 and is estimated to grow from USD 7.21 billion in 2026 to reach USD 11.31 billion by 2031, at a CAGR of 9.42% during the forecast period (2026-2031).
Structural shifts toward hybrid work, nearshoring, and cost discipline keep demand resilient, while landlord–operator partnerships accelerate the conversion of underused downtown towers and suburban sites into flex suites. Enterprise clients now treat co-working as a core real-estate lever for portfolio agility, which has pulled large brokers and institutional landlords deeper into the space. Sunbelt and secondary U.S. metros absorb most new supply as distributed-team architectures reshape location strategies, and Mexico records the region’s fastest growth on the back of cross-border manufacturing expansions. Competitive intensity remains high because no single brand controls more than a low teens share, yet barriers to new entry are rising as Class A inventory and amenity expectations escalate.
Key Report Takeaways
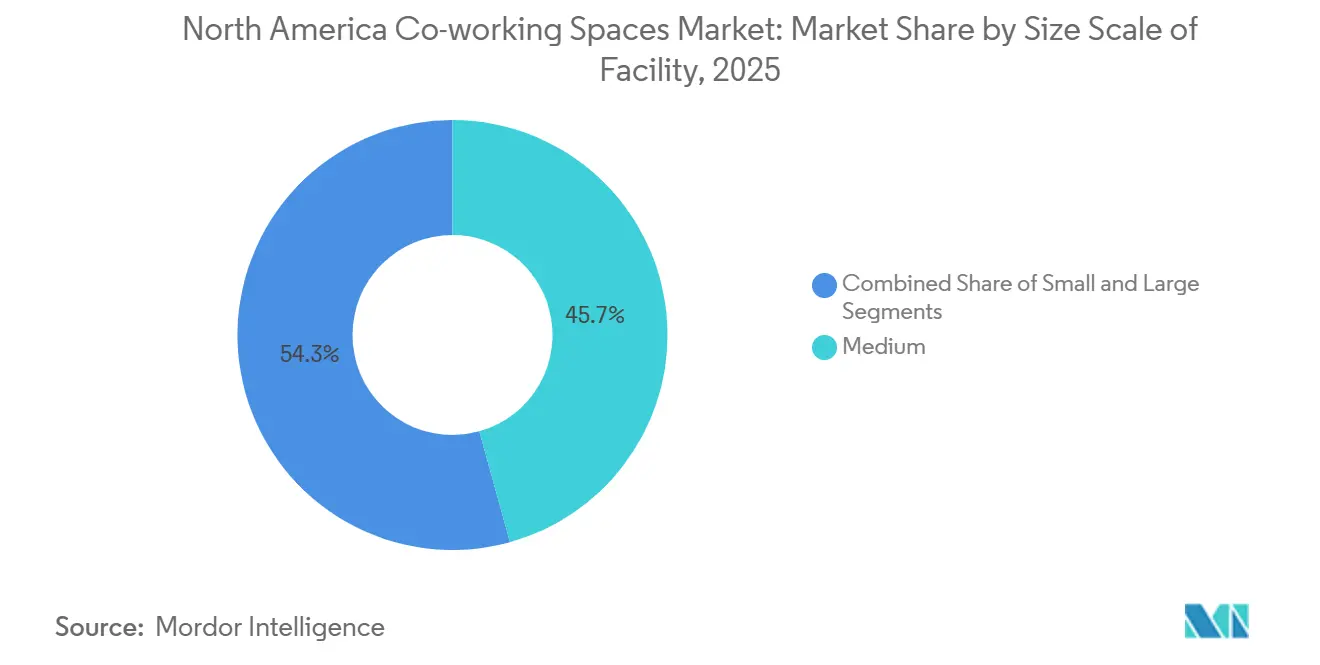
- By size of facility, medium-scale locations led with 45.7% of the North America co-working spaces market share in 2025, while large facilities are forecast to expand at a 10.33% CAGR to 2031.
- By sector, information technology and IT-enabled services captured 35.6% of the North America co-working spaces market size in 2025; the “other services” bucket is projected to log the fastest 10.67% CAGR through 2031.
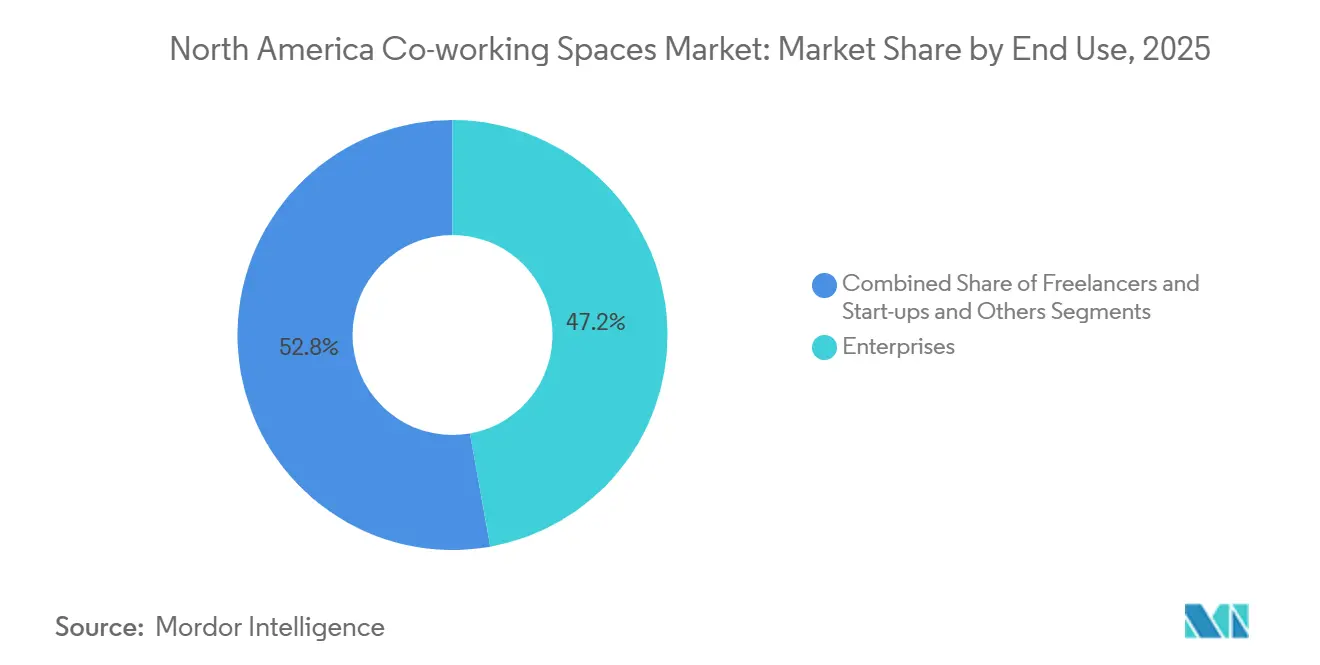
- By end use, enterprises held 47.2% of 2025 revenue, whereas startups and other small firms are poised to grow at an 11.12% CAGR to 2031.
- By country, the United States commanded 78.1% of 2025 revenue, and Mexico is anticipated to post an 11.41% CAGR to 2031.
Note: Market size and forecast figures in this report are generated using Mordor Intelligence’s proprietary estimation framework, updated with the latest available data and insights as of January 2026.
North America Co-working Spaces Market Trends and Insights
Drivers Impact Analysis*
| DRIVERS | (~) % IMPACT ON CAGR FORECAST | GEOGRAPHIC RELEVANCE | IMPACT TIMELINE |
|---|---|---|---|
| Hybrid work normalization pushing enterprises and SMEs to flexible, short-term space | +2.5% | United States and Canada urban cores | Medium term (2–4 years) |
| Cost optimization via capex-light expansion versus long leases | +2.0% | Entire region, strongest in U.S. and Mexico | Medium term (2–4 years) |
| Flight-to-quality: amenitized, well-located hubs outperform legacy offices | +1.8% | U.S. gateway metros, Toronto, Vancouver | Short term (≤2 years) |
| Rise of distributed teams and sunbelt nodes boosting secondary-market demand | +1.5% | Texas, Florida, Arizona, Mexican near-shoring zones | Long term (≥4 years) |
| Landlords partnering with operators to activate under-used assets | +1.2% | Major U.S. and Canadian metros | Medium term (2–4 years) |
| Source: Mordor Intelligence | |||
Hybrid Work Normalization Pushing Enterprises and SMEs to Flexible, Short-Term Space
U.S. office badge data stabilized at roughly 60–70% of 2019 levels during 2025, prompting employers to hard-code two-to-three-day schedules and trim owned footprints while securing on-demand capacity through memberships[1]U.S. Census Bureau, “Business Formation Statistics, Nov 2025,” census.gov . Fortune 500 firms increasingly embed co-working within portfolio playbooks, driving multi-location agreements that replace one-off leases. New business applications topped 535,000 in November 2025, keeping the pipeline of entrepreneurial customers strong. Government return-to-office directives ripple into private-sector norms and lift demand in Washington, D.C., and other capital-adjacent cities. The net effect is a durable reorientation toward variable real estate that can flex with head-count swings and project cycles.
Flight-to-Quality: Amenitized, Well-Located Hubs Outperform Legacy Offices
Class A downtown towers with wellness amenities, transit adjacency, and advanced digital infrastructure soak up a majority of new leasing, whereas aging Class B/C stock suffers widening vacancies[2]CBRE, “U.S. Life Sciences Outlook 2025,” cbre.com . Operators able to secure premium space gain pricing power and enterprise credibility. Industrious’s 240,000-square-foot deal at Tower 49 in mid-2024 typifies flight-to-quality reallocations, repurposing WeWork’s former flagship into an enterprise-grade hub. WeWork’s new “work-lounge” product, launched in July 2024, embeds co-working amenities for all tenants in a building, signaling an integrated rather than stand-alone future. Superior environments now set the competitive bar and push lagging landlords toward upgrade or demolition decisions.
Cost Optimization via Capex-Light Expansion versus Long Leases
Management contracts and revenue-share models dominate new signings, shaving millions in tenant-improvement outlays and freeing balance sheets on both sides of the table. CBRE’s USD 800 million purchase of the remaining Industrious equity embeds flex space into a USD 20 billion service line that cross-sells facilities management and analytics[3]Peter Grant, “Giant Property Firm Goes All In on Co-Working,” Wall Street Journal, wsj.com . IWG’s franchise approach, now 80% of new openings, pushes fit-out risk to operators yet retains platform fees. Combined, these models let providers scale into suburban and provincial zones with limited capital at risk, a vital advantage during high-rate cycles.
Rise of Distributed Teams and Sunbelt Nodes Boosting Secondary-Market Demand
Texas, Florida, and Arizona absorb outsized talent inflows, encouraging employers to open spoke-offices that shorten commutes and deepen labor pools. IWG flipped its network from 60% urban pre-pandemic to 80% suburban by 2025, while Industrious rolled out the lower-priced “Indy” banner for non-prime properties. Nearshoring pushes multinationals into Monterrey and Guadalajara, where flex suites support cross-functional project teams. Co-working supply in these growth corridors faces less saturation, enabling sustainable occupancy and rate integrity.
Restraints Impact Analysis*
| Restraints | (~) % IMPACT ON CAGR FORECAST | Geographic Relevance | Impact Timeline |
|---|---|---|---|
| Economic uncertainty and tech downsizing creating churn and occupancy volatility | -1.5% | Silicon Valley, Seattle, Austin, Toronto tech corridors | Short term (≤2 years) |
| Higher borrowing costs and TI/capex needs pressuring operator unit economics | -1.0% | United States and Canada | Medium term (2–4 years) |
| Competitive supply and thin brand differentiation driving price pressure in core metros | -0.8% | New York, San Francisco, Chicago, Toronto | Short term (≤2 years) |
| Source: Mordor Intelligence | |||
Economic Uncertainty and Tech Downsizing Creating Churn and Occupancy Volatility
Layoffs exceeding 386,000 across the tech sector from 2023 to early 2025 shrank seat demand in core innovation hubs and pushed Silicon Valley vacancy to nearly 20%. Start-ups downgraded from private offices to hot desks, elevating churn and compressing average revenue per workstation. Venture funding skewed to late-stage rounds, drying seed-stage pipelines that once filled early co-working cohorts. Operators mitigated risk by leaning into multi-year enterprise deals and diversifying geographically. Nonetheless, near-term volatility remains a headwind for occupancy forecasts.
Higher Borrowing Costs and TI/Capex Needs Pressuring Operator Unit Economics
Federal-funds rates peaked above 5% in 2024, lifting the cost of debt for tenant improvements that often run USD 50–150 per square foot. Some landlords paused upgrade budgets, shifting more capex to operators who, in turn, slowed pipeline growth. Smaller independents with limited balance sheets found financing scarce and exited saturated cities. Management contracts alleviate capital exposure but cap upside, creating a delicate margin balance until rates ease.
*Our forecasts treat driver/restraint impacts as directional, not additive. The impact forecasts reflect baseline growth, mix effects, and variable interactions.
Segment Analysis
By Size of Facility: Large-Format Hubs Ascend on Enterprise Demand
Large facilities exceeding 50,000 square feet captured 32% of the North America co-working spaces market in 2025, second only to the medium-scale cohort at 45.7%. They benefit from landlord co-investment, floor-to-ceiling amenity sets, and the capacity to dedicate entire floors to Fortune 500 tenants seeking privacy without long leases. The segment is set to deliver the fastest 10.33% CAGR through 2031, fueled by corporate “hub-and-spoke” models and the repositioning of towers from single-tenant to multi-tenant flex operations. The United States provides a deep bench of underutilized downtown high-rises ripe for conversion, while Mexico City landlords similarly retrofit obsolete stock into multi-floor coworking to meet near-shoring demand. Operators leverage economies of scale—concierge desks, café bars, podcast studios—to lift yield per square foot. Medium-scale sites will continue to anchor suburban and neighborhood nodes where demand is steadier, but transaction sizes are smaller.
Large hubs also enable providers to roll out technology platforms for access control, space analytics, and event management across a larger area, enhancing the user experience and data capture. CBRE’s Industrious integration exemplifies this scale play: the USD 800 million deal folds large-format flex suites into a USD 20 billion global services engine. WeWork’s re-entry strategy similarly focuses on 100,000-square-foot flagship sites in resilient metros. Over the forecast horizon, the segment’s share is expected to edge toward 40% as smaller downtown floors convert or close, reaffirming the North America co-working spaces market’s gravitation to scale.


By Sector: IT/ITES Still Dominant but Services Diversify Revenue
Information technology and IT-enabled services commanded 35.6% of 2025 demand, reflecting the segment’s early-adopter status and deep presence in Seattle, Austin, and Silicon Valley. Yet its growth pace moderates as layoffs and budget resets ripple through the software and digital advertising sectors. “Other services,” a composite of life sciences, legal, energy, and retail support, is forecast to clock the quickest 10.67% CAGR, broadening tenant mix and dampening cyclicality. Lab-enabled co-working for AI-native biotechs is gaining traction in Boston and San Diego, where wet-lab slots integrated with office suites speed R&D without multi-year leases. Legal firms increasingly favor turnkey suites with soundproof meeting rooms and on-site records storage to support hybrid staffing. Energy majors adopt suburban hubs in Houston and Calgary to host project teams near field operations.
The North America co-working spaces market size for life-sciences-linked co-working surpassed USD 500 million in 2024 and is positioned for double-digit expansion as surplus lab inventory converts to flexible use. Professional services adoption also scales because large accounting and consulting firms assign consultants to client sites, but need touchdown offices for brand presence. The sectoral shift tempers reliance on volatile venture-backed tech tenants and unlocks longer average membership terms, enhancing revenue predictability.
By End Use: Enterprises Hold the Lion’s Share, Start-Ups Lead Growth
Enterprise occupiers represented 47.2% of 2025 billings, drawn by the ability to spin up project offices, regional hubs, and drop-in passes across networks. Multi-market agreements often bundle facilities management, security, and workplace analytics, playing to the strengths of brokers such as CBRE and JLL that cross-sell services. The cohort also generates premium per-seat pricing due to higher security and privacy requirements. Start-ups and small businesses, while holding a smaller slice, will post an 11.12% CAGR to 2031—ahead of enterprise growth—thanks to continued business formation momentum and the popularity of one-to-three-person suites. November 2025 alone saw 71,214 professional-services applications, sustaining a pipeline of future members.
Enterprises typically commit to 12-to-36-month memberships, improving occupancy visibility for operators, whereas start-ups churn more rapidly but provide volume. Successful brands architect tiered products: enterprise floors with private elevators and resilient IT, and community floors populated by smaller companies that drive vibrancy. The North America co-working spaces market will depend on harmonizing these segments—balancing predictable corporate cash flows with the innovation culture that attracts talent.
Geography Analysis
The United States retained 78.1% revenue share in 2025, backed by 7,695 active sites and entrenched hybrid-work policies in gateway and sunbelt metros. National providers deploy data-driven site-selection tools to prioritize suburban nodes where post-pandemic population inflows have lifted day-pass usage, while large landlords embrace flex suites as a hedge against long-lease malaise. Life-sciences clusters on the coasts emerge as laboratory co-working conversion hotspots, cushioning the impact of tech downsizing in San Francisco and Seattle. The United States is expected to add an average of 500 new locations annually through 2031, though inventory growth moderates after 2027 as operators shift from footprint expansion to revenue-per-site optimization.
Canada displays mature yet slower momentum; Toronto and Vancouver anchor activity thanks to financial services and gaming studios that value downtown prestige and transit access. Vacancy in legacy towers nudges landlords into management agreements with regional operators or U.S. chains such as IWG, which leverage cross-border enterprise contracts. Calgary and Edmonton register upticks tied to energy-sector project cycles, while Montreal skews to creative agencies. Regulatory hurdles and compressed population densities curb explosive growth, but market depth supports steady high-single-digit expansion.
Mexico delivers the brightest outlook, charting an 11.41% CAGR to 2031 on the strength of near-shoring and a burgeoning tech-services ecosystem. Monterrey, Guadalajara, and Mexico City are focal points as U.S. multinationals establish engineering and support hubs to exploit trade advantages under USMCA. Operators typically enter via joint ventures with local landlords to navigate permitting and security nuances. Rising middle-class disposable income also propels domestic demand for professional work environments among freelancers and SMEs. Infrastructure gaps outside tier-one metros cap immediate upside, yet government investment in transportation corridors promises wider addressable markets beyond 2028.
Competitive Landscape
Competition is intense but fragmented: the top five brands control less than 30% of installed capacity, keeping the North America co-working spaces market open to regional specialists. CBRE’s fold-in of Industrious inserts a heavyweight service ecosystem into the arena, marrying flex space with 7 billion square feet of property under management and offering end-to-end workplace outsourcing for blue-chip occupiers. The deal underscores a strategic pivot from standalone co-working brands toward integrated real-estate solutions. IWG’s multi-label strategy (Regus, Spaces, HQ, Signature) enables micro-segmentation by price point and location, while its franchise model limits capital exposure and accelerates suburban rollouts.
WeWork, post-bankruptcy, operates about 150 U.S. sites with a lighter balance sheet and an “affiliate network” mix of revenue-share and management agreements that stabilize occupancy risk. The firm now emphasizes enterprise contracts and amenity-rich lounges within landlord-controlled buildings, hoping to monetize brand equity without lease overhangs. Mid-tier challengers such as Serendipity Labs, Convene, and Venture X carve niches in hospitality-driven design, meeting-centric models, or local-ownership franchises, respectively. Lab-focused entrants partner with biotech landlords to tailor HVAC and compliance features that mainstream operators lack.
Strategic plays center on technology integration; operators equip mobile apps for room booking, occupancy analytics, and member networking to build switching costs. Others pursue vertical specialization—legal or creative hubs—to escape pure price wars. M&A chatter persists around regional chains with profitable suburban portfolios, while distressed downtown sites offer bargain entry points for well-capitalized buyers. Over the medium term, the North America co-working spaces industry is expected to consolidate around a handful of platform brands complemented by specialist providers.
North America Co-working Spaces Industry Leaders
WeWork Inc.
IWG plc (Regus, HQ, Spaces)
Industrious LLC
Impact Hub GmbH
Green Desk
- *Disclaimer: Major Players sorted in no particular order


Recent Industry Developments
- January 2025: CBRE closed its USD 400 million buyout of the remaining Industrious stake, valuing the operator at USD 800 million and creating a Building Operations & Experience segment with USD 20 billion revenue.
- July 2024: WeWork converted 15,000 square feet at 575 Lexington Avenue into a multi-tenant “work lounge,” marking its pivot toward shared amenities within landlord-owned buildings.
- June 2024: Industrious took over 240,000 square feet across 16 floors at Tower 49, NYC, under a 10-year management agreement that repurposes WeWork’s former HQ.
- May 2024: WeWork emerged from Chapter 11, shuttered 200 unprofitable sites, and launched a three-track deployment model—revenue-share, management, selective leases—to protect downside.


North America Co-working Spaces Market Report Scope
Coworking Space is an environment that accommodates people from different companies who come to work. Shared facilities, services, and tools characterize coworking space.
The report provides a comprehensive background analysis of the North America Coworking Spaces market, covering the current market trends, restraints, technological updates, and detailed information on various segments and the industry's competitive landscape. Additionally, the impact of geopolitics and pandemic on the market has been incorporated and considered during the study.
The coworking spaces market in North America is segmented by End Use (Information Technology (IT and ITES), BFSI (Banking, Financial Services and Insurance), Business Consulting & Professional Services, Other Services (Retail, Lifesciences, Energy, Legal Services)), By User (Freelancers, Enterprises, Start Ups and Others).
By Size & Scale of Facility
| Small |
| Medium |
| Large |
By Sector
| Information Technology (IT & ITES) |
| BFSI |
| Business Consulting & Professional Service |
| Other Services (Retail, Lifesciences, Energy, Legal) |
By End Use
| Freelancers |
| Enterprises |
| Start-ups & Others |
By Country
| United States |
| Canada |
| Mexico |
| By Size & Scale of Facility | Small |
| Medium | |
| Large | |
| By Sector | Information Technology (IT & ITES) |
| BFSI | |
| Business Consulting & Professional Service | |
| Other Services (Retail, Lifesciences, Energy, Legal) | |
| By End Use | Freelancers |
| Enterprises | |
| Start-ups & Others | |
| By Country | United States |
| Canada | |
| Mexico |


Key Questions Answered in the Report
How big is the North America co-working spaces market in 2026, and where will it be by 2031?
The North America co-working spaces market size stands at USD 7.21 billion in 2026 and is projected to reach USD 11.31 billion by 2031.
Which facility size captures the largest share today?
Medium-scale locations account for 45.7% of 2025 revenue, reflecting their broad appeal to both corporate teams and start-ups.
What is the fastest-growing country segment?
Mexico leads with an 11.41% CAGR forecast to 2031, propelled by near-shoring and cross-border expansions.
Why are landlords partnering with coworking operators?
Partnerships convert vacant floors into income, share risk, and add amenities that attract flight-to-quality tenants without heavy capex.
Which end-user group drives the highest growth?
Start-ups and small businesses are expected to expand at an 11.12% CAGR as elevated business-formation levels persist.
How fragmented is competition among providers?
The market scores 3 on a 1–10 concentration scale because the top five brands hold less than 30% of total seats, leaving room for regional specialists.
Page last updated on:


