Concrete Fiber Market Size and Share
Market Overview
| Study Period | 2021 - 2031 |
|---|---|
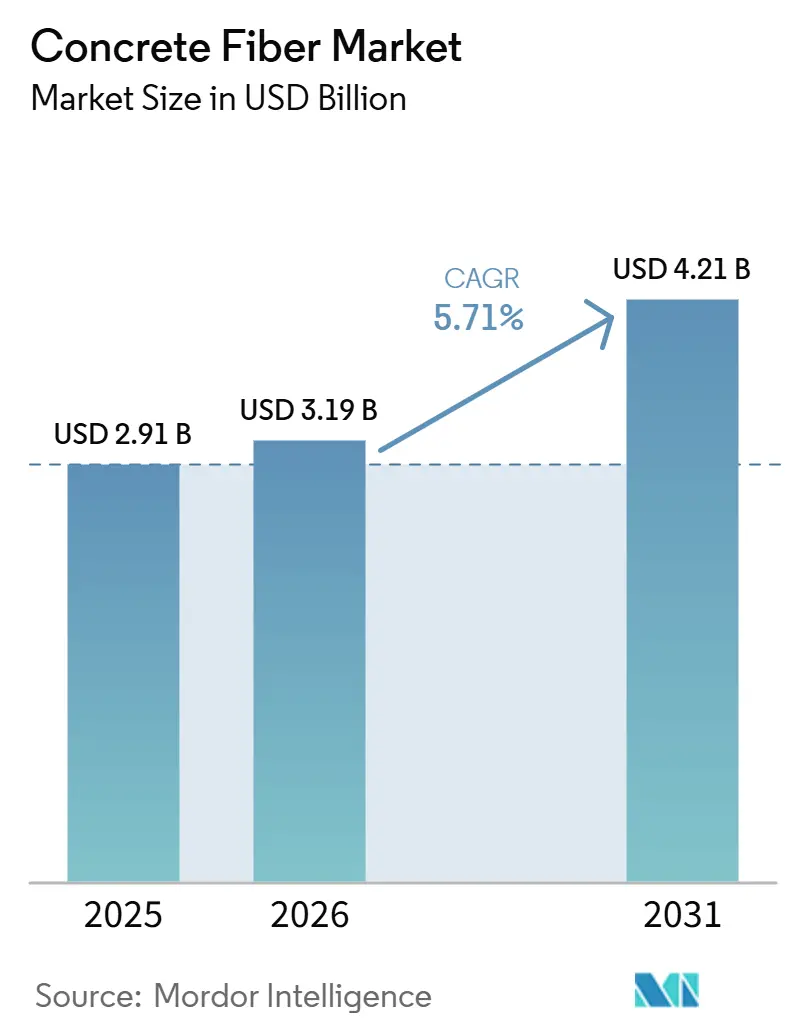
| Market Size (2026) | USD 3.19 Billion |
| Market Size (2031) | USD 4.21 Billion |
| Growth Rate (2026 - 2031) | 5.71% CAGR |
| Fastest Growing Market | Asia-Pacific |
| Largest Market | Asia-Pacific |
| Market Concentration | Medium |
Major Players *Disclaimer: Major Players sorted in no particular order Image © Mordor Intelligence. Reuse requires attribution under CC BY 4.0. | |
Concrete Fiber Market Analysis by Mordor Intelligence
The Concrete Fiber Market was valued at USD 2.91 billion in 2025 and is estimated to grow from USD 3.19 billion in 2026 to reach USD 4.21 billion by 2031, at a CAGR of 5.71% during the forecast period (2026–2031). The concrete fiber market is supported by infrastructure spending in emerging economies, stricter durability requirements in North America and Europe, and the replacement of conventional rebar or mesh where fiber-reinforced concrete lowers lifecycle costs. Contractors and specifiers increasingly select fibers during project design rather than as a remedial measure, which increases fiber volumes per project and reduces dependence on construction cycles. Sustainability requirements are also changing the competition, particularly where procurement rules favor verified environmental information and circular materials. These conditions may separate the concrete fiber market into certified, higher-value products and price-led commodity products over the forecast period. Steel wire price changes, uneven adoption of performance standards, and geographically concentrated basalt fiber supply remain material risks for suppliers and buyers.
Key Report Takeaways
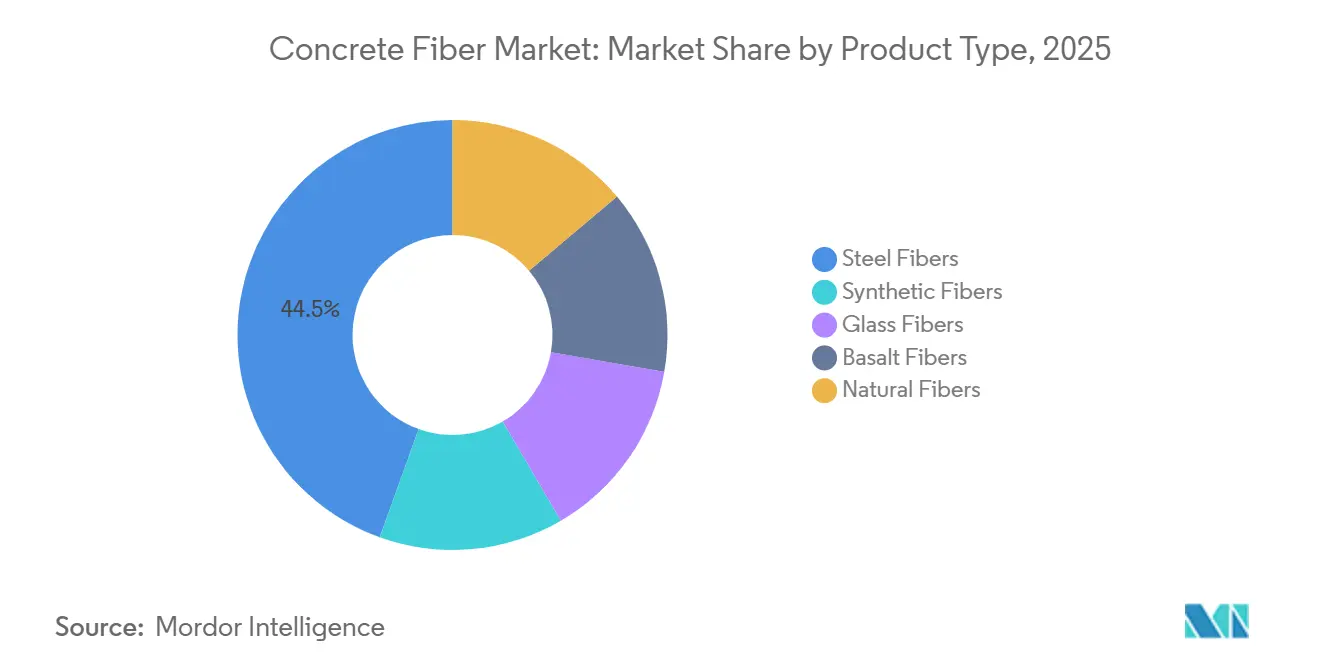
- By product type, steel fibers held 44.51% of the concrete fiber market share in 2025, while basalt fibers are forecast to grow at a 7.44% CAGR through 2031.
- By form, monofilament held 41.62% of the concrete fiber market share in 2025, while chopped fiber is forecast to grow at a 6.53% CAGR through 2031.
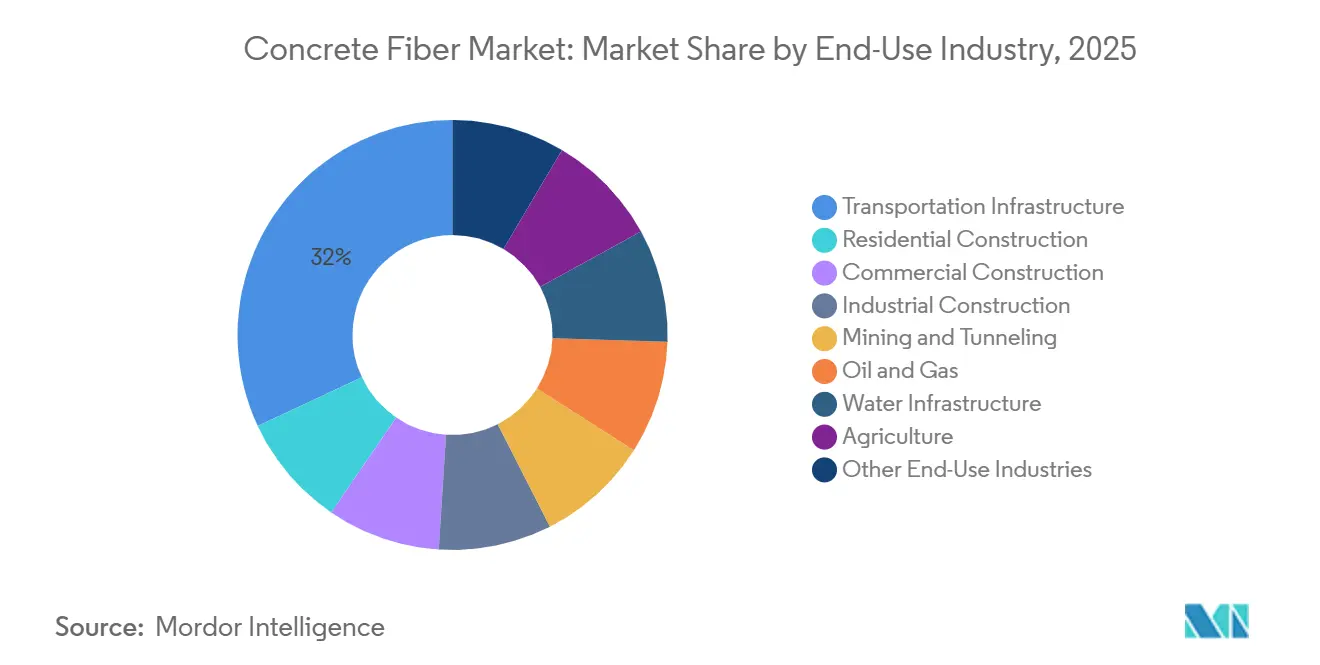
- By end-use industry, transportation infrastructure held 31.96% of the concrete fiber market share in 2025, while water infrastructure is forecast to grow at a 6.68% CAGR through 2031.
- By geography, Asia-Pacific held 43.57% of the concrete fiber market share in 2025 and is forecast to grow at a 6.34% CAGR through 2031.
Note: Market size and forecast figures in this report are generated using Mordor Intelligence’s proprietary estimation framework, updated with the latest available data and insights as of January 2026.
Global Concrete Fiber Market Trends and Insights
Drivers Impact Analysis*
| Driver | (~) % Impact on CAGR Forecast | Geographic Relevance | Impact Timeline |
|---|---|---|---|
| Increasing Adoption of Concrete Fibers for Crack Control and Enhanced Durability | +1.5% | Global, concentrated in North America, Europe, and APAC | Medium term (2–4 years) |
| Growing Demand for High-Performance Pavements and Industrial Flooring Solutions | +1.2% | Global, with concentration in Germany, India, and the United States | Short term (≤2 years) |
| Expanding Use of Fiber-Reinforced Concrete in Tunnel Lining and Shotcrete Applications | +0.9% | Europe, APAC core, spill-over to MEA and South America | Long term (≥4 years) |
| Rising Adoption of Precast Concrete and Modular Construction Techniques | +0.7% | North America, Europe, and high-income APAC markets | Medium term (2–4 years) |
| Growing Preference for Corrosion-Resistant Synthetic and Non-Metallic Fibers in Aggressive Environments | +0.6% | APAC core, MEA, coastal North America and Europe | Long term (≥4 years) |
| Source: Mordor Intelligence | |||
Increasing Adoption of Concrete Fibers for Crack Control and Enhanced Durability
Infrastructure owners are increasingly specifying fiber reinforcement during design instead of using it as a corrective measure after cracking occurs. Owners use fiber reinforcement to manage cracking and increase durability in demanding assets. This supports the concrete fiber market because owners can evaluate the material against maintenance costs rather than initial material cost alone. Some European municipal road authorities have started to require fiber-reinforced concrete for extended maintenance-free contractor guarantees, which can make fiber use part of long-term procurement requirements. A longer project record also lowers the perceived specification risk for consulting engineers and makes fiber reinforcement easier to include in standard project templates. The resulting demand is less tied to short-term raw material price movements than demand based only on remedial repair work.
Growing Demand for High-Performance Pavements and Industrial Flooring Solutions
Steel fiber-reinforced concrete is widely used for heavy-duty industrial floors in mature construction markets. Germany installs around 10 million square meters of industrial floors each year using steel fiber-reinforced or hybrid reinforcement systems under German Concrete Association guidance, according to the supplied technical source. Data centers add another demand source because jointless slabs can meet the load requirements of high-density server racks. Guidance for jointless floor systems places steel fiber dosage at 40-45 kg/m³, which keeps fiber demand high per square meter of completed floor. India’s Gati Shakti National Master Plan also supports pavement and freight-corridor construction, creating demand for steel and polypropylene fibers. The concrete fiber market, therefore, serves both high-volume pavement work and higher-value flooring projects with demanding structural requirements. It also gives producers a reason to develop mixes and technical support for projects that need reliable placement, joint control, and long service life. These applications are important because a minor change in dosage can affect the volume of fiber required over a large floor or pavement area.
Expanding Use of Fiber-Reinforced Concrete in Tunnel Lining and Shotcrete Applications
Steel fiber-reinforced permanent sprayed concrete lining systems are gaining acceptance in rail and road tunnels. These systems can combine structural lining and waterproofing in one shotcrete shell, replacing the traditional double-shell approach and reducing total steel use by 50% in the referenced technical case. KrampeHarex supplied steel fibers to Singapore’s Deep Tunnel Sewerage System 2 (DTSS2) deep tunnel sewerage scheme, where the inner lining required a 100-year design life under severe hydrogen sulfide exposure. Fire safety rules in Europe and Asia also increasingly require polypropylene fibers alongside steel fibers to reduce explosive spalling during tunnel fires. This hybrid requirement increases the number of fiber products specified for a project and raises the value of the fiber blend used per cubic meter. Urban metro extensions in South and Southeast Asia, mountain road corridors in Central Asia, and projects in the Andes provide a broad pipeline for fiber-reinforced shotcrete. The concrete fiber market can benefit when designers use permanent sprayed linings because the reinforcement decision is made early in the engineering process. Suppliers must still provide products that meet project-specific fire, durability, and energy-absorption requirements.
Rising Adoption of Precast Concrete and Modular Construction Techniques
Precast steel fiber-reinforced concrete is gaining use in volumetric modular construction because its uniform reinforcement can remove the need for custom rebar cage layouts. A July 2025 study demonstrated 3D modular construction with precast steel fiber-reinforced concrete stiffened panels in units 5-8 m long with 8 cm wall thicknesses. Factory production also gives suppliers a more predictable customer base than dispersed site contractors. This can support longer supply agreements and reduce short-cycle changes in order volumes. Mapei presented the use of Mapefibre ST 40 Plus macro-synthetic fiber in precast concrete-timber modular slabs at Milan’s Milan Innovation District (MIND) development, showing that modular projects can involve material co-development rather than price-led purchasing alone[1]Mapei, “Towards a More Sustainable Precast Industry, Modular Prefab Construction at MIND Now Includes Mapei Fibers,” Mapei, mapei.com.. These factory-controlled applications broaden the concrete fiber market beyond conventional on-site placement and strengthen the concrete fiber market link to manufacturing-led construction. They also give construction teams more control over mix consistency, reinforcement distribution, and repeatable component quality. That operating model can favor suppliers that can meet stable product and delivery requirements over longer manufacturing schedules.
Restraints Impact Analysis*
| Restraint | (~) % Impact on CAGR Forecast | Geographic Relevance | Impact Timeline |
|---|---|---|---|
| Higher Initial Material Costs Compared to Conventional Reinforcement Methods | -0.8% | Global, most acute in price-sensitive emerging markets (South Asia, Sub-Saharan Africa) | Short term (≤2 years) |
| Challenges Related to Fiber Dispersion and Concrete Workability During Installation | -0.5% | Global, particularly APAC and South America where skilled labor availability is constrained | Medium term (2–4 years) |
| Limited Standardization and Industry Acceptance of Natural and Basalt Fiber Reinforcement | -0.4% | MEA, South America, and secondary markets in APAC | Long term (≥4 years) |
| Source: Mordor Intelligence | |||
Higher Initial Material Costs Compared to Conventional Reinforcement Methods
Steel fiber dosages of 20-40 kg/m³ can create a 15-30% material cost premium over welded-wire mesh in comparable structural applications. That premium remains difficult to accept in public programs that award contracts primarily on the lowest initial bid. The supplied research also notes that fiber-reinforced industrial slabs can require 30-40% fewer joint repairs over 20 years than mesh-reinforced alternatives, which can outweigh the initial difference. However, many emerging-market procurement systems do not give sufficient weight to lifecycle savings when tenders are assessed. The World Bank’s work on infrastructure procurement guidelines supports broader consideration of value and lifecycle cost, but adoption differs widely across markets. Until these practices are more established, the upfront price premium will limit conversion in price-sensitive parts of the concrete fiber market and constrain broader concrete fiber market adoption.
Challenges Related to Fiber Dispersion and Concrete Workability During Installation
Nonuniform fiber distribution can affect structural performance and surface quality, particularly in large pours and slipform applications. A study in the American Society of Civil Engineers (ASCE) Journal of Transportation Engineering found that polypropylene fiber contents above 0.25% reduced compressive strength by 1.7% compared with unfibered control mixes[2]American Society of Civil Engineers, “Improving Stormwater Quality Using Micropolypropylene Fiber-Reinforced Pervious Concrete as Pavement,” Journal of Transportation Engineering, Part B: Pavements, ascelibrary.org.. Contractors may need to adjust water-cement ratios and admixture systems to manage this workability effect. Installation quality also depends on accurate batching, consistent mixing, and skilled site supervision, which are not always available on complex projects. Sika and BASF have sought to reduce this obstacle by combining fiber supply with application engineering support. Smaller regional suppliers may find it harder to provide comparable technical service at scale, especially in markets with limited quality assurance resources.
*Our forecasts treat driver/restraint impacts as directional, not additive. The impact forecasts reflect baseline growth, mix effects, and variable interactions.
Segment Analysis
By Product Type: Steel Fibers Lead, While Basalt Fibers Address Corrosion Needs
Steel fibers held 44.51% of total revenue in 2025. Their position in the concrete fiber market reflects long-established use in industrial flooring, tunnel linings, and heavy-duty pavements. Specifications for demanding projects often define tensile strength and aspect-ratio requirements that steel fibers can meet at familiar cost levels. Synthetic fibers, including polypropylene, nylon, polyester, and other polymer grades, form the second-largest product category. They are used where corrosion resistance is more important than maximum structural reinforcement. Water-retaining structures and coastal projects are prominent applications because conventional steel reinforcement can face corrosion risk. Glass fibers retain a specialized place in architectural precast and curtain wall work. Natural fibers remain small and regionally concentrated, where local supply and cost sensitivity affect concrete mix choices.
The basalt fibers are forecast to expand at a 7.44% CAGR through 2031. Basalt fibers are made from volcanic rock and are selected for corrosion resistance and thermal stability at temperatures near 700 °C. A 2026 Springer Nature study reported that unidirectional basalt textile-reinforced polymer systems raised flexural capacity by 5.5-26.8% for deficient structural members when surface preparation was optimized. A 2026 Multidisciplinary Digital Publishing Institute (MDPI) study found that 2.5% vol. basalt fibers increased impact toughness by up to 83.7% in recycled aggregate concrete composite assemblies after 30 saltwater dry-and-wet cycles. These results support the concrete fiber market in aggressive chemical and coastal environments. China and Russia hold most global basalt fiber production capacity, creating a cost advantage for suppliers in those countries. The same concentration creates continuity risk for Western buyers and may support investment in European and North American production.


By Form: Monofilament Leads, While Chopped Fiber Gains Use in Structural Applications
Monofilament held 41.62% of total revenue in 2025. Its broad compatibility with ready-mix systems supports the concrete fiber market in residential and light commercial slabs-on-ground. The single-strand form can reduce balling and clumping during drum-mixer blending. This addresses a frequent operational concern for site teams moving from mesh reinforcement to fibers. Multifilament fibers are used in specialized precast and architectural panel applications. Their larger specific surface area can improve strand-to-matrix contact and crack bridging. Continuous fiber remains a small, differentiated form for thin-shell precast units, composite work, and research-stage 3D-printed concrete. These uses require controlled fiber orientation and benefit from strand continuity.
Chopped fiber is forecast to expand at a 6.53% CAGR from 2026 to 2031 within the concrete fiber market. Its growth reflects wider use in tunnel shotcrete, precast production, and volumetric modular construction. These applications require controlled dosage and post-crack energy absorption. Chopped steel fibers have become a standard specification for tunnel shotcrete projects in Europe. National infrastructure standards link performance classes to fiber type and dosage. The shift toward chopped forms shows that fibers are increasingly treated as structural reinforcement rather than secondary crack-control additives. That positioning supports premium products but also increases the importance of certified testing. Suppliers that can demonstrate consistent dosage performance will be better placed in complex infrastructure applications.
By End-Use Industry: Transportation Infrastructure Holds the Largest Position, While Water Infrastructure Grows Fastest
Transportation infrastructure accounted for 31.96% of total revenue in 2025. Road and bridge pavement programs, airport apron resurfacing, and rail track-bed structures support this position in Asia, the Middle-East, and North America. Pervious concrete with micro-polypropylene fiber is also being used to address stormwater management and pavement performance. A 2026 ASCE study found that 0.15% micro-polypropylene fiber improved tensile strength by 15.2% and flexural strength by 17.3% while maintaining permeability for heavy rainfall conditions. The concrete fiber industry benefits when projects require both structural capacity and water management performance. Residential and commercial construction remain substantial volume users. Their demand is more sensitive to housing and building cycles than to changes in fiber specifications.
Water infrastructure is forecast to grow at a 6.68% CAGR through 2031. Climate resilience investment and evolving technical requirements support this concrete fiber market growth rate. China issued T/CUPC 037-2026 for fiber-reinforced concrete construction in water conservancy projects, covering material selection, mixing, placement, and quality inspection for dams, canals, pumping stations, and reservoirs. A June 2026 Scientific Reports study found that polyvinyl alcohol (PVA) fiber concrete improved resistance to high-strain-rate loading in hydraulic dam applications. Mining and tunneling, oil and gas, industrial construction, and agriculture account for the remaining demand. Mining and tunneling show above-average growth through underground programs in Africa, Australia, and Southeast Asia. Requirements set by standards bodies can reshape demand because fiber use becomes linked to project compliance rather than contractor preference.
Geography Analysis
Asia-Pacific held 43.57% of the total revenue in 2025 and is forecast to grow at a 6.34% CAGR through 2031. This concrete fiber market position combines high-volume construction in Southeast Asia with more advanced performance specifications in Northeast Asia. China’s demand is supported by high-speed rail, urban metro, and water conservancy projects. India is the fastest-growing national market, driven by expressway construction under Gati Shakti, metro expansion in Tier 1 and Tier 2 cities, and affordable housing construction. Fiber-reinforced slabs are increasingly specified for ground-floor and basement applications. Japan and South Korea generate demand from infrastructure renewal rather than large greenfield programs. Aging bridge decks and tunnel linings create demand for repair overlays and sprayed concrete rehabilitation.
North America and Europe are established demand centers where suppliers compete more on performance and sustainability than volume. Federal infrastructure spending in North America supports high-specification pavement and bridge deck projects. In Europe, logistics construction continues to support jointless fiber-reinforced floors with documented carbon credentials. KrampeHarex supplied steel fibers for around 50,000 m² of flooring at Prologis Logistics Parc in Bottrop, Germany, under BEG Standard 4 sustainability requirements in 2024. France, Germany, and the United Kingdom are mature regional markets with standards and installed bases of steel fiber-reinforced industrial floors. Italy and Russia add demand through tunneling and precast activity. Environmental Product Declarations are becoming a practical requirement for premium specifications under the EU Taxonomy and similar North American frameworks.
South America and Middle-East and Africa are regions with different demand conditions. Brazil and Argentina are the main South American demand centers. Brazil’s infrastructure concessions and port logistics support mid-grade fiber demand, while Argentina’s lithium mining projects require shotcrete fibers for underground work. American Society for Testing and Materials (ASTM) C1116 for synthetic fiber reinforcement is influencing specifications in the Middle-East and Africa, where international developers and engineering contractors are adopting more formal compliance requirements. Saudi Arabia’s large construction programs support demand for road infrastructure, utility tunnels, and urban developments. South Africa provides a steady base of shotcrete demand from platinum and gold mining.


Competitive Landscape
The concrete fiber market has moderate concentration, with top players including Bekaert, Sika AG, Owens Corning, CEMEX S.A.B. de C.V., and BASF. Regional specialists in China, Germany, and the United States compete for volume-sensitive contracts. Global companies in the concrete fiber market increasingly emphasize certified sustainable products, application engineering, and digital specification tools. Many regional competitors focus on delivered cost and dependable local supply. In January 2026, Bekaert launched Dramix Loop, a steel fiber made from end-of-life tire cords at an industrial scale. The product has a Global Warming Potential of 0.0436 kg CO₂eq per kg and 80% lower CO₂ emissions than conventional steel fiber, according to Bekaert. Its compatibility with LEED, Building Research Establishment Environmental Assessment Method (BREEAM), and EU Taxonomy requirements positions it for industrial flooring and precast projects with sustainability-led procurement.
Hybrid steel and polypropylene systems represent an area where the concrete fiber market has no clearly dominant portfolio. These systems can meet structural requirements while helping reduce fire-related spalling in tunnel linings. Environmental Product Declarations compliant with ISO 14025, CE marking under EN 14889 for steel fibers, and integration with embodied-carbon calculation tools are increasingly important in European and North American specifications. Certification can create a barrier for smaller producers that lack testing resources and documented product data. The supplied research indicates that certification is expanding beyond traditional manufacturing bases. It also raises the documentation threshold for smaller regional suppliers.
Owens Corning completed the sale of its glass reinforcements business to Praana Group in April 2026 at a revised enterprise value of USD 645 million. The transaction transferred 18 manufacturing operations across 12 countries with around 4,000 employees and provided Owens Corning with USD 280 million in upfront cash proceeds. This move could create opportunities for competitors focused solely on glass reinforcement applications. In May 2026, Bekaert completed the acquisition of Bridgestone tire reinforcement operations in China and Thailand, adding EUR 80 million in annual sales and expanding its steel-wire footprint in Asia. The EUR 60 million transaction includes a long-term supply agreement with Bridgestone. It strengthens Bekaert’s raw material access and manufacturing footprint for steel fiber production in Asia.
Concrete Fiber Industry Leaders
BASF
Sika AG
Bekaert
Owens Corning
CEMEX S.A.B. de C.V.
- *Disclaimer: Major Players sorted in no particular order


Recent Industry Developments
- May 2026: Owens Corning completed the sale of its glass reinforcements business to Praana Group at a revised enterprise value of USD 645 million, transferring 18 manufacturing operations across 12 countries employing approximately 4,000 people. Through this, Praana Group gained control of one of the world's largest glass fiber manufacturing networks, potentially accelerating capacity expansion into South Asian markets.
- April 2025: MEIL Group's subsidiary Olectra launched Glass Fiber Reinforced Polymer (GFRP) rebar as an alternative to conventional steel reinforcement in concrete structures. The product utilizes continuous glass fibers embedded in a polymer matrix to provide corrosion resistance, lower weight, and improved durability, supporting the adoption of advanced fiber-reinforced concrete reinforcement solutions.


Global Concrete Fiber Market Report Scope
Concrete fiber is a building material additive consisting of short, discrete fibers, such as steel, glass, synthetic, or natural materials, mixed uniformly into concrete to control cracking, improve toughness, and enhance overall durability. Made from materials like polypropylene or nylon, these fibers are dosed in small amounts primarily to mitigate early-age plastic shrinkage cracking.
The Concrete Fiber Market is segmented by product type, by form, by end-use industry, and by geography. By product type, the market is segmented into steel fibers, synthetic fibers, glass fibers, basalt fibers, and natural fibers. By form, the market is segmented into monofilament, multifilament, chopped fiber, and continuous fiber. By end-use industry, the market is segmented into transportation infrastructure, residential construction, commercial construction, industrial construction, mining and tunneling, oil and gas, water infrastructure, agriculture, and other end-use industries. The report also covers the market size and forecasts for concrete fiber in 16 countries across major regions. For each segment, the market sizing and forecasts have been done on the basis of value (USD).
| Steel Fibers | |
| Synthetic Fibers | Polypropylene (PP) |
| Nylon | |
| Polyester | |
| Other Synthetic Fibers | |
| Glass Fibers | |
| Basalt Fibers | |
| Natural Fibers |
| Monofilament |
| Multifilament |
| Chopped Fiber |
| Continuous Fiber |
| Transportation Infrastructure |
| Residential Construction |
| Commercial Construction |
| Industrial Construction |
| Mining and Tunneling |
| Oil and Gas |
| Water Infrastructure |
| Agriculture |
| Other End-Use Industries |
| Asia-Pacific | China |
| India | |
| Japan | |
| South Korea | |
| Rest of Asia-Pacific | |
| North America | United States |
| Canada | |
| Mexico | |
| Europe | Germany |
| United Kingdom | |
| France | |
| Italy | |
| Russia | |
| Rest of Europe | |
| South America | Brazil |
| Argentina | |
| Rest of South America | |
| Middle-East and Africa | Saudi Arabia |
| South Africa | |
| Rest of Middle-East and Africa |
| By Product Type | Steel Fibers | |
| Synthetic Fibers | Polypropylene (PP) | |
| Nylon | ||
| Polyester | ||
| Other Synthetic Fibers | ||
| Glass Fibers | ||
| Basalt Fibers | ||
| Natural Fibers | ||
| By Form | Monofilament | |
| Multifilament | ||
| Chopped Fiber | ||
| Continuous Fiber | ||
| By End-Use Industry | Transportation Infrastructure | |
| Residential Construction | ||
| Commercial Construction | ||
| Industrial Construction | ||
| Mining and Tunneling | ||
| Oil and Gas | ||
| Water Infrastructure | ||
| Agriculture | ||
| Other End-Use Industries | ||
| By Geography | Asia-Pacific | China |
| India | ||
| Japan | ||
| South Korea | ||
| Rest of Asia-Pacific | ||
| North America | United States | |
| Canada | ||
| Mexico | ||
| Europe | Germany | |
| United Kingdom | ||
| France | ||
| Italy | ||
| Russia | ||
| Rest of Europe | ||
| South America | Brazil | |
| Argentina | ||
| Rest of South America | ||
| Middle-East and Africa | Saudi Arabia | |
| South Africa | ||
| Rest of Middle-East and Africa | ||


Key Questions Answered in the Report
What is the size of the concrete fiber market?
The concrete fiber market stands at USD 3.19 billion in 2026 and is forecast to reach USD 4.21 billion by 2031.
Which product type led the market demand in 2025?
Steel fibers held 44.51% share in 2025, supported by industrial flooring, tunneling, and heavy-duty pavement applications.
Which product type is projected to grow the fastest?
Basalt fibers are forecast to grow at a 7.44% CAGR through 2031 because of corrosion resistance and thermal stability.
What end-use industry is forecast to grow the fastest?
Water infrastructure is forecast to grow at a 6.68% CAGR through 2031, supported by resilience investment and technical requirements.
Page last updated on:


