
Commodity Trade Finance Market Size and Share
Market Overview
| Study Period | 2020 - 2031 |
|---|---|
| Market Size (2026) | USD 205.17 Billion |
| Market Size (2031) | USD 240.17 Billion |
| Growth Rate (2026 - 2031) | 3.20 % |
| Fastest Growing Market | Middle East and Africa |
| Largest Market | Asia-Pacific |
| Market Concentration | High |
Major Players *Disclaimer: Major Players sorted in no particular order Image © Mordor Intelligence. Reuse requires attribution under CC BY 4.0. | |
Commodity Trade Finance Market Analysis by Mordor Intelligence
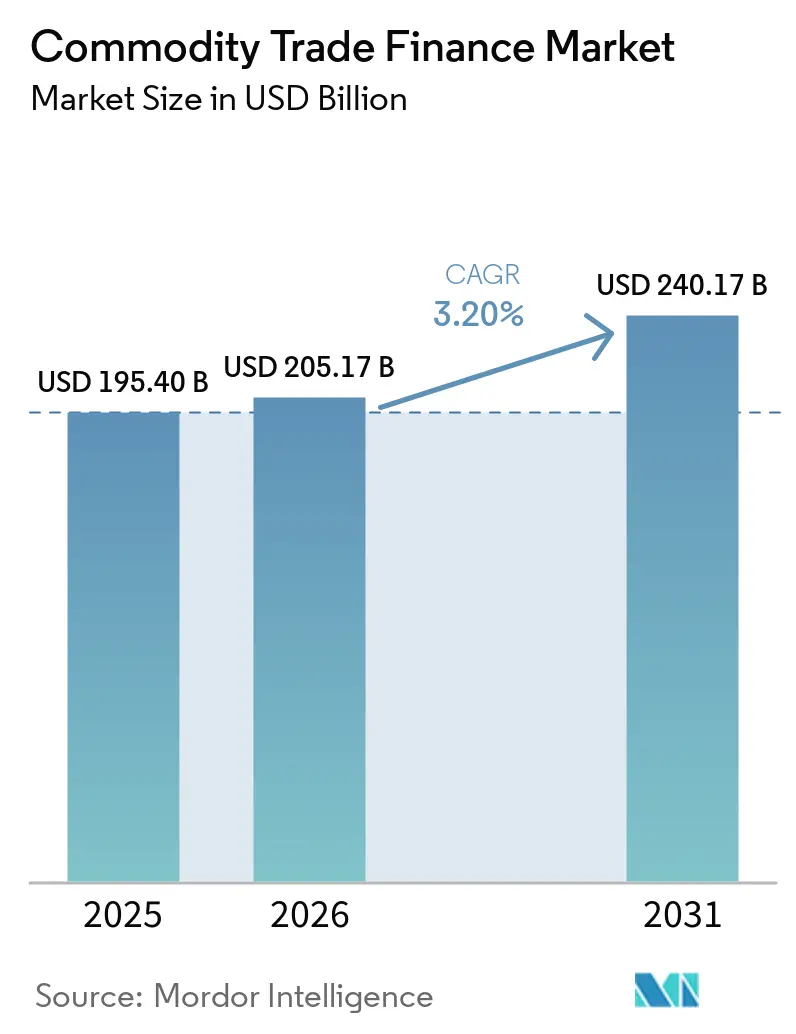
The Commodity Trade Finance Market size was valued at USD 195.40 billion in 2025 and is estimated to grow from USD 205.17 billion in 2026 to reach USD 240.17 billion by 2031, at a CAGR of 3.20% during the forecast period (2026-2031).
The commodity trade finance market is changing as larger facilities, receivables-based structures, and alternative capital providers gain importance. Supply-chain rerouting, sanctions, and energy-transition investment are creating financing needs that existing revolving facilities do not always cover. The trade finance gap remained USD 2.5 trillion in 2025, equal to 10% of global trade, showing the scale of unmet demand across trading firms. Electronic trade documents can reduce documentation delays and strengthen access for mid-tier originators, while banks continue to finance established corridors. The commodity trade finance market also faces higher collateral, funding, and compliance requirements, which favor providers with strong risk controls and cross-border capabilities.
Key Report Takeaways
- By financing products, transactional trade loans captured 32.2% of the commodity trade finance market share in 2025, while commodity receivables finance is projected to grow at a 5.5% CAGR through 2031.
- By commodity type, energy commodities captured 39.6% of the commodity trade finance market share in 2025, while metals & minerals are projected to grow at a 5.2% CAGR through 2031.
- By trade scope, cross-border transactions captured 78.8% of the commodity trade finance market share in 2025, while domestic and intra-national finance is projected to grow at a 4.8% CAGR through 2031.
- By provider, banks captured 86.3% of the commodity trade finance market share in 2025, while non-bank and private credit is projected to grow at a 6.2% CAGR through 2031.
- By facility event, refinance of an existing line captured 66.5% of the commodity trade finance market share in 2025, while new money is projected to grow at a 5.0% CAGR through 2031.
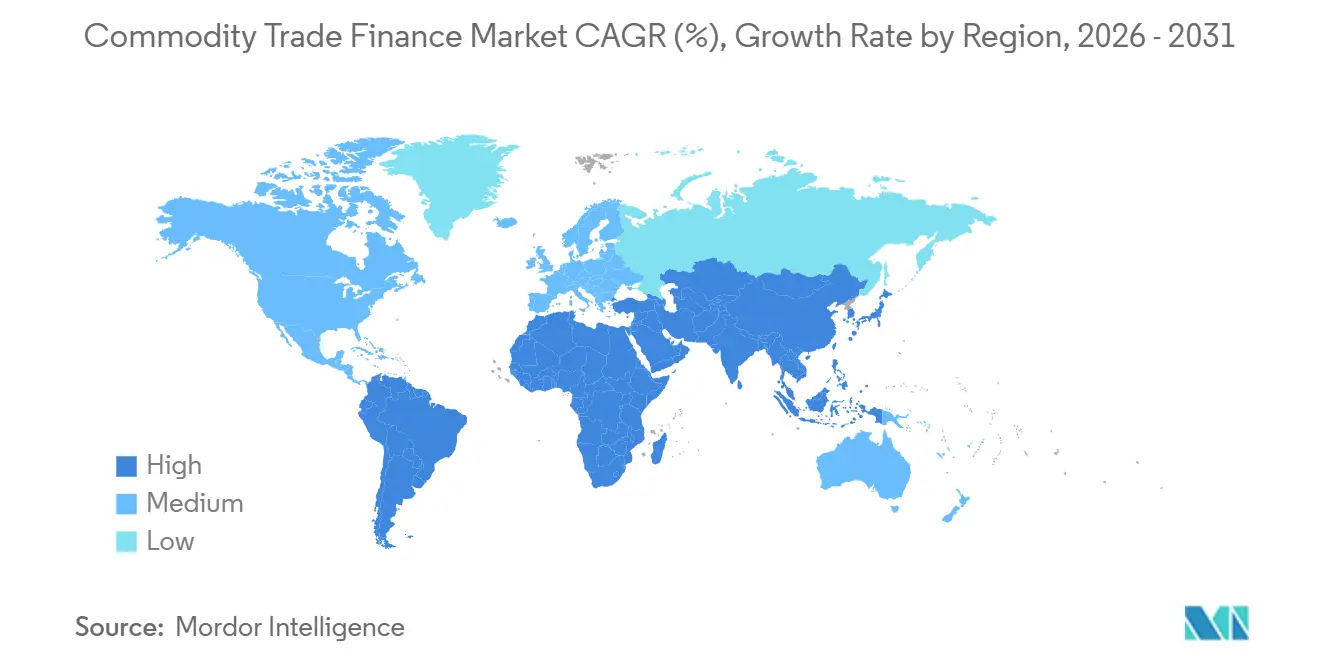
- By geography, Asia-Pacific captured 28.7% of the commodity trade finance market share in 2025, while the Middle East and Africa are projected to grow at a 4.5% CAGR through 2031.
Note: Market size and forecast figures in this report are generated using Mordor Intelligence’s proprietary estimation framework, updated with the latest available data and insights as of January 2026.
Global Commodity Trade Finance Market Trends and Insights
Drivers Impact Analysis*
| Driver | (~) % Impact on CAGR Forecast | Geographic Relevance | Impact Timeline |
|---|---|---|---|
| Growth in Cross-Border Energy, Metals, Agricultural, and Mineral Trade | +0.8% | Global, concentrated in Asia-Pacific, the Middle East and Africa, and Latin American export corridors | Short term (≤ 2 years) |
| Rising Pre-Shipment, In-Transit, and Inventory Financing Needs | +0.6% | Global, with high relevance in Southeast Asia, South Asia, and Sub-Saharan Africa | Short term (≤ 2 years) |
| Expansion of Critical-Mineral and Energy-Transition Supply Chains | +0.5% | North America, the European Union, the Asia-Pacific, and the Middle East and Africa origin markets | Medium term (2-4 years) |
| Structured and Receivables-Based Commodity Financing | +0.4% | Global, led by Europe and Asia-Pacific, with rising activity in the Middle East and Africa | Medium term (2-4 years) |
| Commodity SME and Midstream Trader Financing Demand | +0.3% | Sub-Saharan Africa, South and Southeast Asia, and Latin America | Medium term (2-4 years) |
| Digital Trade Documentation and Transaction Processing | +0.4% | Global, with early gains in Singapore, the United Kingdom, the Netherlands, the United Arab Emirates, and Australia | Long term (≥ 4 years) |
| Source: Mordor Intelligence | |||
Rising Financing Requirements Across Commodity Pre-Shipment, In-Transit, and Inventory Cycles
The physical commodity working-capital cycle has lengthened, increasing demand for pre-shipment, inventory, and transit financing. The Asian Development Bank (ADB) found that 80% of surveyed banks expected trade-finance demand to rise as companies diversify markets and adjust supply chains[1]. More than 76% of the surveyed banks provided pre-shipment finance, showing that financing demand extends beyond documentary credits. Higher commodity prices increase the absolute funding requirement for each cargo. This can constrain small and mid-sized traders that do not have access to syndicated facilities. The commodity trade finance market, therefore, continues to rely on structures that match financing to inventory and receivable cycles.
Expansion of Critical-Mineral and Energy-Transition Supply Chains
Critical mineral supply chains are expanding the need for longer-term and credit-enhanced financing. Western government public-finance commitments to critical minerals reached USD 65 billion in 2025, according to International Energy Agency data. In May 2026, the Export-Import Bank of Korea signed a USD 500 million agreement with the Asian Development Bank for critical minerals projects, and the Asian Development Bank targeted a USD 2 billion to USD 3 billion pool[2]. In July 2026, Standard Chartered arranged a EUR 514 million (USD 560.3 million) multi-export-credit-agency-backed green facility for Easpring Finland’s battery cathode plant. Traxys closed a USD 2 billion multicurrency revolving credit facility in July 2026, with commitments increased by 20 banks from 2025. These transactions show that lenders are supporting selected transition-metal and battery-material supply chains.
Increasing Adoption of Structured Commodity Finance and Receivables-Based Financing
Structured and receivables-based financing gives traders an alternative to conventional balance-sheet lending. Commodity receivables finance is projected to grow at a 5.5% CAGR through 2031, the highest rate among financing products. In May 2026, Glencore used FIS’s platform for a USD 2.55 billion trade receivables securitization program backed by 6 financial institutions[3]. The transaction showed that receivables structures can be used at an institutional scale in oil and gas. Such facilities can be useful when a borrower has identifiable receivables but seeks to preserve bank lines for other needs. This part of the commodity trade finance market is also relevant to private credit providers seeking shorter-duration, asset-backed exposures.
Digitalization of Commodity Trade Documentation and Transaction Processing
Digital documentation can shorten the time needed to review and transfer trade records. The International Trade Centre stated that full electronic bill-of-lading adoption could generate USD 6.5 billion in direct cost savings and support USD 30 billion to USD 40 billion in additional global trade. In January 2026, GSBN, IQAX, and ICE Digital Trade completed a cross-platform electronic bill-of-lading transaction involving banks in Thailand and China[4]. The Asian Development Bank found that 84% of banks used artificial intelligence for fraud prevention and risk analysis, while 57% were exploring its use to expand financing capacity. Digital systems can improve document control and compliance screening. They can also reduce friction for mid-tier firms entering the commodity trade finance market.
Commodity Price and Collateral-Value Volatility
Commodity price volatility can reduce the value of inventory that supports borrowing-base and warehouse facilities. A decline in collateral values can trigger margin calls when borrowers need liquidity the most. WTO and IFC analysis found that volatility and economic uncertainty reduced the availability of bank-led trade finance, particularly in developing regions. Lithium prices exhibited a 290% volatility premium over baseline industrial commodities. Lenders respond by implementing tighter collateral controls, warehouse inspections, and inventory monitoring. These measures can increase financing costs for smaller firms that lack their own logistics infrastructure.
Interest-Rate and Foreign-Exchange Exposure in Cross-Border Commodity Transactions
Interest-rate and foreign-exchange exposure can affect the cost and predictability of cross-border facilities. Funding-cost differences of up to 180 basis points between Western and Asian financing centers were reported in 2026. Commodity traders may earn revenue in one currency and repay a facility in another. That mismatch can increase cash-flow pressure during volatile exchange-rate periods. Banks may require hedging arrangements, stronger covenants, or higher pricing to manage this risk. These conditions can limit access to financing for smaller importers and exporters.
*Our forecasts treat driver/restraint impacts as directional, not additive. The impact forecasts reflect baseline growth, mix effects, and variable interactions.
Segment Analysis
By Financing Product: Receivables Structures Gain Ground on Transactional Loans
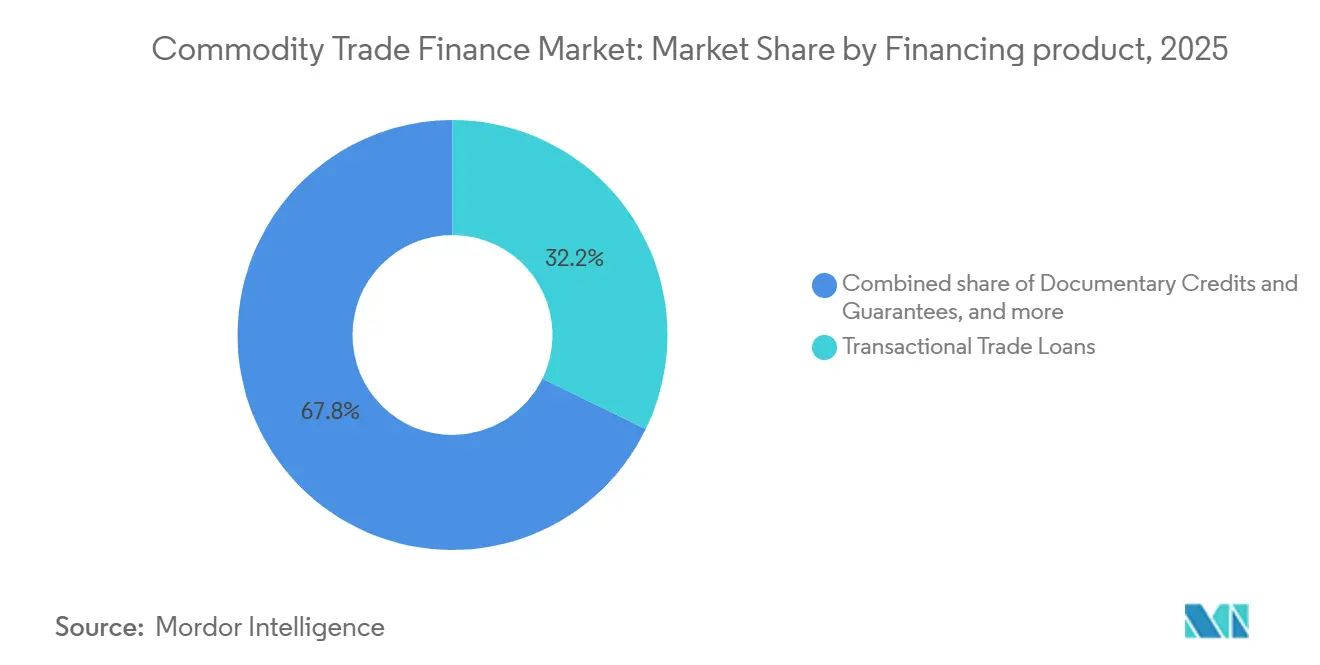
Transactional trade loans held 32.2% of financing-product activity in 2025. Their collateral-secured design and broad bank familiarity support use in oil and metals corridors. Documentary credits and guarantees remain relevant for first-time or lower-rated counterparties in Africa and South Asia. Pre-export and pre-payment finance serve producer-facing deals that need funding before shipment. Borrowing-base, warehouse, and inventory finance support facilities are tied to physical goods and controlled storage.
Commodity receivables finance is forecast to grow at a 5.5% CAGR through 2031. Glencore’s USD 2.55 billion oil-and-gas receivables securitization in May 2026 demonstrated the scale that these facilities can reach. Six financial institutions backed the program through FIS’s Supply Chain Finance Platform. Receivables finance can release cash tied up in completed sales. It also gives borrowers another funding route when traditional bank capacity is limited.
By Commodity Type: Energy Leads, but Metals and Minerals Drive Forward Momentum
Energy commodities captured 39.6% of commodity-type activity in 2025. Crude oil, liquefied natural gas, and refined-product trade generate high transaction values and recurring financing needs. Specialist banks have established networks for these flows. Agricultural commodities remain important in South American soybean and corn corridors. They also support Southeast Asian palm-oil supply chains.
Metals & minerals are forecast to grow at a 5.2% CAGR through 2031. Demand for lithium, cobalt, nickel, and copper is supporting financing needs across battery and energy-infrastructure supply chains. Traxys closed a USD 2 billion multicurrency facility in July 2026, which was expanded by USD 185 million. Mercuria closed a USD 3.84 billion multicurrency facility in June 2026, an increase of USD 340 million. Public-finance commitments to critical minerals reached USD 65 billion in 2025, according to International Energy Agency data.
By Trade Scope: Cross-Border Dominance with Domestic Growth Acceleration
Cross-border transactions held 78.8% of trade-scope activity in 2025. Physical commodities commonly move through multiple countries, currencies, and legal systems. This complexity supports demand for bank-led instruments and specialist structured finance. Cross-border arrangements often require compliance screening and document coordination across several parties. These needs reinforce the role of experienced trade-finance providers.
Domestic and intra-national finance is projected to grow at a 4.8% CAGR through 2031. Indonesia, India, and Brazil are important domestic-growth countries as commodity small and medium-sized enterprises move from informal credit to structured finance. In July 2026, CITIC Bank promoted a cross-border commodity financial-services initiative at China’s Hainan Free Trade Port. The initiative illustrates how domestic free-trade frameworks can support international funding arrangements. The African Continental Free Trade Area and PAPSS payment infrastructure could support comparable financing activity for African agricultural and mineral flows.
By Provider: Banks Lead but Non-Bank Capital Is Reshaping Supply
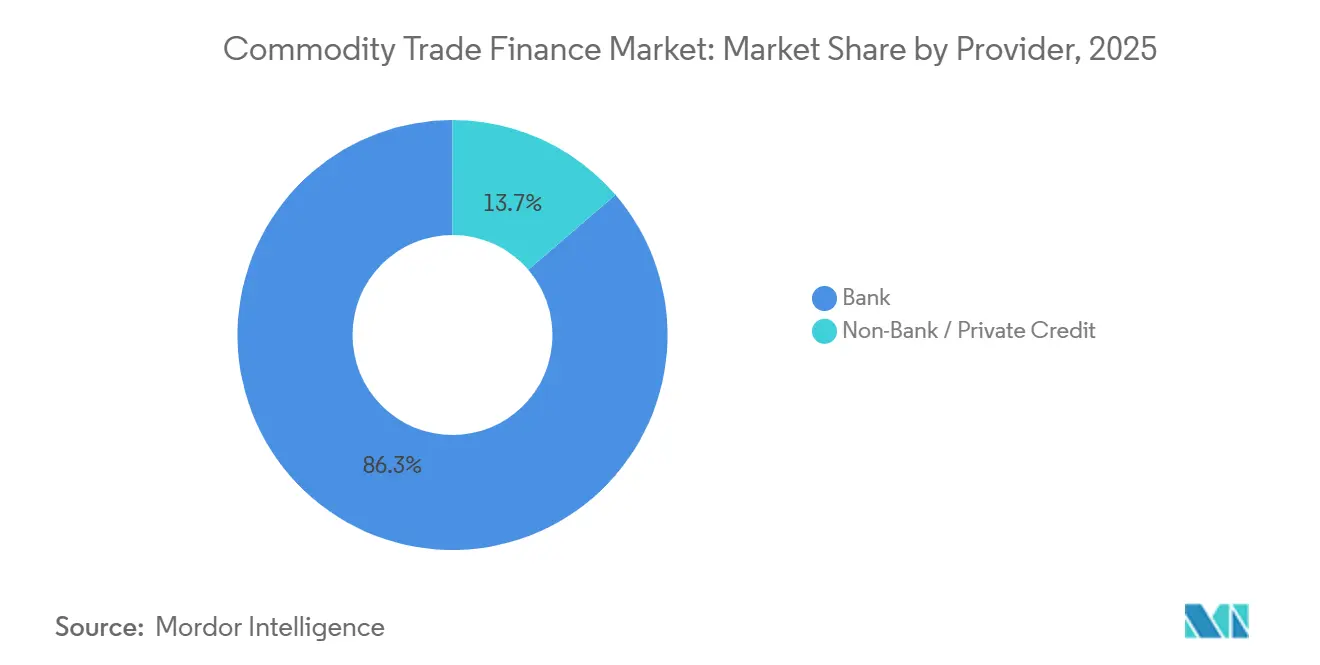
Banks captured 86.3% of provider activity in 2025. Correspondent networks, documentary credit systems, and long-standing regulatory relationships support their position. Bank facilities remain central to large and established commodity corridors. Basel IV requirements are raising the effective cost of holding some trade assets on bank balance sheets. This can encourage banks to distribute selected assets to other capital providers.
Non-bank and private credit are projected to grow at a 6.2% CAGR through 2031. Morgan Stanley data showed that private credit grew from USD 2 trillion to USD 3 trillion since 2020 and is projected to reach USD 5 trillion by 2029. Non-bank vehicles can offer shorter-duration and asset-backed facilities where banks face capital constraints. The commodity trade finance industry is therefore moving toward a more distributed provider model.
By Facility Event: Refinancing Dominates but New Money Signals Expansion
Refinancing an existing line captured 66.5% of facility event volume in 2025. Rolling working capital facilities are common because they support recurring purchases, shipments, and receivable collections. Established structures can provide predictable collateral performance for lenders. Banks also have an incentive to retain creditworthy borrowers as capital rules become more demanding. This keeps refinancing central to the commodity trade finance market.
New money is projected to grow at a 5.0% CAGR from 2026 to 2031. Junior miners, mid-tier processing facilities, and midstream traders can require first-draw facilities outside the refinancing base. The Afreximbank and Development Bank of Southern Africa master risk participation agreement, signed in February 2026, targeted working-capital-intensive critical-mineral value chains. Its focus included equipment imports, processing inputs, inventory cycles, and the cross-border movement of intermediate goods. New facilities can expand activity in Middle Eastern and African export corridors.
Geography Analysis
Asia-Pacific captured 28.7% of the commodity trade finance market size in 2025. The region benefits from large commodity import volumes, export manufacturing, and deep correspondent banking networks. Singapore, Hong Kong, and Mumbai remain important financing centers for these activities. Asia-Pacific structured commodity finance volumes rose 23% year over year through the second quarter of 2026, according to JPMorgan Chase. The Asian Development Bank supported USD 5.7 billion in trade through nearly 300 partner banks in 2025.
North America and Europe hold large but slower-growing positions in the commodity trade finance market. North America benefits from energy, agricultural, and critical mineral export flows. Europe faces higher balance sheet costs as European Union capital rules take effect, encouraging banks, including BNP Paribas, Deutsche Bank, and ING, to distribute selected trade assets to institutional investors. South America remains strategically important through Brazil and Argentina’s soybean, corn, and beef export corridors.
The Middle East and Africa are projected to grow at a 4.5% CAGR from 2026 to 2031. Dubai, Abu Dhabi, and Bahrain are consolidating commodity volumes on Asia-Europe trade routes. Middle Eastern trade finance infrastructure grew 34% from 2024 to mid-2026. The International Islamic Trade Finance Corporation has a USD 1.5 billion Egypt commodity finance program for 2026, including USD 700 million for food commodities and USD 800 million for petroleum. Africa’s trade finance gap averaged USD 74 billion from 2021 to 2024, according to the African Development Bank.
Competitive Landscape
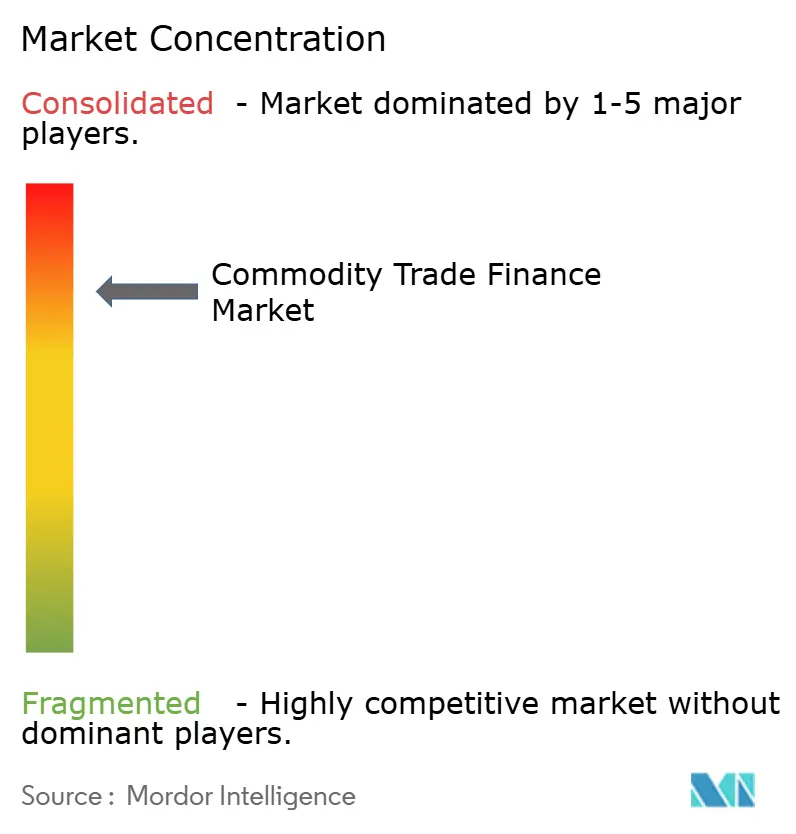
The commodity trade finance market is consolidated. HSBC, BNP Paribas, Standard Chartered, JPMorgan Chase, and Citigroup form the leading international bank group. ICBC, DBS, MUFG, and First Abu Dhabi Bank hold strong positions in their domestic and regional trade corridors. Competition for high-quality commodity borrowers is increasing, as Traxys’ USD 2 billion facility attracted higher commitments from 20 banks in July 2026 than in 2025.
Technology capabilities are becoming increasingly important for competitive execution. Crédit Agricole CIB used SECRO blockchain technology for an energy-sector commercial transaction in 2025. FIS’s platform supported Glencore’s USD 2.55 billion receivables securitization in May 2026. Standard Chartered also arranged a EUR 514 million (USD 560.3 million) facility for Easpring Finland in July 2026. These developments demonstrate that providers are combining capital capacity with digital execution and supply chain controls.
Opportunities remain in financing for small and mid-sized commodity exporters, African and frontier-market liquidity, and junior critical-mineral producers. Africa’s USD 74 billion trade finance gap highlights a persistent financing need. Private credit funds, specialist asset managers, and technology-enabled originators are addressing part of this demand. Compliance screening and sanctions monitoring are essential capabilities for providers active in cross-border trade.
Commodity Trade Finance Industry Leaders
-
BNP Paribas
-
HSBC Holdings plc
-
Standard Chartered PLC
-
JPMorgan Chase & Co.
-
Citigroup Inc.
- *Disclaimer: Major Players sorted in no particular order
Recent Industry Developments
- August 2026: POSCO International signed a memorandum of understanding with POSCO Flow, ZIM, Hana Bank, KTNET, and Taeoung Logistics to launch an e-B/L consortium that supports the issuing and trading of electronic bills of lading and an e-Nego system for digital trade-finance procedures.
- July 2026: Gerald Group closed an inaugural USD 50 million, 3-year facility supported by Etihad Credit Insurance and provided by Abu Dhabi Commercial Bank for energy-transition and technology-metals trade flows.
- July 2026: Standard Chartered arranged a EUR 514 million (USD 560.3 million) multi-export-credit-agency-backed green financing facility for Easpring Finland’s lithium-ion battery cathode plant in Kotka.
- June 2026: JPMorgan signed a USD 250 million MIGA-backed trade-finance facility with VakıfBank to finance recyclable steel scrap and renewable-energy imports.
Global Commodity Trade Finance Market Report Scope
| Documentary Credits and Guarantees |
| Transactional Trade Loans |
| Pre-Export and Pre-Payment Finance (PXF / PPF) |
| Borrowing-Base, Warehouse, and Inventory Finance |
| Commodity Receivables Finance |
| Energy Commodities |
| Metals & Minerals |
| Agricultural Commodities |
| Chemicals & Fertilizers |
| Forest Products |
| Cross-Border |
| Domestic / Intra-National |
| Bank |
| Non-Bank / Private Credit |
| New Money |
| Refinance of an Existing Line |
| North America | United States |
| Canada | |
| Mexico | |
| South America | Brazil |
| Argentina | |
| Rest of South America | |
| Europe | United Kingdom |
| Germany | |
| France | |
| Italy | |
| Spain | |
| Rest of Europe | |
| Asia-Pacific | China |
| Japan | |
| India | |
| South Korea | |
| Australia | |
| Indonesia | |
| Thailand | |
| Malaysia | |
| Singapore | |
| Vietnam | |
| Rest of Asia-Pacific | |
| Middle East and Africa | Saudi Arabia |
| United Arab Emirates | |
| Turkey | |
| South Africa | |
| Egypt | |
| Rest of Middle East and Africa |
| By Financing Product | Documentary Credits and Guarantees | |
| Transactional Trade Loans | ||
| Pre-Export and Pre-Payment Finance (PXF / PPF) | ||
| Borrowing-Base, Warehouse, and Inventory Finance | ||
| Commodity Receivables Finance | ||
| By Commodity Type | Energy Commodities | |
| Metals & Minerals | ||
| Agricultural Commodities | ||
| Chemicals & Fertilizers | ||
| Forest Products | ||
| By Trade Scope | Cross-Border | |
| Domestic / Intra-National | ||
| By Provider | Bank | |
| Non-Bank / Private Credit | ||
| By Facility Event | New Money | |
| Refinance of an Existing Line | ||
| By Geography | North America | United States |
| Canada | ||
| Mexico | ||
| South America | Brazil | |
| Argentina | ||
| Rest of South America | ||
| Europe | United Kingdom | |
| Germany | ||
| France | ||
| Italy | ||
| Spain | ||
| Rest of Europe | ||
| Asia-Pacific | China | |
| Japan | ||
| India | ||
| South Korea | ||
| Australia | ||
| Indonesia | ||
| Thailand | ||
| Malaysia | ||
| Singapore | ||
| Vietnam | ||
| Rest of Asia-Pacific | ||
| Middle East and Africa | Saudi Arabia | |
| United Arab Emirates | ||
| Turkey | ||
| South Africa | ||
| Egypt | ||
| Rest of Middle East and Africa | ||
Key Questions Answered in the Report
What is the forecast growth rate for commodity trade finance?
The commodity trade finance market is forecast to grow at a 3.2% CAGR from 2026 to 2031, reaching USD 240.2 billion in 2031.
Which financing product is growing fastest?
Commodity Receivables Finance is the fastest-growing financing product, with a projected CAGR of 5.5% through 2031.
Which commodity category holds the largest position?
Energy Commodities held 39.6% in 2025, supported by crude oil, liquefied natural gas, and refined-product trade flows.
Why are non-bank providers gaining relevance?
Non-Bank and Private Credit is projected to grow at a 6.2% CAGR as capital rules encourage wider distribution of trade assets.
Which region is growing fastest?
The Middle East and Africa is forecast to grow at a 4.5% CAGR through 2031, supported by commodity corridors and institutional programs.
What risks affect commodity financing?
Main risks include commodity-price volatility, foreign-exchange exposure, collateral fraud, and expanding sanctions and trade-based money-laundering controls.