
Cloud OTT Market Size and Share
Market Overview
| Study Period | 2020 - 2031 |
|---|---|
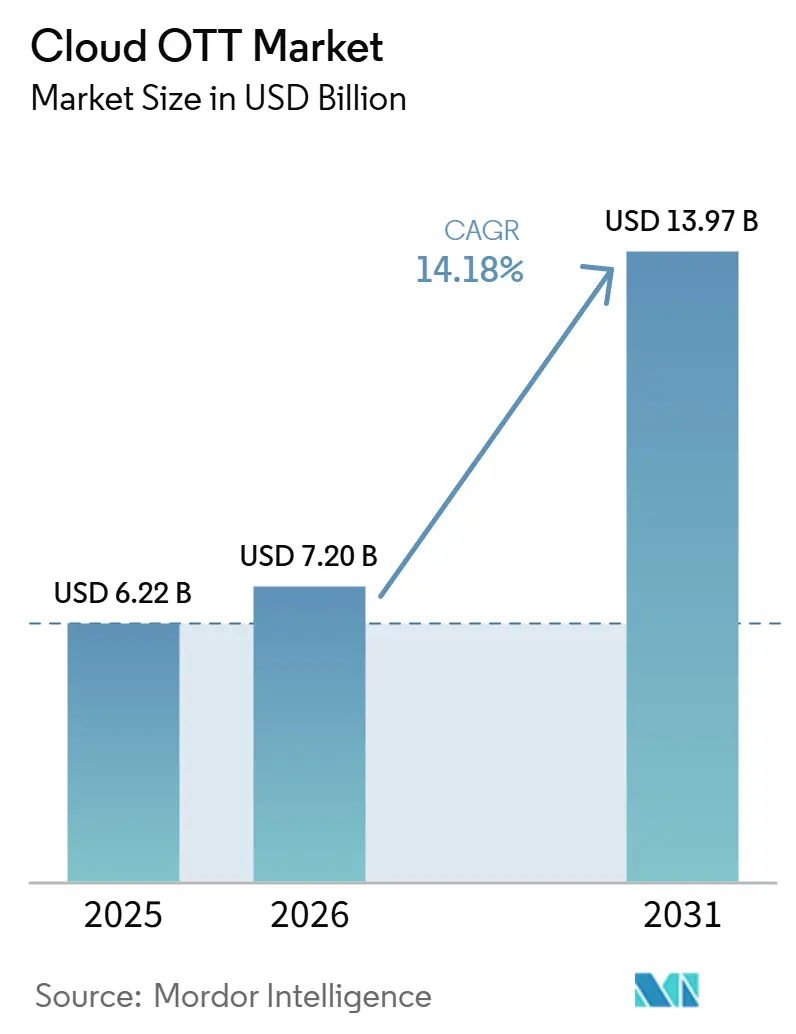
| Market Size (2026) | USD 7.20 Billion |
| Market Size (2031) | USD 13.97 Billion |
| Growth Rate (2026 - 2031) | 14.18 % |
| Fastest Growing Market | Asia-Pacific |
| Largest Market | North America |
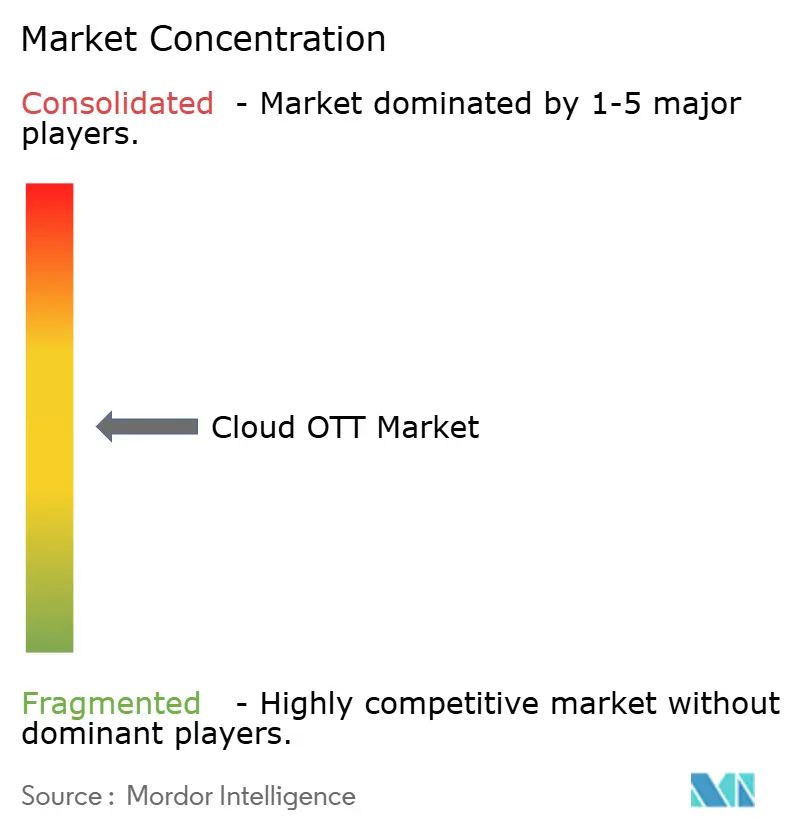
| Market Concentration | Medium |
Major Players *Disclaimer: Major Players sorted in no particular order Image © Mordor Intelligence. Reuse requires attribution under CC BY 4.0. | |
Cloud OTT Market Analysis by Mordor Intelligence
The Cloud OTT market size is projected to expand from USD 6.22 billion in 2025 and USD 7.10 billion in 2026 to USD 13.97 billion by 2031, registering a CAGR of 14.18% between 2026 and 2031. Growth reflects the replacement of on-premises broadcast systems by cloud-based workflows among broadcasters, telecom operators, and direct-to-consumer platforms. These users can reduce upfront infrastructure spending while improving the reliability and flexibility of video delivery. Dedicated media capabilities from large cloud providers and AI-assisted platform operations are shortening the time needed to prepare live events. The Cloud OTT market also benefits from advertising tools, audience segmentation, and content packaging that are difficult to support with older playout systems. Competition is moving toward application capabilities such as content discovery, metadata management, and advertising technology, which may favor well-funded platforms with broader product portfolios.
Key Report Takeaways
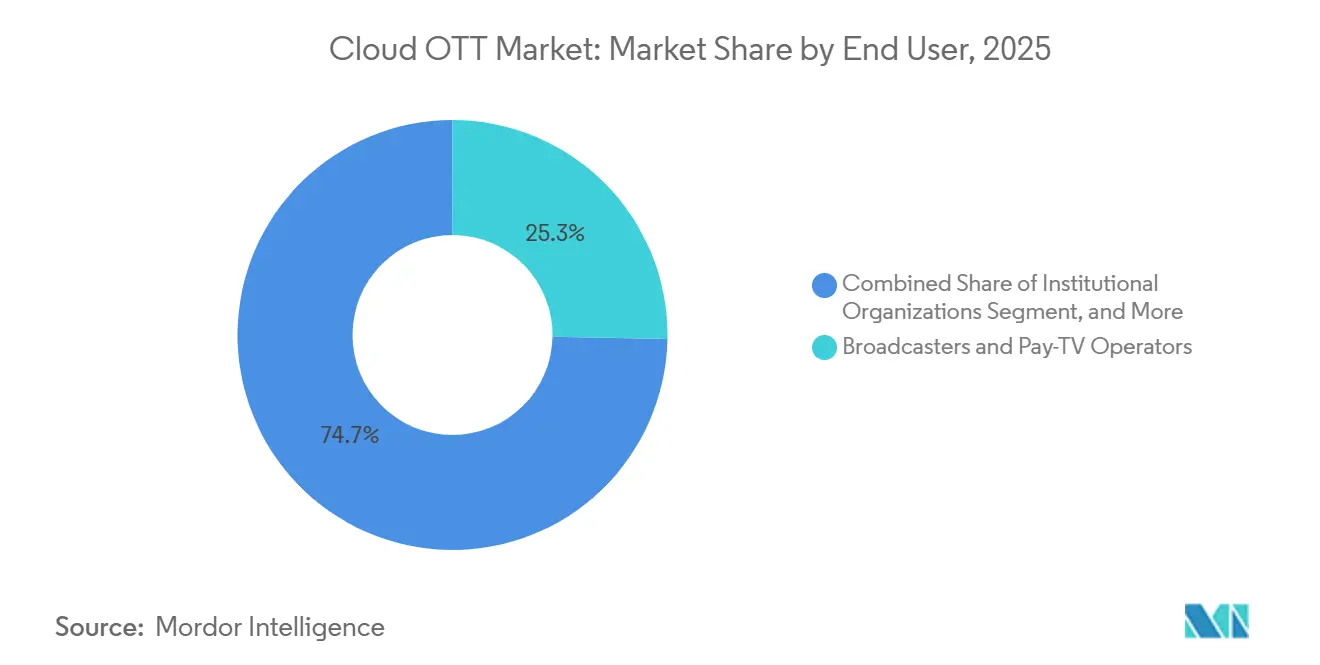
- By end user, Broadcasters and Pay-TV Operators held 25.29% of the Cloud OTT market share in 2025, while Enterprises and Institutional Organizations are projected to expand at a 14.91% CAGR through 2031.
- By vertical, Media and Entertainment accounted for 50.54% of the Cloud OTT market size in 2025, while E-Learning and Education is expected to grow at a 14.78% CAGR through 2031.
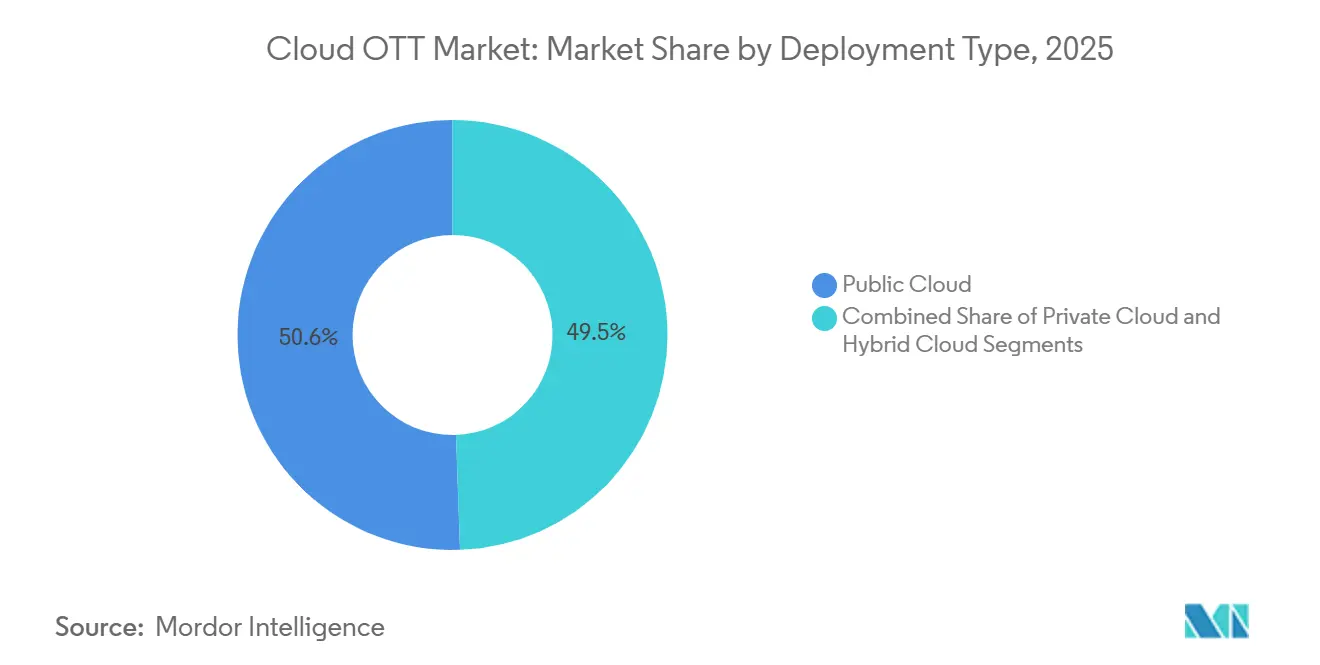
- By deployment type, Public Cloud captured 50.55% revenue share in 2025, and the same segment is expected to grow at 14.85% CAGR through 2031 in the Cloud OTT market.
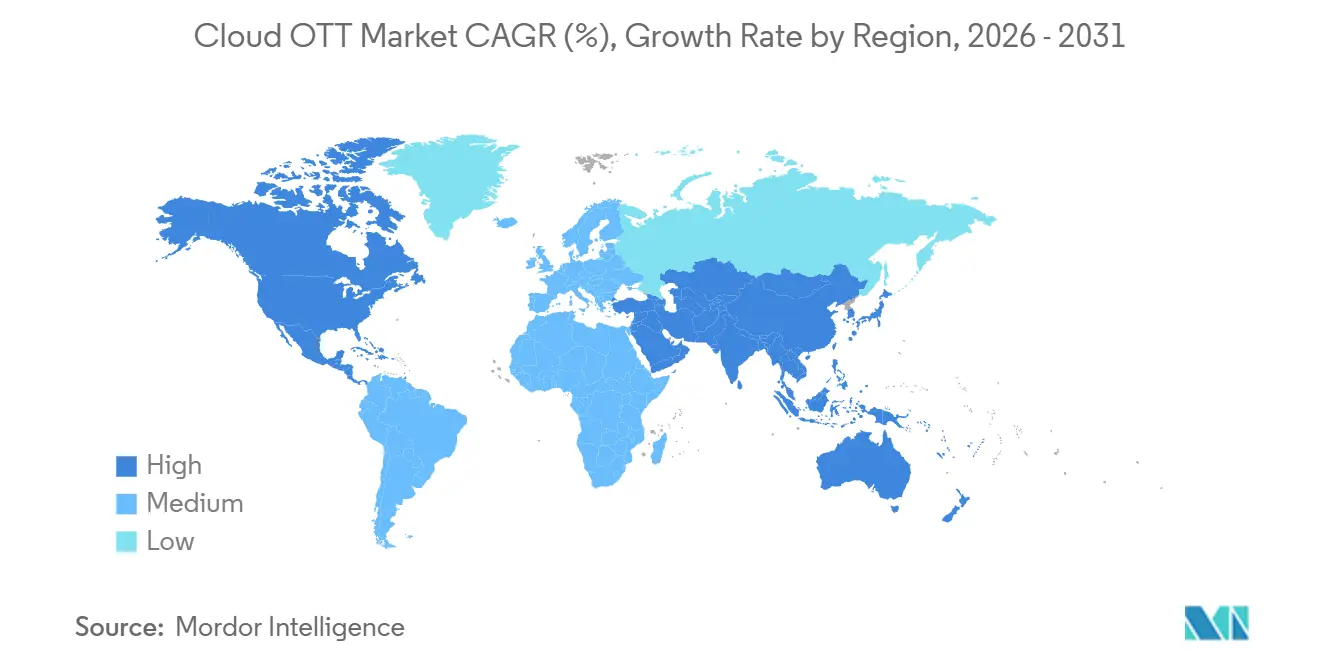
- By geography, North America held 45.50% revenue share in 2025, while Asia-Pacific is projected to advance at a 15.01% CAGR through 2031.
Note: Market size and forecast figures in this report are generated using Mordor Intelligence’s proprietary estimation framework, updated with the latest available data and insights as of January 2026.
Market Trends and Insights
Drivers Impact Analysis of Cloud OTT Market*
| Driver | (~) % Impact on CAGR Forecast | Geographic Relevance | Impact Timeline |
|---|---|---|---|
| High-Speed Broadband, Fiber, and 5G Expansion | +3.0% | Global, with concentrated impact in Asia-Pacific, North America, and GCC | Short term (≤ 2 years) |
| Cloud-Native OTT Workflow Adoption | +2.8% | Global, strongest in North America and Western Europe | Medium term (2-4 years) |
| Live Sports, FAST, and Event Streaming Migration | +2.5% | North America and Europe leading, South America and Asia-Pacific accelerating | Short term (≤ 2 years) |
| AI-Enabled Personalization, Localization, and Ad Yield Optimization | +2.2% | Global, with Asia-Pacific and North America as primary innovation hubs | Medium term (2-4 years) |
| Telco, CTV, and Pay-TV Cloud Transformation | +1.8% | North America and Europe, with spillover to Southeast Asia and Middle East and Africa | Medium term (2-4 years) |
| Regionalized Cloud Media Zones for Sovereign and Low-Latency Delivery | +1.5% | Europe, Middle East, and Asia-Pacific national markets | Long term (≥ 4 years) |
| Source: Mordor Intelligence | |||
High-Speed Broadband, Fiber, and 5G Expansion
Global 5G subscriptions exceeded 3.1 billion in the first quarter of 2026 and are forecast to reach 6.4 billion by the end of 2031.[1]Ericsson, “Ericsson Mobility Report June 2026,” Ericsson, gsacom.com. Ericsson reported that 5G carried 48% of global mobile data traffic by the end of 2025, with this share expected to reach 85% by 2031. This wider high-bandwidth base supports the Cloud OTT market because it improves the delivery of high-resolution live and on-demand video. Ericsson also found that 43 of 55 operators had faster uplink than downlink traffic growth in 2025, which supports contribution and content-ingest workflows. Fixed wireless access based on 5G accounted for 71% of global fixed wireless access providers by mid-2026, extending broadband-like access to audiences outside dense urban areas. National spectrum and broadband programs can therefore expand the audience available to cloud-based video services without requiring platforms to build last-mile networks.
Cloud-Native OTT Workflow Adoption
Broadcasters and media operators are replacing legacy playout equipment with software-based cloud workflows. Change management has become a more important constraint than capital availability for many migration programs. Public cloud systems can now support live channel operations using microservices, containers, and API-based orchestration. Amagi stated that its CLOUDPORT platform introduced more than 250 features in FY 2025-26 and supported more than 100 concurrent feeds with 200-player multi-AZ redundancy in one tenant.[2]Amagi, “Amagi Releases June 2026 AIRTIME Report: FAST Viewing Hours Grow 55% YoY as Metadata Friction Escalates,” Amagi Newsroom, amagi.com. The company also reported that its monitoring suite had prevented more than 80% of potential operational disruptions since its late-2025 launch. This shift allows the Cloud OTT market to support new channels and services through configuration rather than long hardware procurement cycles.
Live Sports, FAST, and Event Streaming Migration
Live sports is driving infrastructure decisions because major events require dependable delivery at very large scale. DAZN used M2A Media and AWS cloud-native infrastructure, including AWS Elemental Media Services, for the 2025 FIFA Club World Cup. The deployment showed that contribution, transcoding, packaging, and multi-CDN delivery could operate in public cloud environments for a month-long global event. Global FAST viewing hours rose 55% year over year during April through June 2026, while South America recorded 190% growth and the Kids category rose 191%. Global FAST advertising impressions increased 53% over the same period, and North America and Canada generated 74% of those impressions. Amagi also reported that 86% of surveyed senior FAST practitioners experienced financial losses from poor metadata, increasing demand for metadata tools within the Cloud OTT market.
AI-Enabled Personalization, Localization, and Ad Yield Optimization
AI functions are becoming part of the operating model for cloud video platforms rather than an optional feature. AWS reports that personalization and engagement optimization can reduce churn by up to 30% for subscription-based OTT services. Session behavior can inform advertising decisions, since viewers who complete 70% or more of selected content show lower churn risk. Netflix reported that nearly 50% of its non-live advertising inventory moved programmatically, while its active advertiser base exceeded 4,000 companies after growing 70% year over year. Brightcove's 2026 roadmap included scene-level contextual advertising and sentiment-aware ad-break detection.[3]Brightcove, “Brightcove Doubles Down on AI and Customer Experience - 2026 Roadmap,” Brightcove Pressroom, brightcove.com. These capabilities can bring advertising yield, retention, localization, and programming decisions into a more connected workflow for the Cloud OTT market. This gives Cloud OTT market operators a clearer basis for aligning content, advertising, and retention activity.
Restraints Impact Analysis of Cloud OTT Market*
| Restraint | (~) % Impact on CAGR Forecast | Geographic Relevance | Impact Timeline |
|---|---|---|---|
| Content Rights, Production, and Cloud Delivery Cost Pressure | -2.0% | Global, most acute in North America and Western Europe | Short term (≤ 2 years) |
| Piracy, Credential Abuse, and Content Protection Losses | -1.8% | Global, disproportionately impactful in Europe, South America, and Southeast Asia | Short term (≤ 2 years) |
| Data Sovereignty, Privacy, and Cross-Border Compliance Complexity | -1.5% | Europe, India, Indonesia, Saudi Arabia, Turkey | Medium term (2-4 years) |
| Egress Economics, Peak-Capacity Volatility, and Vendor Lock-In | -1.2% | Global, most acute for operators with high-bitrate live event portfolios | Long term (≥ 4 years) |
| Source: Mordor Intelligence | |||
Content Rights, Production, and Cloud Delivery Cost Pressure
Cloud workflow efficiencies do not remove the cost pressure created by premium content rights and live delivery requirements. Sports services face combined expenses for rights, multi-CDN egress, and multi-format encoding. These costs can limit the operating benefits that platforms expect from consumption-based cloud infrastructure. Localization adds another expense through dubbing, captioning, and territory-specific rights clearance. Accessibility obligations in Europe and Canada can place these requirements in product budgets rather than treating them as optional additions. Platforms that do not include localization capabilities in their Cloud OTT market planning may face later compliance spending that affects margin objectives.
Piracy, Credential Abuse, and Content Protection Losses
Piracy has shifted from basic unauthorized rebroadcasting toward credential abuse that uses valid subscription accounts. This risk can reduce expected subscription growth where account sharing and enforcement gaps persist. Content protection therefore remains important even for platforms with advanced cloud delivery systems. Multi-DRM systems based on Widevine, PlayReady, and FairPlay remain standard components of premium streaming deployments. Forensic watermarking and token-bound session management are being added to strengthen account and session controls. The Cloud OTT market must address these controls at the infrastructure level because protection failures can affect revenue, subscriber confidence, and content-owner relationships.
*Our forecasts treat driver/restraint impacts as directional, not additive. The impact forecasts reflect baseline growth, mix effects, and variable interactions.
Cloud OTT Market Segment Analysis
By End User:
Broadcaster Leadership and Rising Enterprise DemandBroadcasters and Pay-TV Operators held 25.29% of end-user revenue in 2025, making them the largest end-user group. Their spending reflects the movement of legacy linear television systems to cloud-based playout, transcoding, and distribution. These operators are replacing transmission chains with CDN-based delivery and are adding server-side advertising to linear workflows. They are also connecting pay-TV and streaming back-office systems. Telecom Operators and Internet Service Providers form another important customer group for the Cloud OTT market. They use video services with broadband bundles to reduce customer churn and increase average revenue per user. This approach lets Cloud OTT market operators add content value without necessarily purchasing more rights. It also links the quality of broadband services more closely to video-service retention.
Enterprises and Institutional Organizations are projected to record the highest end-user CAGR at 14.91% from 2026 to 2031. Internal communications, hybrid events, and customer video experiences are moving onto enterprise video systems. Pure-play OTT and direct-to-consumer providers remain major cloud users because they operate with lean infrastructure models. Content owners, studios, and digital media companies are adopting cloud media asset management and rights-aware delivery tools. Kaltura was recognized as a Representative Vendor in the 2026 Gartner Market Guide for Video Platform Services. The company stated that it held ISO/IEC 42001 certification, which brings AI management expectations into enterprise procurement. The Cloud OTT industry is therefore serving both consumer video distribution and institutional video requirements through similar core infrastructure. Enterprise demand also increases the importance of security, compliance, and content governance.



By Vertical:
Media and Entertainment Scale and Education GrowthMedia and Entertainment represented 50.54% of vertical revenue in 2025 and remained the largest source of demand. Streaming services, broadcast networks, and sports rights holders are major buyers of media cloud infrastructure. Their workloads require reliable encoding, packaging, advertising, and distribution at scale. The Cloud OTT market supports both linear and on-demand operations in this vertical. Media companies also require tools that can handle changing traffic volumes and multiple content formats. Their use of cloud systems supports the wider movement away from fixed broadcast equipment. This concentration helps explain the importance of live-event performance and advertising features in vendor product plans. It also leaves providers exposed to the operating pressures facing premium content services.
E-Learning and Education is expected to be the fastest-growing vertical, with a 14.78% CAGR from 2026 to 2031. Higher education, corporate training, and certification providers are standardizing on more robust video infrastructure. Their requirements increasingly include live delivery, interactivity, searchable video, and controlled access through Cloud OTT market platforms. Healthcare and Life Sciences, BFSI, and government users face compliance obligations, but sovereign cloud zones are helping address data-residency concerns. HIPAA-related requirements in healthcare and DORA-related requirements in financial services can affect procurement criteria. Retail and E-commerce users are applying cloud video to shoppable content, live commerce, and product demonstrations. IT and Telecommunication organizations are consolidating internal and external video services on shared cloud platforms. These uses broaden the Cloud OTT industry beyond traditional entertainment applications.
By Deployment Type:
Public Cloud Leads While Hybrid Models ExpandPublic Cloud held 50.55% of deployment revenue in 2025, the highest share among deployment models. AWS Elemental Media Services, Google Cloud Media CDN, and Azure Media Services provide encoding, packaging, and delivery functions that support fast service launches. Public cloud pricing is especially useful for services with unpredictable traffic and major peak-viewing periods. These customers can avoid investing in infrastructure sized for rare demand spikes. Amazon Web Services reported USD 37.6 billion in cloud revenue in the first quarter of 2026, up 28% year over year. Microsoft Azure grew 40%, while Google Cloud grew 63% to USD 20.0 billion during the same period. These large cloud ecosystems form much of the technical base used by the Cloud OTT market.
Private Cloud remains relevant for operators with fixed content libraries, data-residency obligations, or data-center investments that have not been fully depreciated. Hybrid Cloud is gaining adoption among broadcasters that keep live-event ingest and contribution systems on premises while moving transcoding and distribution to public cloud. This design can preserve operational control while using cloud capacity for variable workloads. Harmonic announced AI and cloud enhancements for hybrid streaming in April 2026, including Model Context Protocol integration and cloud-native deployment on Red Hat OpenShift. The announcement showed how vendors are connecting on-premises processing with cloud distribution. Proposed European cloud sovereignty tiers may further influence public-sector and enterprise procurement in Europe. These developments can sustain demand for private and hybrid systems even as public cloud remains the leading deployment option.
Geography Analysis
North America Cloud OTT Market
North America held 45.50% of global revenue in 2025 and remained the largest regional contributor. The region has a high concentration of streaming-native services, sports rights holders, and cloud infrastructure providers. These factors reduce adoption barriers for video platforms moving to cloud-based systems in the Cloud OTT market. The United States also has a developed FAST advertising environment. North America and Canada produced 74% of global FAST advertising impressions during April through June 2026. This concentration supports demand for advertising, metadata, and delivery functions in the Cloud OTT market.
Europe Cloud OTT Market
Europe is the second-largest regional market, led by Germany, the United Kingdom, and France. Public broadcasters and pay-TV operators in these countries are moving more video workflows into cloud environments. The EU Data Act entered full application in September 2025 and introduced portability and switching requirements for cloud service providers. These requirements influence vendor selection for operators that need data sovereignty assurances. France, Germany, and Nordic countries are also developing sovereign cloud frameworks. Russia remains less connected to Western cloud providers. These conditions can support European vendors in some government and public-sector deployments.
APAC, South America and MEA Cloud OTT Market
Asia-Pacific is forecast to grow at a 15.01% CAGR from 2026 to 2031, the fastest regional rate. Higher 5G density in India, South Korea, and Japan supports mobile-first video consumption. These markets have developed video habits that are less dependent on traditional pay-TV systems. Japan is expected to contribute through average revenue per user improvements and sports-led service differentiation. India is expected to contribute through user growth and greater adoption of advertising-supported services. South America recorded 190% growth in FAST viewing hours during April through June 2026, indicating strong interest in lower-cost ad-supported video. Saudi Arabia and the United Arab Emirates have data-protection rules that encourage regional media deployment rather than routing all traffic through overseas locations. Africa remains at an earlier infrastructure stage, with mobile broadband expansion and lower device costs supporting future audience growth.

Competitive Landscape
The Cloud OTT market is moderately concentrated in cloud infrastructure and fragmented in platform applications. AWS, Microsoft, and Google provide much of the underlying capacity used by OTT services. Their media products include encoding, packaging, CDN, and delivery tools that support the Cloud OTT market. These capabilities make the cloud providers both key suppliers and competitive threats to specialist platforms. Specialist vendors in the Cloud OTT market compete through workflow management, AI functions, and vertical expertise. Infrastructure price alone is not sufficient to distinguish many platform offerings. The result is a competitive environment in which integration depth and operational ease have increased in importance.
Kaltura acquired eSelf.ai and PathFactory to add conversational AI and content intelligence to its enterprise platform. Its ISO/IEC 42001 certification also supports its position in procurement processes that consider AI management. Brightcove, under Bending Spoons ownership since 2025, introduced a 2026 roadmap that included scene-level contextual advertising and AI-based captions and localization in more than 90 languages. These moves show how established vendors are adding application features rather than competing only on basic video processing. Amagi reported more than 9,000 channel deliveries across over 300 distributors in more than 40 countries. Its focus on FAST and server-side advertising shows the value of serving a defined operational niche.
Harmonic completed the sale of its video business to MediaKind for USD 145 million in June 2026. The transaction concentrated Harmonic on broadband infrastructure while transferring its video technology and customer relationships to MediaKind. It also reflects greater specialization among suppliers that once operated across broadband and video technology. Few providers offer a fully integrated AI-assisted process from media ingest through advertising decisions. This leaves room for vendors that can reduce the need to connect several separate tools. Akamai continues to compete in live video delivery through its edge network and throughput capabilities, while Cloudflare and Amazon CloudFront are gaining attention through ecosystem integration and delivery-cost propositions. Cloud infrastructure is led by a small group, while platform and application providers remain fragmented and no combined top-player share was provided.
Cloud OTT Industry Leaders
Amazon Web Services, Inc.
Google LLC
Microsoft Corporation
Akamai Technologies, Inc.
Brightcove Inc.
- *Disclaimer: Major Players sorted in no particular order
Cloud OTT Market Companies Covered in this Report
- Amazon Web Services, Inc.
- Google LLC
- Microsoft Corporation
- Akamai Technologies, Inc.
- Brightcove Inc.
- Kaltura, Inc.
- Amagi Corporation
- Harmonic Inc.
- Synamedia Limited
- MediaKind
- Comcast Technology Solutions
- Roku, Inc.
- Cloudflare, Inc.
- IBM Corporation
- Tencent Cloud
- Endeavor Streaming
- Deltatre S.p.A.
- Accedo Group
- Muvi LLC
- Vimeo, Inc.
- JW Player

Recent Industry Developments in Cloud OTT Market
- July 2026: Kaltura was named the 2026 Frost and Sullivan Global Company of the Year in the Global Enterprise Video Platform Industry, following its accelerated acquisitions of eSelf.ai and PathFactory over the prior year; these transactions embedded real-time conversational AI agents and content intelligence into Kaltura's enterprise video platform, certified to ISO/IEC 42001.
- June 2026: Harmonic completed the sale of its video business to MediaKind for USD 145 million in cash on June 17, 2026; Harmonic becomes a pure-play broadband provider focused on its virtualized cOS platform and DOCSIS 4.0 infrastructure, while MediaKind absorbs Harmonic's video platform and customer relationships.
- June 2026: Kaltura was recognized as a Representative Vendor in the 2026 Gartner Market Guide for Video Platform Services for the second consecutive year, validating its agentic AI video platform strategy spanning enterprise video portals, AI content creation, and conversational AI agents.
- May 2026: Amagi launched the largest-ever upgrade to its CLOUDPORT cloud broadcast platform, shipping 250+ features in FY25-26 to enable 100+ concurrent feeds with 200-player multi-AZ redundancy, ultra-low-latency JPEG-XS workflows reducing lag to 1.3 seconds, and SOC 2 Type II security certification.


Global Cloud OTT Market Report Scope
The Global Cloud OTT (Over-the-Top) Market refers to the worldwide ecosystem of cloud-based platforms, infrastructure, and services that enable the delivery, management, storage, and streaming of video, audio, and other digital media content directly to consumers over the internet, bypassing traditional cable, satellite, and broadcast distribution networks.
The Cloud OTT Market Report is Segmented by End User (Broadcasters and Pay-TV Operators, Telecom Operators and Internet Service Providers, Pure-play OTT and Direct-to-Consumer Providers, Content Owners, Studios, and Digital Media Companies, and Enterprises and Institutional Organizations), Vertical (Media and Entertainment, E-Learning and Education, BFSI, Retail and E-commerce, IT and Telecommunication, Healthcare and Life Sciences, Government and Public Sector, and Other Verticals), Deployment (Public Cloud, Private Cloud, and Hybrid Cloud), and Geography (North America, South America, Europe, Asia-Pacific, Middle East, and Africa). The Market Forecasts are Provided in Terms of Value (USD).
| Broadcasters and Pay-TV Operators |
| Telecom Operators and Internet Service Providers |
| Pure-play OTT and Direct-to-Consumer Providers |
| Content Owners, Studios, and Digital Media Companies |
| Enterprises and Institutional Organizations |
| Media and Entertainment |
| E-Learning and Education |
| BFSI |
| Retail and E-commerce |
| IT and Telecommunication |
| Healthcare and Life Sciences |
| Government and Public Sector |
| Other Verticals |
| Public Cloud |
| Private Cloud |
| Hybrid Cloud |
| North America | United States |
| Canada | |
| Mexico | |
| South America | Brazil |
| Argentina | |
| Rest of South America | |
| Europe | Germany |
| United Kingdom | |
| France | |
| Russia | |
| Italy | |
| Rest of Europe | |
| Asia-Pacific | China |
| India | |
| Japan | |
| South Korea | |
| Australia | |
| Rest of Asia-Pacific | |
| Middle East | Saudi Arabia |
| United Arab Emirates | |
| Turkey | |
| Rest of Middle East | |
| Africa | South Africa |
| Nigeria | |
| Egypt | |
| Rest of Africa |
| By End User | Broadcasters and Pay-TV Operators | |
| Telecom Operators and Internet Service Providers | ||
| Pure-play OTT and Direct-to-Consumer Providers | ||
| Content Owners, Studios, and Digital Media Companies | ||
| Enterprises and Institutional Organizations | ||
| By Vertical | Media and Entertainment | |
| E-Learning and Education | ||
| BFSI | ||
| Retail and E-commerce | ||
| IT and Telecommunication | ||
| Healthcare and Life Sciences | ||
| Government and Public Sector | ||
| Other Verticals | ||
| By Deployment Type | Public Cloud | |
| Private Cloud | ||
| Hybrid Cloud | ||
| By Geography | North America | United States |
| Canada | ||
| Mexico | ||
| South America | Brazil | |
| Argentina | ||
| Rest of South America | ||
| Europe | Germany | |
| United Kingdom | ||
| France | ||
| Russia | ||
| Italy | ||
| Rest of Europe | ||
| Asia-Pacific | China | |
| India | ||
| Japan | ||
| South Korea | ||
| Australia | ||
| Rest of Asia-Pacific | ||
| Middle East | Saudi Arabia | |
| United Arab Emirates | ||
| Turkey | ||
| Rest of Middle East | ||
| Africa | South Africa | |
| Nigeria | ||
| Egypt | ||
| Rest of Africa | ||


Key Questions Answered in the Report
What is the Cloud OTT market size?
The Cloud OTT market size is projected to increase from USD 7.10 billion in 2026 to USD 13.97 billion by 2031, at a CAGR of 14.18%.
What is driving demand for cloud OTT platforms?
Broadband and 5G expansion, cloud-native workflow adoption, live sports streaming, FAST channel growth, and AI-enabled advertising and personalization are the primary demand drivers.
Which end user leads cloud OTT adoption?
Broadcasters and Pay-TV Operators led end-user revenue, accounting for a 25.29% market share in 2025.
Which deployment model is most widely used for cloud OTT?
Public Cloud was the leading deployment model, holding a 50.55% revenue share in 2025 due to its scalability, support for variable traffic volumes, and faster service deployment.
Which region is growing fastest for cloud OTT services?
Asia-Pacific is expected to register the fastest growth, with a projected CAGR of 15.01% between 2026 and 2031.
What challenges affect cloud OTT platform operators?
Key challenges include rising content rights and delivery costs, credential abuse, piracy, data sovereignty and residency requirements, regulatory compliance complexity, and vendor lock-in risks.
Page last updated on:





