Cell Separation Market Size and Share
Market Overview
| Study Period | 2019 - 2031 |
|---|---|
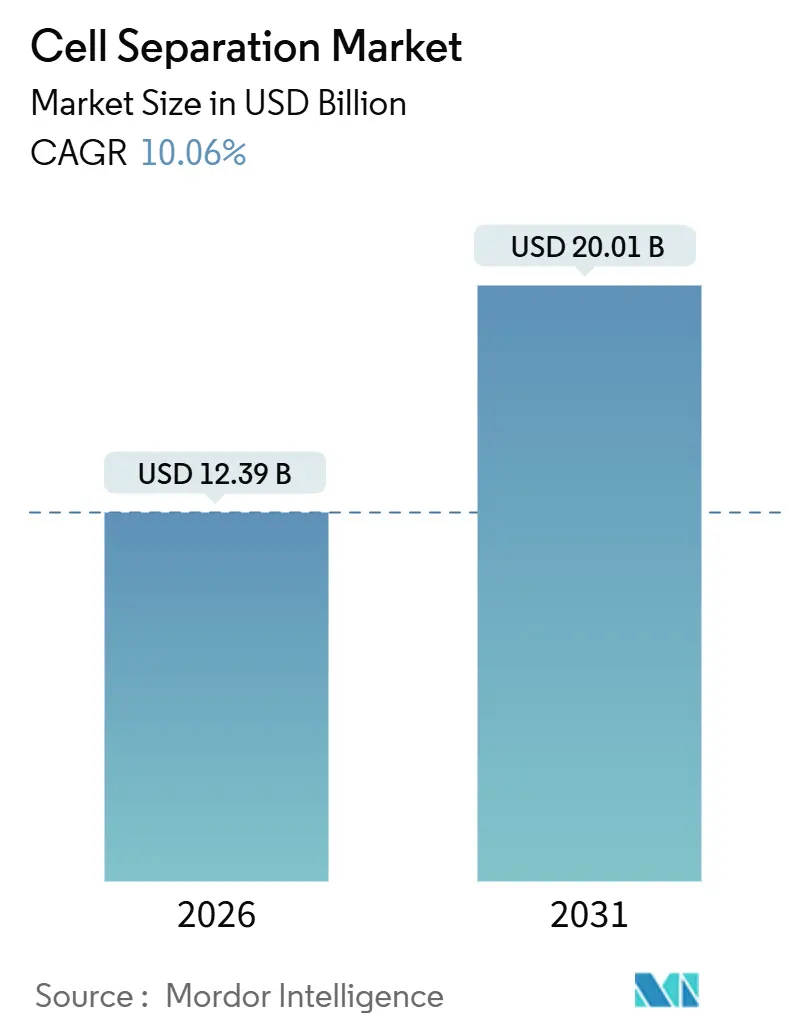
| Market Size (2026) | USD 12.39 Billion |
| Market Size (2031) | USD 20.01 Billion |
| Growth Rate (2026 - 2031) | 10.06% CAGR |
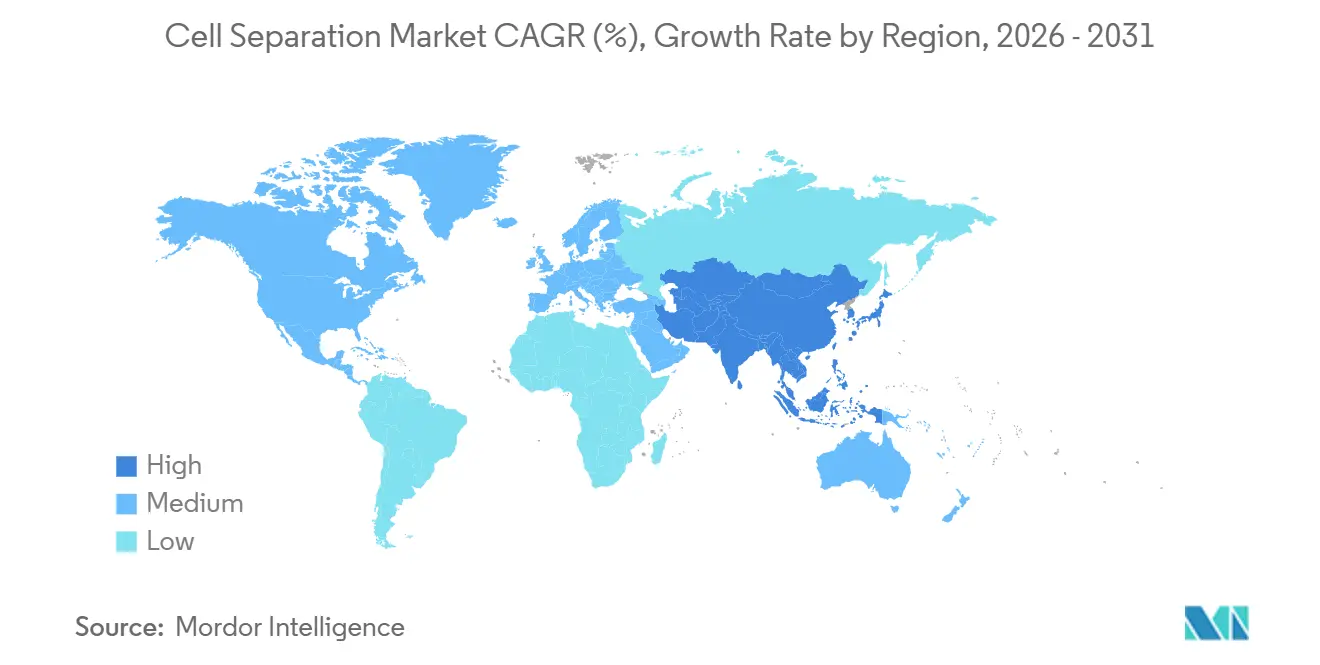
| Fastest Growing Market | Asia Pacific |
| Largest Market | North America |
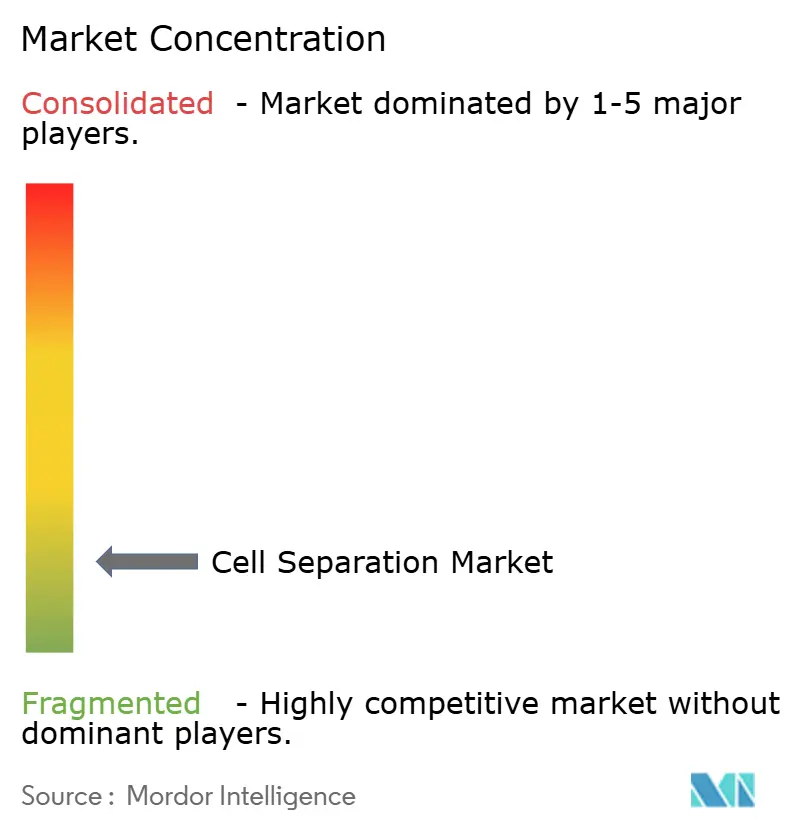
| Market Concentration | Low |
Major Players *Disclaimer: Major Players sorted in no particular order Image © Mordor Intelligence. Reuse requires attribution under CC BY 4.0. | |
Cell Separation Market Analysis by Mordor Intelligence
The Cell Separation Market size is estimated at USD 12.39 billion in 2026, and is expected to reach USD 20.01 billion by 2031, at a CAGR of 10.06% during the forecast period (2026-2031).
Demand is accelerating as closed-system automation becomes standard in cell and gene therapy (CGT) manufacturing, high-throughput oncology studies require multi-parameter sorting, and microfluidics plus AI unlock label-free rare-cell diagnostics. Vendors are consolidating to deliver end-to-end workflows, illustrated by Waters’ agreement to acquire BD Biosciences & Diagnostics and Thermo Fisher’s purchase of Solventum’s filtration unit. Regulatory momentum also matters: the FDA cleared six CGT BLAs in 2024, and the EMA’s 2025 guidance now allows hospital-based CAR-T production in isolators, both of which hasten adoption of GMP-grade automated platforms. Asia-Pacific’s infrastructure build-out, especially in China and India, positions the region for double-digit gains through 2031, while North America remains the largest buyer due to NIH and NCI grant activity.
Key Report Takeaways
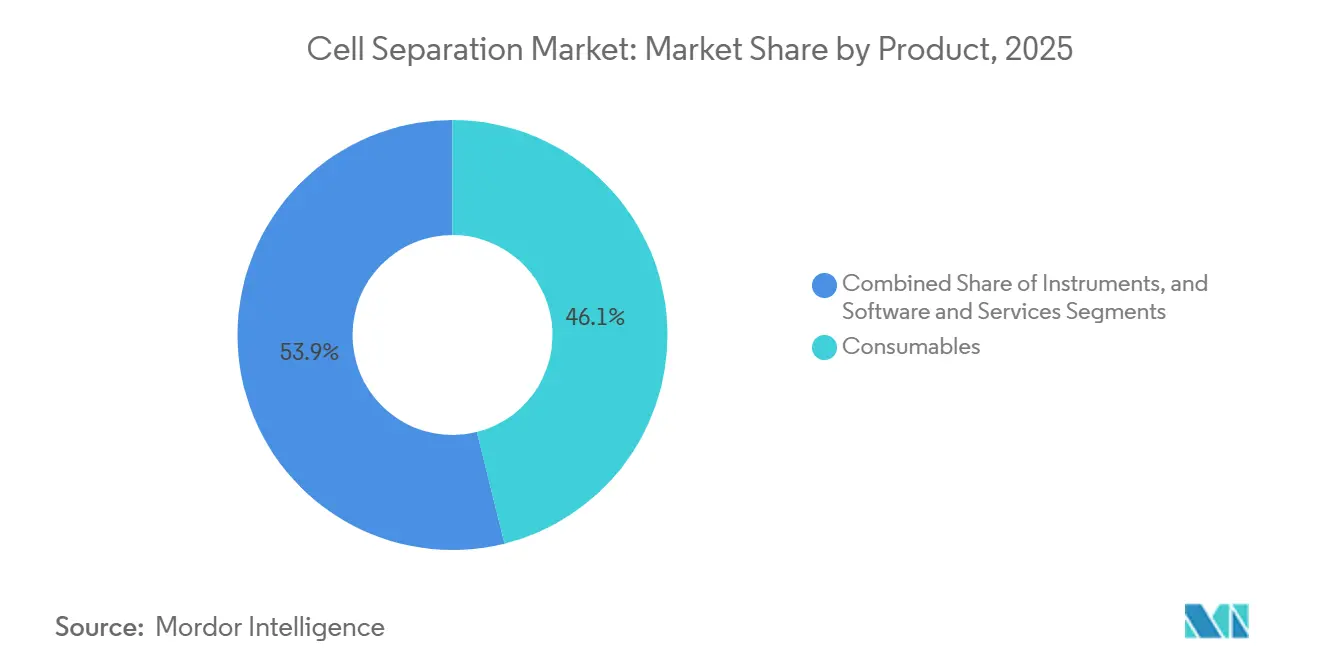
- By product category, consumables captured 46.12% of cell separation market share in 2025, while software and services are expanding at a 14.63% CAGR through 2031.
- By technology, magnetic-activated cell sorting (MACS) led with 34.78% share in 2025; microfluidics is forecast to advance at a 13.42% CAGR to 2031.
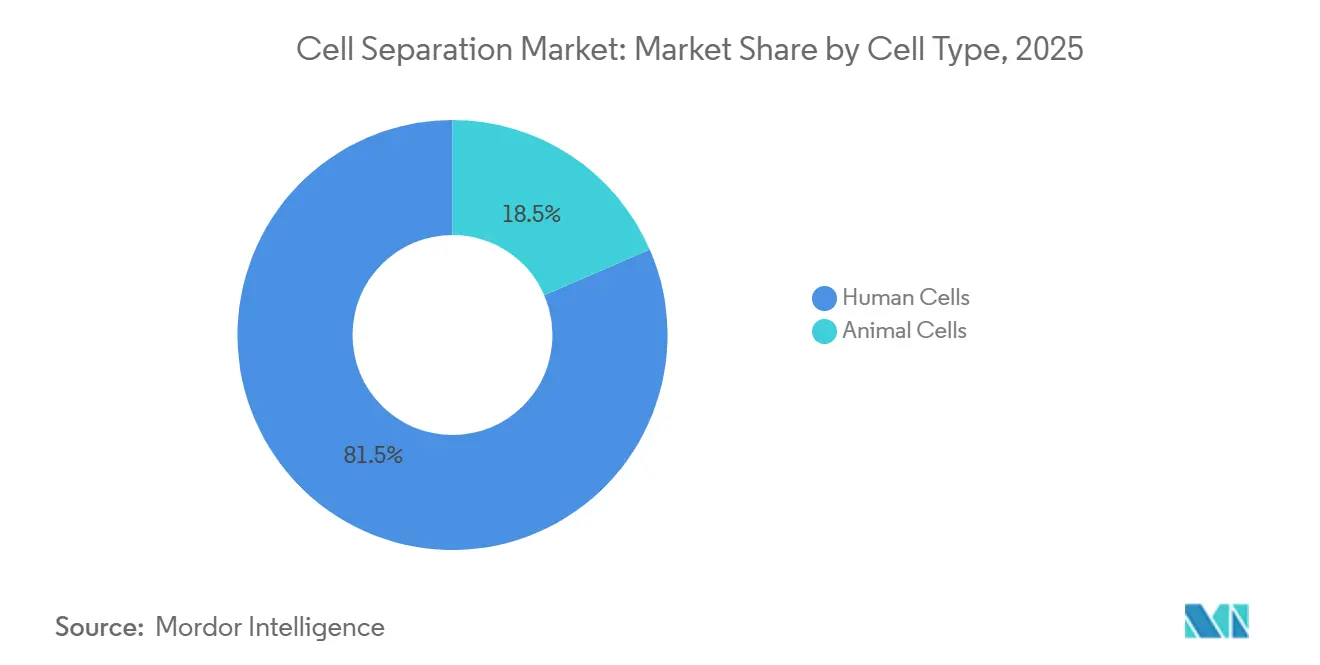
- By cell type, human cells accounted for 81.51% share of the cell separation market size in 2025 and animal cells are growing at a 14.75% CAGR.
- By application, cancer research held 27.11% share in 2025 and therapeutics is moving ahead at a 12.79% CAGR.
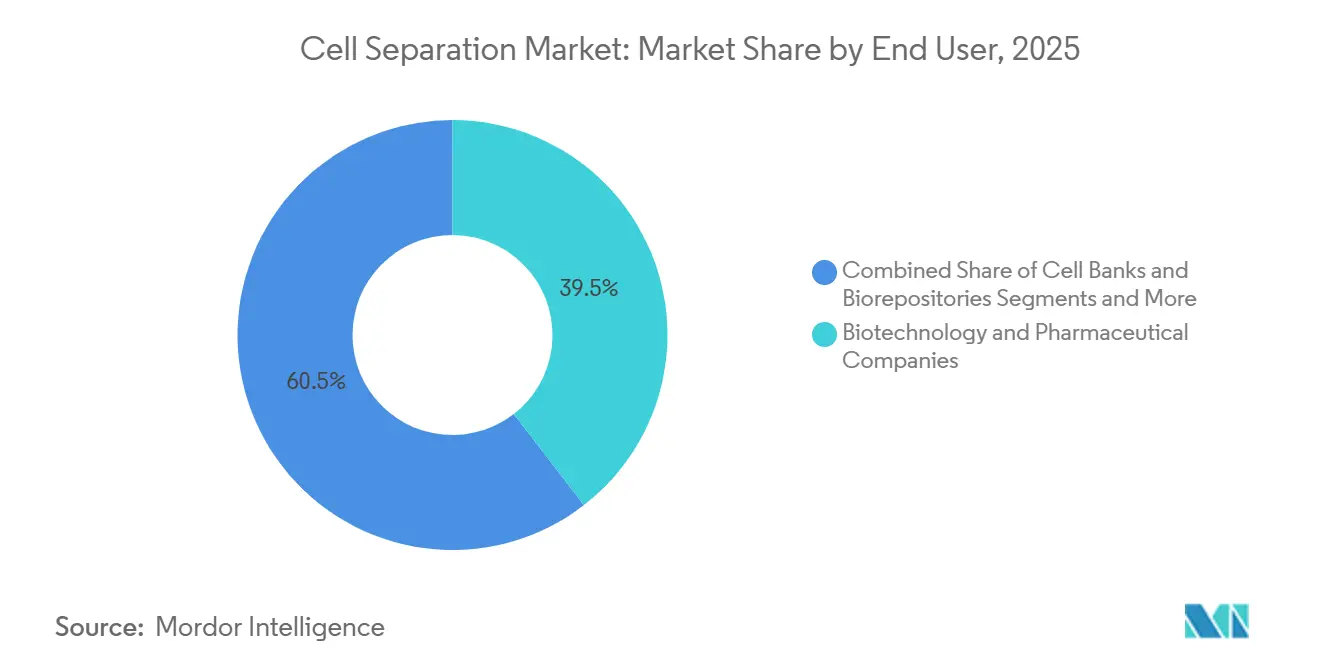
- By end user, biotechnology and pharmaceutical companies represented 39.52% of demand in 2025, whereas CROs/CMOs record the highest projected CAGR at 13.86% through 2031.
- By geography, North America commanded 36.63% share in 2025, and Asia-Pacific is set to grow at a 12.33% CAGR over the forecast period.
Note: Market size and forecast figures in this report are generated using Mordor Intelligence’s proprietary estimation framework, updated with the latest available data and insights as of January 2026.
Global Cell Separation Market Trends and Insights
Drivers Impact Analysis*
| Driver | (~) % Impact on CAGR Forecast | Geographic Relevance | Impact Timeline |
|---|---|---|---|
| CGT manufacturing scale-up drives demand for closed, automated cell separation | +2.1% | North America, Europe, China | Medium term (2-4 years) |
| Rising oncology and chronic disease research intensity accelerates cell isolation use | +1.8% | North America, Europe | Short term (≤ 2 years) |
| Biologics and vaccine R&D require high-throughput, repeatable cell purification | +1.5% | Asia-Pacific global vaccine hubs | Medium term (2-4 years) |
| Advances in microfluidics, MACS/FACS, and AI-enabled sorting improve purity and viability | +1.9% | Early adoption in North America, Europe | Long term (≥ 4 years) |
| Rare-cell diagnostics expand microfluidic separation adoption | +1.2% | North America, Europe, Japan, South Korea | Medium term (2-4 years) |
| GMP-grade closed-system workflows become standard in clinical manufacturing | +1.6% | Global | Long term (≥ 4 years) |
| Source: Mordor Intelligence | |||
CGT Manufacturing Scale-Up Drives Demand for Closed, Automated Cell Separation
Autologous CAR-T production must process 50-200 mL of apheresis material within 48 hours, a cadence open centrifugation cannot meet without microbial risk. FDA guidance issued in 2024 recommends closed single-use systems, prompting adoption of Thermo Fisher’s DynaCellect and Miltenyi’s CliniMACS Prodigy, both of which integrate enrichment, activation, and expansion in one platform. The EMA’s 2025 decentralized model further endorses hospital-based isolator suites, shrinking logistics timelines and reinforcing platform demand.[1]European Medicines Agency, “Decentralized Manufacturing of Advanced Therapy Medicinal Products,” ema.europa.eu Investment is strongest in the United States, Germany, and China as Phase II allogeneic programs transition to commercial-scale runs.
Rising Oncology and Chronic Disease Research Intensity Accelerates Cell Isolation Use
The National Cancer Institute earmarked USD 4.2 million for single-cell technology grants in fiscal 2026, encouraging academic labs to couple spectral flow cytometry with mass cytometry to resolve 40-plus markers simultaneously.[2]National Institutes of Health, “Innovative Molecular Analysis Technologies (IMAT) R61/R33,” grants.nih.gov Instruments such as Cytek’s Aurora reduce compensation errors and detect minimal residual disease at 1-in-10,000 sensitivity, while autoimmune studies adopt similar panels to isolate antigen-specific B cells. Six CGT BLAs gained FDA approval in 2024, each perfected through iterative cell-isolation optimization. These signals translate into rapid equipment orders and consumable contracts across North America and Europe.
Biologics and Vaccine R&D Require High-Throughput, Repeatable Cell Purification
CHO, Vero, and MDCK lines used for monoclonal antibodies and seasonal influenza vaccines must be cloned and re-selected frequently. Bio-Rad’s S3e sorter deposits 10,000 single cells per hour into microplates, cutting cell-line development cycles from nine to six months. Filtration-based assemblies such as Merck Millipore’s Mobius cartridges scale to 500-liter reactors, automating debris removal before viral harvest. Asia-Pacific CDMOs are deploying these closed trains to capture global mRNA vaccine contracts, feeding a medium-term uplift.
Advances in Microfluidics, MACS/FACS, and AI-Enabled Sorting Improve Purity/Viability
Microfluidic chips operate at atmospheric pressure, preserving fragile iPSCs above 98% viability. LevitasBio’s buoyancy-activated LeviCell and Deepcell’s morphology-based imaging sorters eliminate antibody costs by pairing label-free physics with convolutional neural networks.[3]LevitasBio Editorial Team, “LeviCell Buoyancy-Activated Cell Sorting Platform,” LevitasBio, levitasbio.com Sony’s MA900 applies machine-learning gating that trims setup time to five minutes. As software validation under 21 CFR Part 11 matures, AI-native platforms will diffuse beyond flagship cancer centers into regional labs.
Restraints Impact Analysis*
| Restraint | (~) % Impact on CAGR Forecast | Geographic Relevance | Impact Timeline |
|---|---|---|---|
| High total cost of ownership for advanced sorters and GMP instrumentation | -1.4% | Emerging markets, academic centers | Short term (≤ 2 years) |
| Technical complexity and skilled-operator requirements limit throughput scaling | -1.1% | North America, Europe | Medium term (2-4 years) |
| Trade, tariff, and reagent supply shocks increase landed costs and lead times | -0.9% | Global | Short term (≤ 2 years) |
| Clinical validation and regulatory evidence burden slow uptake of novel methods | -0.8% | Global | Long term (≥ 4 years) |
| Source: Mordor Intelligence | |||
High Total Cost of Ownership for Advanced Sorters and GMP Instrumentation
A six-laser flow cytometer lists at USD 500,000-800,000, and annual service can exceed USD 100,000. Single-use kits for closed GMP platforms add USD 2,000-5,000 per patient lot, squeezing early-stage developers. Import duties lift prices another 15-25% in Latin America and parts of Asia. Pay-per-use agreements from Sony and Cytek lower entry barriers but are still limited to high-volume CROs.
Technical Complexity and Skilled-Operator Requirements Limit Throughput Scaling
The Biotechnology Innovation Organization reported 15-20% vacancies for flow-cytometry specialists in 2024, and it takes six to 12 months to train a novice. Automated gating is advancing, yet validation under electronic-records regulations adds documentation burdens that many small labs cannot meet. High turnover at CROs leaves knowledge gaps, causing batch failures and re-runs.
*Our forecasts treat driver/restraint impacts as directional, not additive. The impact forecasts reflect baseline growth, mix effects, and variable interactions.
Segment Analysis
By Product: Data Platforms Drive Software and Services Upswing
The cell separation market size for consumables totaled USD 5.72 billion in 2025, reflecting 46.12% share as beads, tubing sets, and antibody kits deliver predictable recurring revenue. Instruments trail but remain vital, especially high-end flow cytometers with 10-year replacement cycles. Software and services are posting a 14.63% CAGR to 2031, outpacing hardware as vendors like Thermo Fisher license Gibco CTS Optimizer to auto-compile deviation reports for regulators, saving QA teams up to USD 100,000 annually. Cytek’s cloud SpectroFlo harmonizes gating across continents, cutting inter-site variability under 10%. This monetization of data beyond hardware is now a core growth lever across the cell separation industry.
Second-order effects include antibody commoditization, as Chinese and Indian suppliers undercut Western pricing by 30-40%, sparking margin pressure on legacy kits. To defend share, Miltenyi introduced REAfinity recombinant antibodies that curb non-specific binding, boosting purity for rare-cell runs. Vendors also bundle consumables with SaaS analytics to lock in customers, a playbook pioneered in laboratory informatics that is now reshaping cell-separation procurement.


By Technology: Microfluidics Chips Challenge MACS Leadership
MACS held 34.78% of the technology mix in 2025, underpinned by Miltenyi’s global installed base and regulatory precedent in CAR-T workflows. Nevertheless, microfluidics-based methods are advancing at 13.42% CAGR as researchers prize >98% viability and label-free operation. The cell separation market share of microfluidics remains small today yet grows quickly in rare-cell diagnostics, especially when AI algorithms classify morphology instead of fluorescence. FACS continues as the gold standard for 30-plus-color panels, but pressure nozzles can harm delicate cells, leaving space for gentle chip-based devices.
Filtration and centrifugation still dominate upstream bioprocess harvests, though open protocols limit their future in GMP therapeutics. Acoustic and dielectrophoretic platforms are entering niche segments, supported by patent filings around shear-free focusing. The long-term outcome is coexistence: MACS and FACS for throughput and regulatory comfort, microfluidics for fragile cells and emerging diagnostics.
By Cell Type: Human Cells Dominate, Animal Lines Accelerate on Vaccine Demand
Human cells occupied 81.51% of all isolations in 2025, led by CD3-positive T-cell enrichment for commercial CAR-T lots. At the same time, tumor cells and circulating tumor cells represent the fastest-growing subcategory because liquid-biopsy labs need intact single cells for RNA sequencing. On the animal side, CHO and Vero lines used in monoclonal antibodies and viral vaccines are scaling at a 14.75% CAGR, fueled by mRNA and pandemic-preparedness programs.
Avian lines such as chicken embryo fibroblasts enter influenza stockpiles, while insect and fish cells serve emerging protein vaccines and aquaculture health. Human cells will retain the lion’s share, but animal cells will account for expanding manufacturing volumes where cost per dose outweighs regulatory complexity.
By Application: Therapeutics Surpasses Research in Growth Pace
Cancer research delivered 27.11% of 2025 revenue, yet therapeutics is the clear growth engine, advancing at 12.79% CAGR as approved CGT products scale commercially. Each CAR-T lot demands multi-step purification under GMP, and CDMOs in the United States, Switzerland, and China are building suites to meet sponsor backlogs. Diagnostics, including IVD-grade CTC enumeration and prenatal testing, grows steadily but faces reimbursement approval cycles.
Stem-cell research and tissue regeneration remain grant-driven and therefore more volatile. Biomolecule isolation applies tangential-flow filtration and chromatography to plasmid and viral vector batches, an area benefitting from Thermo Fisher’s vertically integrated filtration acquisition. By 2029, therapeutics is poised to eclipse cancer research in absolute spending.
By End User: Outsourcing Wave Elevates CROs and CMOs
Biotech and pharmaceutical firms still purchase the largest share of instruments, yet CROs/CMOs are registering a 13.86% CAGR as sponsors avoid USD 50-100 million facility builds. Lonza’s USD 600 million Portsmouth expansion and Catalent’s USD 400 million Harmans site exemplify capacity pouring into flexible, closed-system pods. Academic centers keep buying benchtop sorters for discovery, whereas hospitals install IVD-cleared devices mainly in oncology centers that secure grant funding. Cell banks rely on automated CD34-positive selection for transplant products.
Over the forecast window, CROs/CMOs will narrow the revenue gap with pharma as more Phase III programs mature into commercial supply, solidifying the outsourcing model across the cell separation market.
Geography Analysis
North America generated 36.63% of 2025 revenue, with Boston and the San Francisco Bay Area alone accounting for the majority of CGT clinical trials. NIH and NCI grants sustain a pipeline of instrumentation purchases, while Canada and Mexico offer cost-competitive manufacturing overflow. Europe follows, buoyed by EMA’s isolator guidance that cuts vein-to-vein CAR-T times to under 10 days, spurring hospital installations across Germany, France, and the United Kingdom.
Asia-Pacific is the star performer at a 12.33% CAGR through 2031. China’s streamlined IND pathway and India’s USD 1.8 billion PLI incentive accelerate factory builds; Japan’s PMDA approved three regenerative medicines in 2025, prompting Takeda and Fujifilm CDMO outlays. South Korea’s Samsung Biologics and Australia’s CSL Behring collectively pledged more than USD 500 million to new GMP suites. Rest-of-Asia markets such as Singapore manage regional trials but still face fragmented regulation.
The Middle East & Africa and South America expand at mid-single-digit rates. Saudi Arabia’s KAUST is equipping oncology genomics labs, while Brazilian universities deepen flow-cytometry capacity despite import tariffs. Overall, the cell separation market is shifting east as governments anchor biomanufacturing to national growth agendas.

Competitive Landscape
The key suppliers include Thermo Fisher Scientific, BD (soon Waters), Danaher’s Beckman Coulter Life Sciences, Miltenyi Biotec, and Merck KGaA. Thermo Fisher’s USD 4.1 billion acquisition of Solventum’s filtration line adds tangential-flow and chromatography assets, forming an end-to-end bioprocess suite. Waters plans to merge BD’s flow cytometry with its own chromatography and mass-spectrometry portfolio to cross-sell QC platforms after the USD 17.5 billion deal closes in 2026.
Disruptors flourish in label-free and AI-native niches. Deepcell partners with major cancer centers to monitor minimal residual disease using convolutional neural networks that sidestep fluorescence costs. LevitasBio’s buoyancy chip, Akadeum’s microbubble kits, and Cytek’s full-spectrum optics attack legacy workflows on viability, ease of use, and cost. Pay-per-use models from Sony and Cytek shift capex to opex, appealing to academic labs challenged by tight budgets. Patent filings confirm incumbents’ push into software, tubing, and acoustic focusing, highlighting a strategic pivot from pure hardware.
Cell Separation Industry Leaders
Becton, Dickinson and Company
Merck KGaA
Miltenyi Biotec
Thermo Fisher Scientific
Danaher
- *Disclaimer: Major Players sorted in no particular order

Recent Industry Developments
- December 2025: Akadeum Life Sciences unveiled the Akadeum CDMO Alliance, a consortium aimed at lowering CGT manufacturing costs by integrating buoyant cell-separation kits into partner workflows.
- September 2025: Thermo Fisher finished integrating Solventum’s Purification & Filtration business, creating a single-vendor path from cell culture through final drug substance.
- September 2025: Charles River Laboratories incorporated Akadeum’s GMP-grade T-cell leukopak kit into its Cell Therapy Flex Platform, offering clients ready-to-use, closed-system protocols for autologous CAR-T pipelines.


Global Cell Separation Market Report Scope
Cell separation devices are laboratory tools used to isolate, sort, or purify specific cell populations from a mixed sample, based on physical or biological properties, for research and therapeutic purposes.
The Cell Separation Market Report is segmented by Product, Technology, Cell Type, Application, End User, and Geography. By Product, the market is segmented into Consumables, Instruments, and Software and Services. By Technology, the market is segmented into Centrifugation, MACS, FACS, Filtration, Microfluidics, and Acoustic/Dielectrophoretic. By Cell Type, the market is segmented into Human Cells and Animal Cells. By Application, the market is segmented into Biomolecule Isolation, Cancer Research, Stem Cell Research, Tissue Regeneration, IVD, and Therapeutics. By End User, the market is segmented into Biotech & Pharma, Academic & Research, Hospitals & Diagnostics, Cell Banks, and CROs/CMOs. By Geography, the market is segmented into North America, Europe, Asia-Pacific, MEA, and South America. The market report also covers the estimated market sizes and trends for 17 countries across major regions globally. Market Forecasts are Provided in Terms of Value (USD).
| Consumables | Reagents & Kits |
| Beads & Antibodies | |
| Columns | |
| Filters & Disposables | |
| Instruments | Centrifuges |
| Flow Cytometers & Cell Sorters | |
| Magnetic Separators | |
| Microfluidic Separation Systems | |
| Filtration Units | |
| Software and Services |
| Centrifugation |
| Magnetic-Activated Cell Sorting (MACS) |
| Fluorescence-Activated Cell Sorting (FACS) |
| Filtration-based Separation |
| Microfluidics-based Separation |
| Acoustic/Dielectrophoretic Label-free Separation |
| Human Cells | T cells |
| B cells | |
| NK cells | |
| Monocytes/Macrophages | |
| Hematopoietic Stem Cells (HSCs) | |
| Mesenchymal Stem Cells (MSCs) | |
| Tumor Cells / Circulating Tumor Cells (CTCs) | |
| Animal Cells | Mammalian |
| Avian | |
| Others |
| Biomolecule Isolation & Purification |
| Cancer Research |
| Stem Cell Research |
| Tissue Regeneration & Regenerative Medicine |
| In Vitro Diagnostics |
| Therapeutics (Cell & Gene Therapy Manufacturing) |
| Biotechnology & Pharmaceutical Companies |
| Academic & Research Institutes |
| Hospitals & Diagnostic Laboratories |
| Cell Banks & Biorepositories |
| Contract Research/Manufacturing (CROs/CMOs) |
| North America | United States |
| Canada | |
| Mexico | |
| Europe | Germany |
| France | |
| United Kingdom | |
| Italy | |
| Spain | |
| Rest of Europe | |
| Asia-Pacific | China |
| Japan | |
| India | |
| South Korea | |
| Australia | |
| Rest of Asia-Pacific | |
| Middle East & Africa | GCC |
| South Africa | |
| Rest of Middle East & Africa | |
| South America | Brazil |
| Argentina | |
| Rest of South America |
| By Product | Consumables | Reagents & Kits |
| Beads & Antibodies | ||
| Columns | ||
| Filters & Disposables | ||
| Instruments | Centrifuges | |
| Flow Cytometers & Cell Sorters | ||
| Magnetic Separators | ||
| Microfluidic Separation Systems | ||
| Filtration Units | ||
| Software and Services | ||
| By Technology | Centrifugation | |
| Magnetic-Activated Cell Sorting (MACS) | ||
| Fluorescence-Activated Cell Sorting (FACS) | ||
| Filtration-based Separation | ||
| Microfluidics-based Separation | ||
| Acoustic/Dielectrophoretic Label-free Separation | ||
| By Cell Type | Human Cells | T cells |
| B cells | ||
| NK cells | ||
| Monocytes/Macrophages | ||
| Hematopoietic Stem Cells (HSCs) | ||
| Mesenchymal Stem Cells (MSCs) | ||
| Tumor Cells / Circulating Tumor Cells (CTCs) | ||
| Animal Cells | Mammalian | |
| Avian | ||
| Others | ||
| By Application | Biomolecule Isolation & Purification | |
| Cancer Research | ||
| Stem Cell Research | ||
| Tissue Regeneration & Regenerative Medicine | ||
| In Vitro Diagnostics | ||
| Therapeutics (Cell & Gene Therapy Manufacturing) | ||
| By End User | Biotechnology & Pharmaceutical Companies | |
| Academic & Research Institutes | ||
| Hospitals & Diagnostic Laboratories | ||
| Cell Banks & Biorepositories | ||
| Contract Research/Manufacturing (CROs/CMOs) | ||
| By Geography | North America | United States |
| Canada | ||
| Mexico | ||
| Europe | Germany | |
| France | ||
| United Kingdom | ||
| Italy | ||
| Spain | ||
| Rest of Europe | ||
| Asia-Pacific | China | |
| Japan | ||
| India | ||
| South Korea | ||
| Australia | ||
| Rest of Asia-Pacific | ||
| Middle East & Africa | GCC | |
| South Africa | ||
| Rest of Middle East & Africa | ||
| South America | Brazil | |
| Argentina | ||
| Rest of South America | ||


Key Questions Answered in the Report
What is the projected value of the cell separation market by 2031?
Forecasts indicate the market will reach USD 20.01 billion in 2031.
Which product segment is growing fastest in cell isolation workflows?
Software and services lead with a 14.63% CAGR as vendors monetize data analytics.
Why is Asia-Pacific the fastest-growing region for cell separation technologies?
China’s streamlined IND rules and India’s PLI incentives are fueling rapid biomanufacturing expansion and double-digit equipment demand.
How are AI-enabled platforms changing cell separation?
Tools such as Deepcell’s morphology sorter replace multi-antibody panels with image-based neural networks, cutting reagent costs and preserving viability above 98%.
What restrains adoption of high-end cell sorters in emerging markets?
Up-front instrument prices above USD 500,000 plus 15-25% import duties elevate total cost of ownership, delaying purchase decisions.
Page last updated on:


