Bus Market Size and Share
Market Overview
| Study Period | 2019 - 2031 |
|---|---|
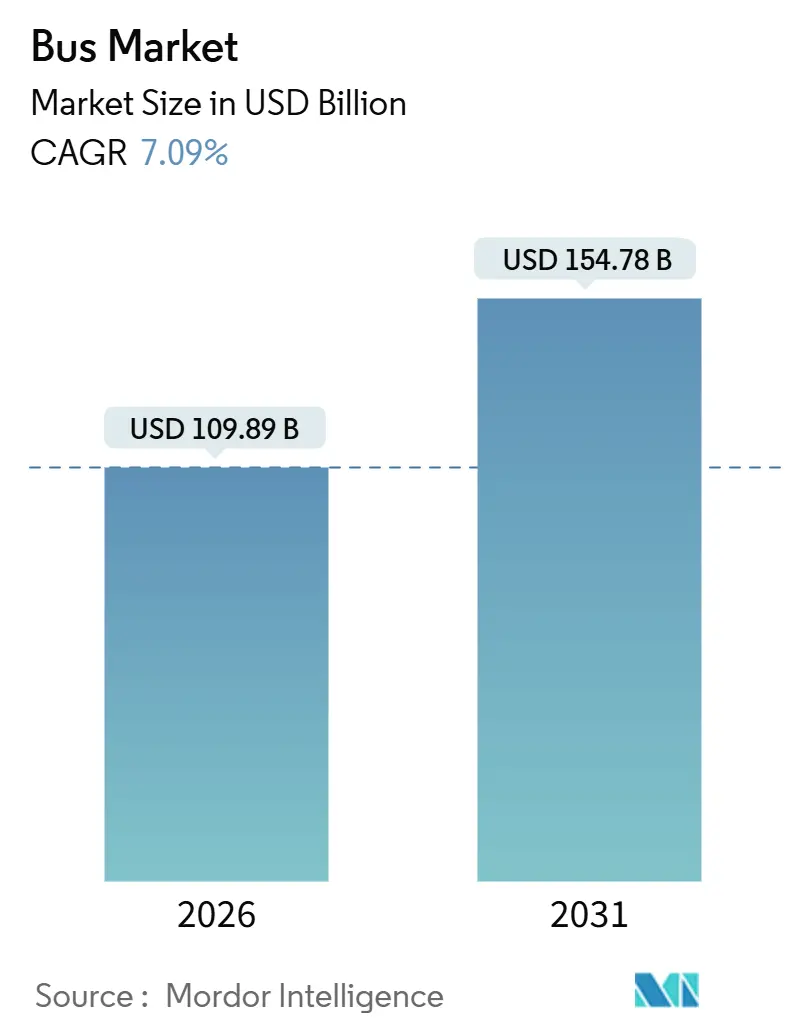
| Market Size (2026) | USD 109.89 Billion |
| Market Size (2031) | USD 154.78 Billion |
| Growth Rate (2026 - 2031) | 7.09% CAGR |
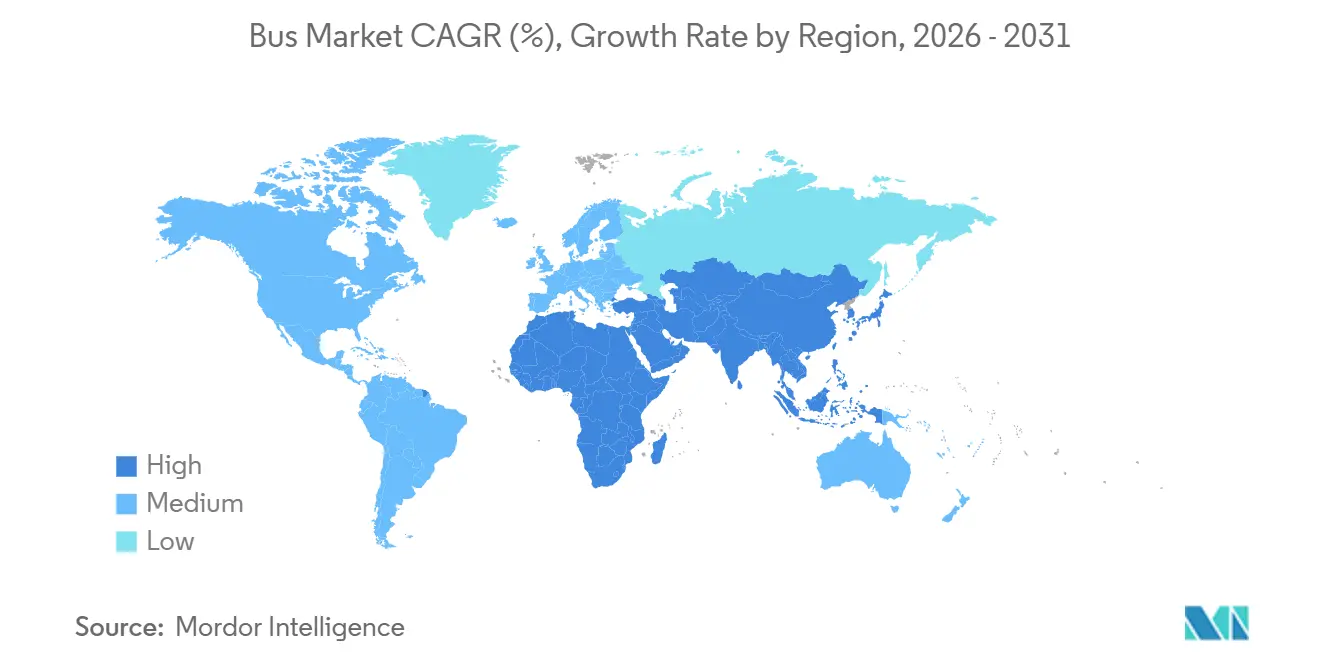
| Fastest Growing Market | Middle East and Africa |
| Largest Market | Asia Pacific |
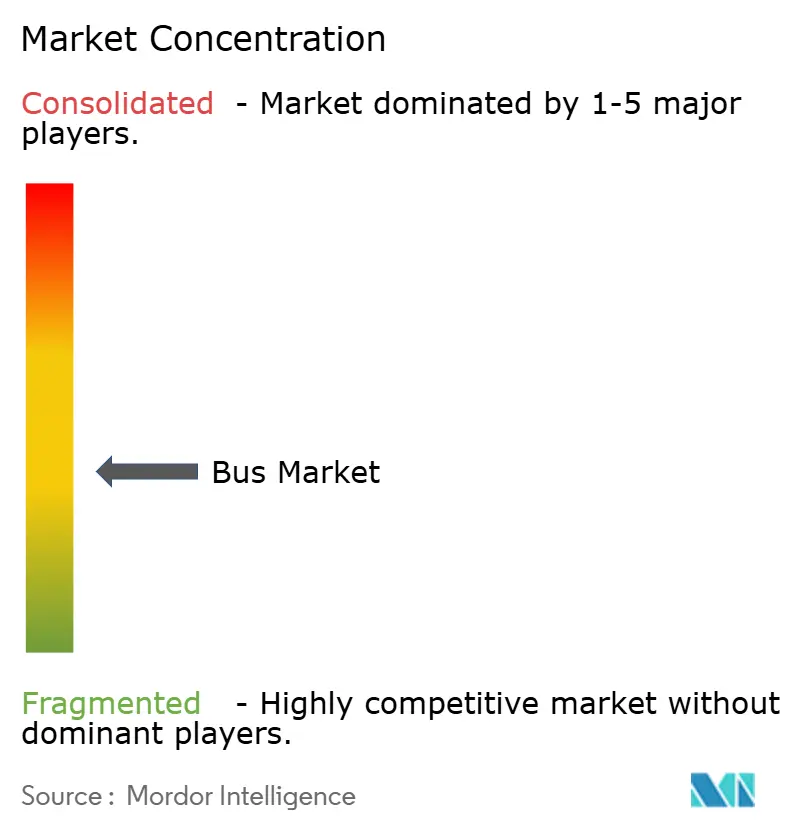
| Market Concentration | Medium |
Major Players *Disclaimer: Major Players sorted in no particular order Image © Mordor Intelligence. Reuse requires attribution under CC BY 4.0. | |
Bus Market Analysis by Mordor Intelligence
The global bus market size reached USD 109.89 billion in 2026 and is projected to expand to USD 154.78 billion by 2031, reflecting a 7.09% CAGR over the forecast period. As zero-emission mandates and urban air-quality regulations gain traction, battery-electric buses are outpacing the overall bus market. This shift, driven by the accelerating total-cost-of-ownership (TCO) parity, is leading major cities to replace their diesel fleets. While public transit agencies spearhead procurement, North American school-bus deployments are gaining momentum, bolstered by federal Clean School Bus funding. Additionally, sectors such as tourism and corporate shuttles are driving demand for smaller electric models. Competitive dynamics are intensifying: Chinese original-equipment manufacturers (OEMs), with their significant cost advantages in batteries, are putting pressure on their European and North American counterparts. In response, these rivals are increasingly turning to Battery-as-a-Service (BaaS) contracts and energy-management services. Despite macroeconomic risks, such as fluctuations in lithium and nickel prices and local grid constraints, the bus market is firmly on a path of electrification, a direction that most operators now deem inevitable.
Key Report Takeaways
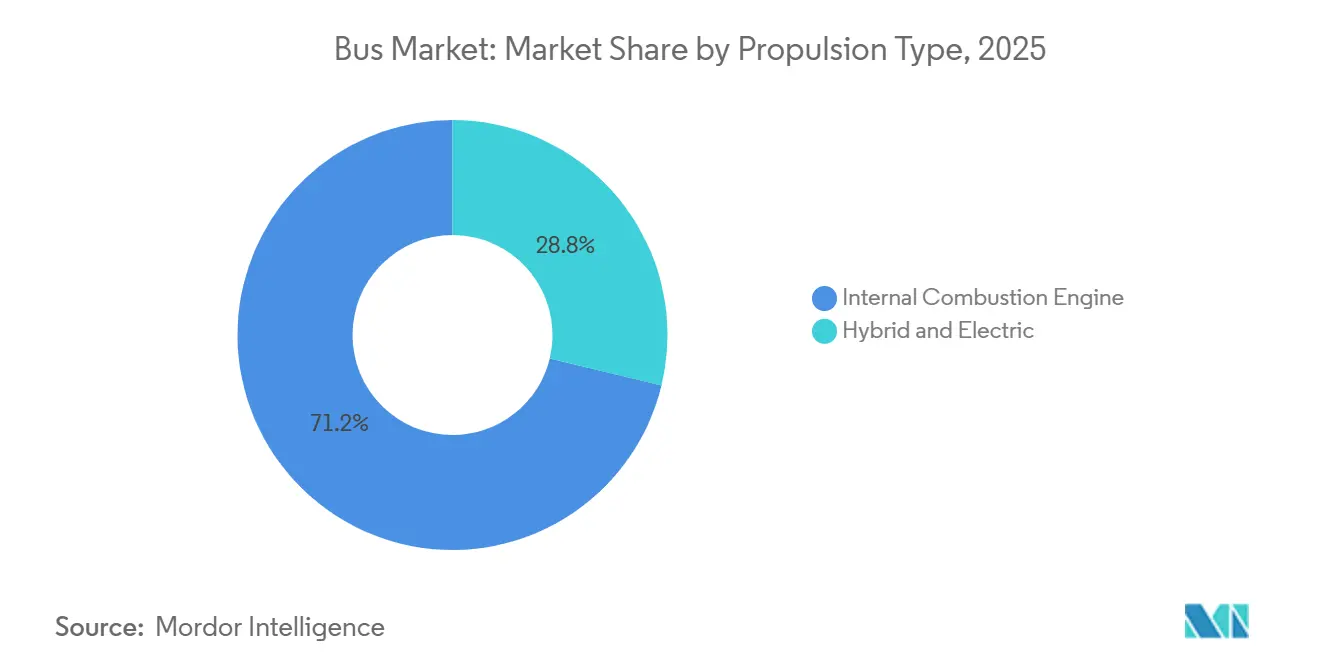
- By propulsion, diesel and other internal-combustion platforms retained a 71.23% market share in 2025; however, battery-electric buses are forecasted to post the fastest growth at an 11.82% CAGR through 2031.
- By deck configuration, single-deck buses led with 79.16% of the revenue in 2025; double-deck models are the fastest-growing at an 8.43% CAGR through 2031.
- By application, public transit captured 68.43% of demand in 2025, while the school-bus segment is pacing the field with an 8.23% CAGR to 2031.
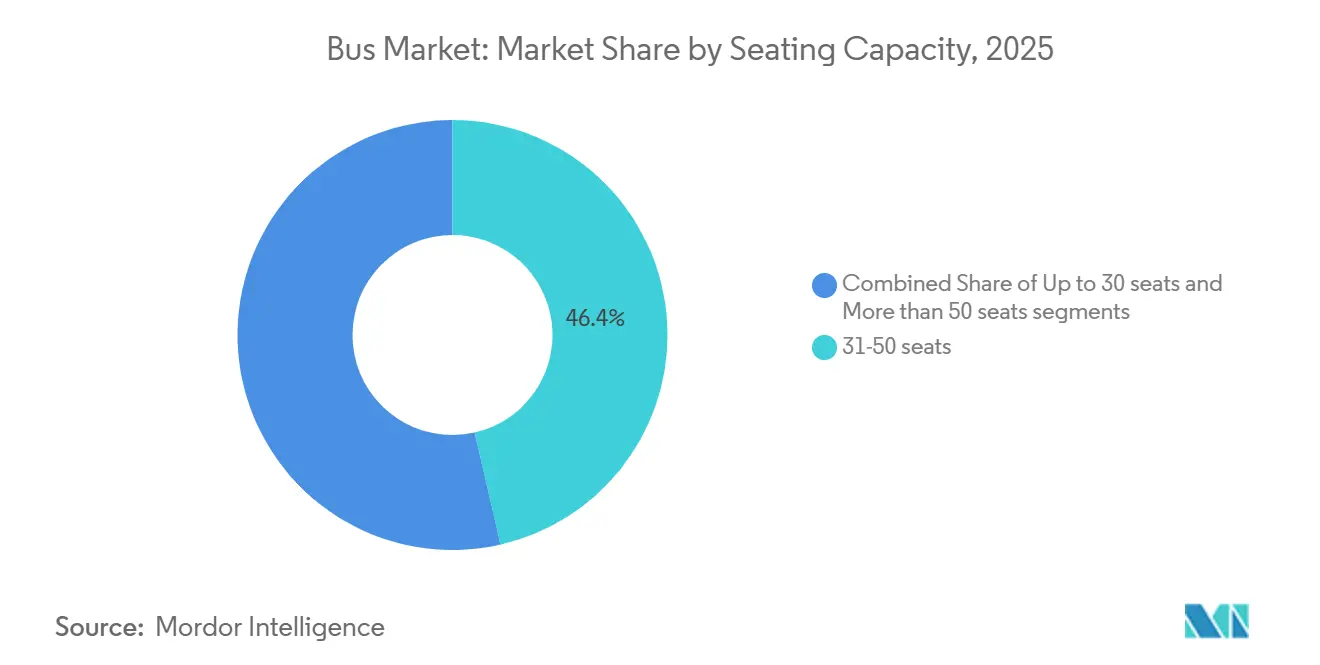
- By seating capacity, 31-50-seat buses dominated the market with a 46.41% share in 2025, whereas sub-30-seat models are advancing at a 7.48% CAGR.
- By bus length, 9-to-12-meter models accounted for 48.28% of the 2025 bus market size, whereas sub-9-meter buses are expanding at an 8.72% CAGR.
- Geographically, the Asia-Pacific region commanded 41.73% of the 2025 revenue; the Middle East and Africa region is set to be the fastest-growing, with a 9.73% CAGR.
Note: Market size and forecast figures in this report are generated using Mordor Intelligence’s proprietary estimation framework, updated with the latest available data and insights as of January 2026.
Global Bus Market Trends and Insights
Drivers Impact Analysis*
| Driver | (~) % Impact on CAGR Forecast | Geographic Relevance | Impact Timeline |
|---|---|---|---|
| Battery Cost Decline | +2.1% | China and Europe lead, North America lags by 12-18 months | Short term (≤2 years) |
| ZEB Procurement Mandates | +1.8% | European Union, China, California, select Indian states | Medium term (2-4 years) |
| Urban Air Quality Rules | +1.5% | Beijing, Delhi, Jakarta, Cairo, Riyadh | Medium term (2-4 years) |
| OEM Electrification Race | +1.2% | Global, with Chinese OEMs expanding into Latin America and Africa | Long term (≥4 years) |
| Battery‑as‑a‑Service Uptake | +0.9% | Europe, North America, pilot programs in Brazil and South Africa | Medium term (2-4 years) |
| Hydrogen Corridor Pilots | +0.4% | Germany, Netherlands, California, South Korea | Long term (≥4 years) |
| Source: Mordor Intelligence | |||


Rapid Battery-Cost Decline Enabling TCO Parity
In 2024, average pack prices declined, enabling total cost of ownership (TCO) parity with diesel fuel under favorable fuel and electricity price conditions[1]“Clean Vehicles Directive Explained,” European Commission, europa.eu. This parity is evident in many of the world's largest transit markets. In Santiago, the city's fleet has reported significantly lower per-kilometer costs. Additionally, reduced maintenance requirements due to fewer moving parts have significantly extended the lifespan of brake pads. While the timeline for subsidy-free viability has advanced, smaller operators still face challenges with the initial cost premium.
National ZEB Procurement Mandates
Public fleets are accelerating their replacement cycles due to mandates for zero-emission buses. California plans to prohibit diesel purchases in the coming years. Meanwhile, the European Union has set ambitious targets for zero-emission vehicles, and China is advancing rapidly toward electrifying its urban fleets [2]“Global EV Outlook 2024,”, International Energy Agency, iea.org. In India, the FAME-II program is driving widespread adoption of electric buses, leading to significant multi-state tenders. As a result, operators are now required to secure charging infrastructure in conjunction with their vehicle orders. This shift not only increases short-term capital demands but also provides OEMs with a clearer, long-term sales outlook.
Urban Air-Quality Regulations in Mega-Cities
Beijing plans to prohibit diesel buses in its downtown area, aiming to reduce urban pollution and promote cleaner transportation alternatives. Similarly, Delhi has implemented restrictions on diesel buses during periods of poor air quality to address environmental and public health concerns. Riyadh and Dubai have introduced low-emission zones, offering incentives such as toll exemptions for zero-emission buses, which encourage the adoption of sustainable transit solutions. These city-level initiatives are accelerating the transition to electrification, surpassing national timelines and focusing on routes with significant exposure, such as those serving schools and airports, to ensure a healthier and more sustainable urban environment.
Battery-as-a-Service Financing Uptake
By separating chassis purchases from battery leasing, companies can significantly reduce their initial financial burden while transferring the risk of battery degradation to OEMs or financiers. Volvo's Energy-as-a-Service contracts offer a comprehensive solution by bundling batteries, chargers, and power supply into a single per-kilometer fee. This model is gaining traction among agencies in cities such as Stockholm, Hamburg, and Lyon. Additionally, this approach enables faster deployment by eliminating delays caused by capital-budget constraints, allowing organizations to streamline their operations and adopt sustainable energy solutions more efficiently.
Restraints Impact Analysis*
| Restraint | (~) % Impact on CAGR Forecast | Geographic Relevance | Impact Timeline |
|---|---|---|---|
| High E‑Bus Price vs Diesel | −1.4% | South America, Africa, Southeast Asia | Short term (≤2 years) |
| Slow Charging Roll‑Out | −1.1% | North America, India, MEA, Latin America | Medium term (2-4 years) |
| Grid Upgrades at Large Depots | −0.8% | India, Southeast Asia, secondary U.S. cities | Medium term (2-4 years) |
| Cathode Material Supply Volatility | −0.6% | Global, lithium concentration in China and South America | Long term (≥4 years) |
| Source: Mordor Intelligence | |||
High Upfront Price of E-Buses vs Diesel
In Brazil and South Africa, the prices of electric buses remain significantly higher due to tariff barriers and the absence of local cell production, resulting in substantial purchase premiums. These elevated costs extend the payback periods, making the adoption of electric buses less financially viable for many operators. Additionally, municipal operators, often constrained by limited capital, face difficulties in meeting the higher down-payment requirements for electric buses compared to traditional diesel assets, further hindering the transition to cleaner transportation solutions.
Slow Depot and Public Charging Roll-Out
United States agencies are experiencing significant delays in establishing depot connections, which hampers the timely deployment of electric buses. In India, the lack of adequate charging infrastructure for electric buses has led to the adoption of mixed fleets, which complicates fleet management and reduces operational efficiency. Furthermore, the scarcity of public fast-charging infrastructure outside regions such as China and Europe forces operators to rely on larger battery capacities, which increases costs and operational challenges.
*Our forecasts treat driver/restraint impacts as directional, not additive. The impact forecasts reflect baseline growth, mix effects, and variable interactions.
Segment Analysis
By Propulsion Type: Battery-Electric Gains Scale
Internal-combustion platforms retained 71.23% of 2025 revenue, yet battery-electric buses are expanding at an 11.82% CAGR as ZEB mandates lock diesel out of new tenders. The battery-electric bus market is expected to experience significant growth in the coming years, becoming the most lucrative segment within the broader bus industry. Original Equipment Manufacturers (OEMs) are focusing on consolidating their cell supply chains to enhance efficiency and reduce costs. Companies like Yutong and BYD are adopting integrated production strategies to mitigate the impact of raw material price volatility. This approach provides them with a substantial cost advantage over their European competitors. As battery technology advances and real-world ranges improve, hybrids and plug-in hybrids are rapidly losing relevance. At the same time, fuel-cell buses remain a niche segment, with adoption constrained by the high costs of green hydrogen. Over the long term, diesel bus volumes are anticipated to decline, reflecting a structural shift in the market rather than a gradual diversification.
Electric-first strategies are transforming the economics of after-sales services. European manufacturers are now offering extended battery warranties, supported by advanced predictive maintenance systems that significantly reduce vehicle downtime. These systems leverage data analytics to optimize maintenance schedules and improve operational efficiency. Additionally, the adoption of Battery-as-a-Service (BaaS) contracts is transferring the risk of residual battery value from consumers to OEMs. However, this shift introduces challenges, as the lack of a mature secondary market for used batteries could pressure profit margins if not addressed in the near future.


By Deck Type: Single-Deck Core, Double-Deck Revival
Single-deck models accounted for 79.16% of revenue in 2025, driven by their universal fit across urban and intercity routes. Double-deck buses, however, are reviving with an 8.43% CAGR on tourism rebounds and premium express services, exemplified by London’s 500-unit electric order and Hong Kong’s 200 BYD deliveries. With advancements in battery technology, double-decker buses are increasingly gaining traction in the European tourist fleet market. Pantograph opportunity charging at terminals is addressing range limitations and generating interest among cities, expanding the appeal of double-deckers beyond their traditional areas of dominance.
However, technical challenges continue to hinder widespread adoption. The weight of the battery raises the vehicle's center of gravity, while height restrictions limit route options under certain bridges. Consequently, fleet planners must carefully evaluate the trade-offs between increased passenger capacity and operational flexibility, including considerations like route adaptability and depot infrastructure. These factors ensure that single-decker buses remain the cornerstone of the bus market throughout the forecast period.
By Application: Transit Dominates, School Buses Shift Fast
Transit accounted for 68.43% of revenue in 2025 and will stay the anchor of the bus market as city networks universalize all-electric procurement from 2027 onward. The school segment, however, is the fastest-growing, with an 8.23% CAGR, resulting in thousands of orders that Blue Bird and NFI compete to fill. Intercity electrification continues to face challenges, as current daily range capabilities still favor fuel cell technology. However, the development of hydrogen highways in countries such as Germany and South Korea suggests a potential shift in the market, particularly as refueling infrastructure becomes more widespread. Meanwhile, compact electric buses designed for corporate shuttles and airport circulators are gaining traction. These buses are specifically engineered to navigate confined spaces efficiently and operate for extended periods without requiring frequent refueling, making them ideal for such applications.
Initial concerns regarding the performance of batteries in extreme climates are gradually diminishing. Real-world examples from various regions have demonstrated the resilience and reliability of electric buses, even under challenging environmental conditions. This growing confidence in battery technology is paving the way for broader adoption of electric propulsion across diverse use cases. Once subsidies and incentives stimulate the initial wave of procurement, the transition to electric mobility is expected to accelerate significantly, driving normalization across the transportation sector.
By Seating Capacity: Mid-Size Sweet Spot, Small-Bus Uptake
Buses seating 31-50 passengers held 46.41% of the market in 2025, reflecting the commercial sweet spot between throughput and capital cost. Sub-30-seat units are trending at a 7.48% CAGR due to last-mile demand, microtransit pilots, and hotel-airport loops, where high frequency trumps size. The market for small-capacity buses is expected to experience significant growth in the coming years, although it will continue to be a niche segment within the broader bus market. Articulated units with over 50 seats face challenges due to the weight of batteries; however, advancements such as megawatt-scale pantographs being introduced in cities like Bogotá and Mexico City could revitalize this category by drastically reducing charging times and improving operational efficiency.
OEM modularity now enables buyers to customize seating configurations within a standardized body shell. This approach streamlines production processes and enhances the long-term value of these vehicles. Additionally, regulatory changes in regions such as Europe and Japan are making it easier for minibuses to be operated under car-license categories. This development is expanding the pool of eligible drivers and contributing to lower operational costs for fleet operators.
By Bus Length: 9-to-12 Meters Still Rule, Sub-9 Meters Boom
Standard 9-to-12-meter buses represented 48.28% of the 2025 bus market size and remain the most popular format for city routes worldwide. Compact sub-9-meter models, however, are rising at an 8.72% CAGR, a trend most visible in dense Asian and European cores where maneuverability outweighs seat count. In Latin American BRT systems, high-capacity articulated and bi-articulated buses, measuring over 12 meters in length, maintain a niche significance. However, the push for electrification faces hurdles. The current battery packs significantly increase curb weights, pushing them close to regulatory limits. Plans to install pantograph chargers in Bogotá and Mexico City in 2024 demonstrate a proactive approach to addressing these challenges and advancing the adoption of electric buses in the region.
Compact buses, despite higher per-seat costs, offer operational advantages that make them a valuable addition to urban transit networks. Operators benefit from reduced dwell times and improved schedule adherence, which enhance the overall efficiency and capacity of the network. Companies like Hino and Karsan are capitalizing on this demand by providing electric vehicles designed for historic city centers. These areas often have narrow streets and tight corners, making them unsuitable for larger double-deckers and 12-meter buses, thereby creating a unique market opportunity for smaller, more agile electric buses.
Geography Analysis
The Asia-Pacific region contributed 41.73% of the 2025 revenue. China leads with a significant electric fleet, while India's FAME-II scheme supports the deployment of buses in key states, including Maharashtra, Karnataka, and Delhi. Chinese OEMs offer competitively priced 12-meter electric buses due to their vertically integrated supply chains, covering everything from lithium sourcing to final assembly. In Japan and South Korea, intercity corridors are transitioning to electric, with notable contributions from domestic manufacturers. Meanwhile, ASEAN cities like Jakarta, Bangkok, and Hanoi face challenges related to grid reliability and diesel subsidies, which could delay achieving total cost of ownership (TCO) parity. As China's replacement cycle progresses, India's tender pipeline and ASEAN's development programs are expected to sustain the region's growth trajectory [3]“ASEAN Bus Electrification Pilot Projects,”, Asian Development Bank, adb.org.
The Middle East and Africa are expected to post the highest regional CAGR at 9.73%, Saudi Arabia's Vision 2030, the UAE's rollout of electric buses, Cairo's introduction of its first BYD units, and South Africa's award of a Gautrain tender under World Bank concessional terms, all underscore the continent's electric ambitions. Funded by oil revenues, these initiatives face a hurdle: grid upgrades. To mitigate peak demand challenges, many agencies are strategically coupling bus purchases with investments in solar generation and microgrids.
Europe has made significant progress in the adoption of electric vehicles, supported by substantial grants and policy measures. Diesel phase-outs in countries such as Norway, the Netherlands, and the UK underscore a strong commitment to achieving full electrification within the decade. The Clean Vehicles Directive provides a clear framework, encouraging member states to prioritize the procurement of zero-emission buses (ZEBs), thereby fostering a stable environment for OEM investments. North America, however, is advancing at a slower pace. Despite substantial funding for clean school buses, utilities face prolonged timelines for interconnections. Additionally, recent market disruptions, such as Proterra's bankruptcy, have forced agencies to re-bid contracts, often favoring established players like NFI and Blue Bird. South America presents a mixed scenario: while cities like Santiago and Bogotá operate some of the largest electric fleets outside China, economic instability in Argentina has led to tender cancellations, delaying the region's progress in scaling up electric mobility.

Competitive Landscape
The bus market is moderately fragmented. The top OEMs—Yutong, BYD, Volvo, Daimler, and Tata—hold a significant share of unit sales, leaving space for regional champions protected by local-content regulations. Chinese OEMs, leveraging battery supply control, maintain a substantial cost advantage. They've established dominance in key regions, securing a large portion of zero-emission tenders in Latin America and Africa. European brands are defending their market share with Battery-as-a-Service (BaaS) contracts, offering operators reduced capital outlays and integrating fixed energy costs into per-kilometer fees. In North America, startups that ventured into contract manufacturing often exited the market due to funding challenges. However, NFI Group capitalized on the situation, acquiring assets and order books to strengthen its leadership position on the continent. Meanwhile, Indian newcomer Switch Mobility has introduced a modular platform targeting buyers in Africa and Southeast Asia, offering competitive pricing that could intensify market competition. As the market evolves, differentiation now focuses on charging speed, battery resilience in cold climates, and predictive-maintenance software, which significantly reduces unplanned downtime.
Hydrogen is emerging as a promising alternative. Daimler and Hyundai are leading early highway pilots, while cell developers are working on advanced LFP chemistries that could significantly lower future pack costs. In an innovative approach, Blue Bird in California is monetizing idle school-bus batteries. Through vehicle-to-grid ancillary-service contracts, they are unlocking new revenue opportunities for fleet owners.
Bus Industry Leaders
BYD Company Ltd.
Yutong Bus Co., Ltd.
Daimler Truck Holding AG
Volvo AB
Tata Motors Limited
- *Disclaimer: Major Players sorted in no particular order

Recent Industry Developments
- December 2025: In a landmark deal, MAN Truck & Bus secured its largest-ever contract, committing to deliver over 3,000 buses to Deutsche Bahn in Germany from 2027 to 2032. Notably, a significant portion of these buses will be fully electric. The buses are set to serve regional transport needs across Germany, operated by DB Regio AG.
- December 2025: Deutsche Bahn, a prominent public transportation operator in Germany, has signed a framework agreement with BYD for the supply of 200 large battery-electric buses. The deal encompasses four versatile BYD bus models: the B12.b, B12.b LE, B13.b, and B15, all of which can be tailored for urban commuting and intercity passenger transport.
- March 2025: In Mexico, Volvo Buses has unveiled the Volvo 7800 Electric, marking the country's debut of an electric articulated and bi-articulated bus. This new electric bus, crafted on Volvo Buses' global electromobility Volvo BZR platform, is set to transform Mexico's Bus Rapid Transit systems, paving the way for a more efficient and sustainable public transport network.


Global Bus Market Report Scope
Hybrid and Electric Vehicles, ICE are covered as segments by Propulsion Type. Africa, Asia-Pacific, Europe, Middle East, North America, South America are covered as segments by Region.| Hybrid and Electric Vehicles | By Fuel Category | Battery Electric Vehicle |
| Fuel Cell Electric Vehicle | ||
| Hybrid Electric Vehicle | ||
| Plug-in Hybrid Electric Vehicle | ||
| Internal Combustion Engine | By Fuel Category | Diesel |
| Others |
| Single |
| Double |
| Transit Bus |
| Intercity Bus / Motorcoach |
| School Bus |
| Other Applications |
| Up to 30 seats |
| 31 - 50 seats |
| More than 50 seats |
| Up to 9 m |
| 9 - 12 m |
| More than 12 m |
| North America | United States |
| Canada | |
| Rest of North America | |
| South America | Brazil |
| Argentina | |
| Rest of South America | |
| Europe | Germany |
| United Kingdom | |
| France | |
| Italy | |
| Spain | |
| Rest of Europe | |
| Asia-Pacific | China |
| India | |
| Japan | |
| South Korea | |
| Rest of Asia-Pacific | |
| Middle East and Africa | United Arab Emirates |
| Saudi Arabia | |
| South Africa | |
| Turkey | |
| Rest of Middle East and Africa |
| By Propulsion Type | Hybrid and Electric Vehicles | By Fuel Category | Battery Electric Vehicle |
| Fuel Cell Electric Vehicle | |||
| Hybrid Electric Vehicle | |||
| Plug-in Hybrid Electric Vehicle | |||
| Internal Combustion Engine | By Fuel Category | Diesel | |
| Others | |||
| By Deck Type | Single | ||
| Double | |||
| By Application | Transit Bus | ||
| Intercity Bus / Motorcoach | |||
| School Bus | |||
| Other Applications | |||
| By Seating Capacity | Up to 30 seats | ||
| 31 - 50 seats | |||
| More than 50 seats | |||
| By Bus Length | Up to 9 m | ||
| 9 - 12 m | |||
| More than 12 m | |||
| By Region | North America | United States | |
| Canada | |||
| Rest of North America | |||
| South America | Brazil | ||
| Argentina | |||
| Rest of South America | |||
| Europe | Germany | ||
| United Kingdom | |||
| France | |||
| Italy | |||
| Spain | |||
| Rest of Europe | |||
| Asia-Pacific | China | ||
| India | |||
| Japan | |||
| South Korea | |||
| Rest of Asia-Pacific | |||
| Middle East and Africa | United Arab Emirates | ||
| Saudi Arabia | |||
| South Africa | |||
| Turkey | |||
| Rest of Middle East and Africa | |||


Market Definition
- Vehicle Type - The category includes Medium and Heavy Duty Buses.
- Vehicle Body Type - This include Bus category.
- Fuel Category - The category includes various fuel types such as Gasoline, Diesel, LPG (Liquefied Petroleum Gas), CNG (Compressed Natural Gas), HEV (Hybrid Electric Vehicles), PHEV (Plug-in Hybrid Electric Vehicles), BEV (Battery Electric Vehicles), and FCEV (Fuel Cell Electric Vehicles)
| Keyword | Definition |
|---|---|
| Electric Vehicle (EV) | A vehicle which uses one or more electric motors for propulsion. Includes cars, buses, and trucks. This term includes all-electric vehicles or battery electric vehicles and plug-in hybrid electric vehicles. |
| BEV | A BEV relies completely on a battery and a motor for propulsion. The battery in the vehicle must be charged by plugging it into an outlet or public charging station. BEVs do not have an ICE and hence are pollution-free. They have a low cost of operation and reduced engine noise as compared to conventional fuel engines. However, they have a shorter range and higher prices than their equivalent gasoline models. |
| PEV | A plug-in electric vehicle is an electric vehicle that can be externally charged and generally includes all-electric vehicles as well as plug-in hybrids. |
| Plug-in Hybrid EV | A vehicle that can be powered either by an ICE or an electric motor. In contrast to normal hybrid EVs, they can be charged externally. |
| Internal combustion engine | An engine in which the burning of fuels occurs in a confined space called a combustion chamber. Usually run with gasoline/petrol or diesel. |
| Hybrid EV | A vehicle powered by an ICE in combination with one or more electric motors that use energy stored in batteries. These are continually recharged with power from the ICE and regenerative braking. |
| Commercial Vehicles | Commercial vehicles are motorized road vehicles designed for transporting people or goods. The category includes light commercial vehicles (LCVs) and medium and heavy-duty vehicles (M&HCV). |
| Passenger Vehicles | Passenger cars are electric motor– or engine-driven vehicles with at least four wheels. These vehicles are used for the transport of passengers and comprise no more than eight seats in addition to the driver’s seat. |
| Light Commercial Vehicles | Commercial vehicles that weigh less than 6,000 lb (Class 1) and in the range of 6,001–10,000 lb (Class 2) are covered under this category. |
| M&HDT | Commercial vehicles that weigh in the range of 10,001–14,000 lb (Class 3), 14,001–16,000 lb (Class 4), 16,001–19,500 lb (Class 5), 19,501–26,000 lb (Class 6), 26,001–33,000 lb (Class 7) and above 33,001 lb (Class 8) are covered under this category. |
| Bus | A mode of transportation that typically refers to a large vehicle designed to carry passengers over long distances. This includes transit bus, school bus, shuttle bus, and trolleybuses. |
| Diesel | It includes vehicles that use diesel as their primary fuel. A diesel engine vehicle have a compression-ignited injection system rather than the spark-ignited system used by most gasoline vehicles. In such vehicles, fuel is injected into the combustion chamber and ignited by the high temperature achieved when gas is greatly compressed. |
| Gasoline | It includes vehicles that use gas/petrol as their primary fuel. A gasoline car typically uses a spark-ignited internal combustion engine. In such vehicles, fuel is injected into either the intake manifold or the combustion chamber, where it is combined with air, and the air/fuel mixture is ignited by the spark from a spark plug. |
| LPG | It includes vehicles that use LPG as their primary fuel. Both dedicated and bi-fuel LPG vehicles are considered under the scope of the study. |
| CNG | It includes vehicles that use CNG as their primary fuel. These are vehicles that operate like gasoline-powered vehicles with spark-ignited internal combustion engines. |
| HEV | All the electric vehicles that use batteries and an internal combustion engine (ICE) as their primary source for propulsion are considered under this category. HEVs generally use a diesel-electric powertrain and are also known as hybrid diesel-electric vehicles. An HEV converts the vehicle momentum (kinetic energy) into electricity that recharges the battery when the vehicle slows down or stops. The battery of HEV cannot be charged using plug-in devices. |
| PHEV | PHEVs are powered by a battery as well as an ICE. The battery can be charged through either regenerative breaking using the ICE or by plugging into some external charging source. PHEVs have a better range than BEVs but are comparatively less eco-friendly. |
| Hatchback | These are compact-sized cars with a hatch-type door provided at the rear end. |
| Sedan | These are usually two- or four-door passenger cars, with a separate area provided at the rear end for luggage. |
| SUV | Popularly known as SUVs, these cars come with four-wheel drive, and usually have high ground clearance. These cars can also be used as off-road vehicles. |
| MPV | These are multi-purpose vehicles (also called minivans) designed to carry a larger number of passengers. They carry between five and seven people and have room for luggage too. They are usually taller than the average family saloon car, to provide greater headroom and ease of access, and they are usually front-wheel drive. |


Research Methodology
Mordor Intelligence follows a four-step methodology in all its reports.
- Step-1: Identify Key Variables: To build a robust forecasting methodology, the variables and factors identified in Step-1 are tested against available historical market numbers. Through an iterative process, the variables required for market forecast are set and the model is built based on these variables.
- Step-2: Build a Market Model: Market-size estimations for the historical and forecast years have been provided in revenue and volume terms. Market revenue is calculated by multiplying the sales volume with their respective average selling price (ASP). While estimating ASP factors like average inflation, market demand shift, manufacturing cost, technological advancement, and varying consumer preference, among others have been taken into account.
- Step-3: Validate and Finalize: In this important step, all market numbers, variables, and analyst calls are validated through an extensive network of primary research experts from the market studied. The respondents are selected across levels and functions to generate a holistic picture of the market studied.
- Step-4: Research Outputs: Syndicated Reports, Custom Consulting Assignments, Databases & Subscription Platforms.


