
Brazil Reverse Logistics Market Size and Share
Market Overview
| Study Period | 2021 - 2032 |
|---|---|
| Forecast Data Period | 2027 - 2032 |
| Base Year Market Size (2026) | USD 2.99 Billion |
| Market Size (2027) | USD 3.22 Billion |
| Market Size (2032) | USD 4.62 Billion |
| Growth Rate (2027 - 2032) | 7.50 % |
| Market Concentration | Medium |
Major Players *Disclaimer: Major Players sorted in no particular order Image © Mordor Intelligence. Reuse requires attribution under CC BY 4.0. | |
Brazil Reverse Logistics Market Analysis by Mordor Intelligence
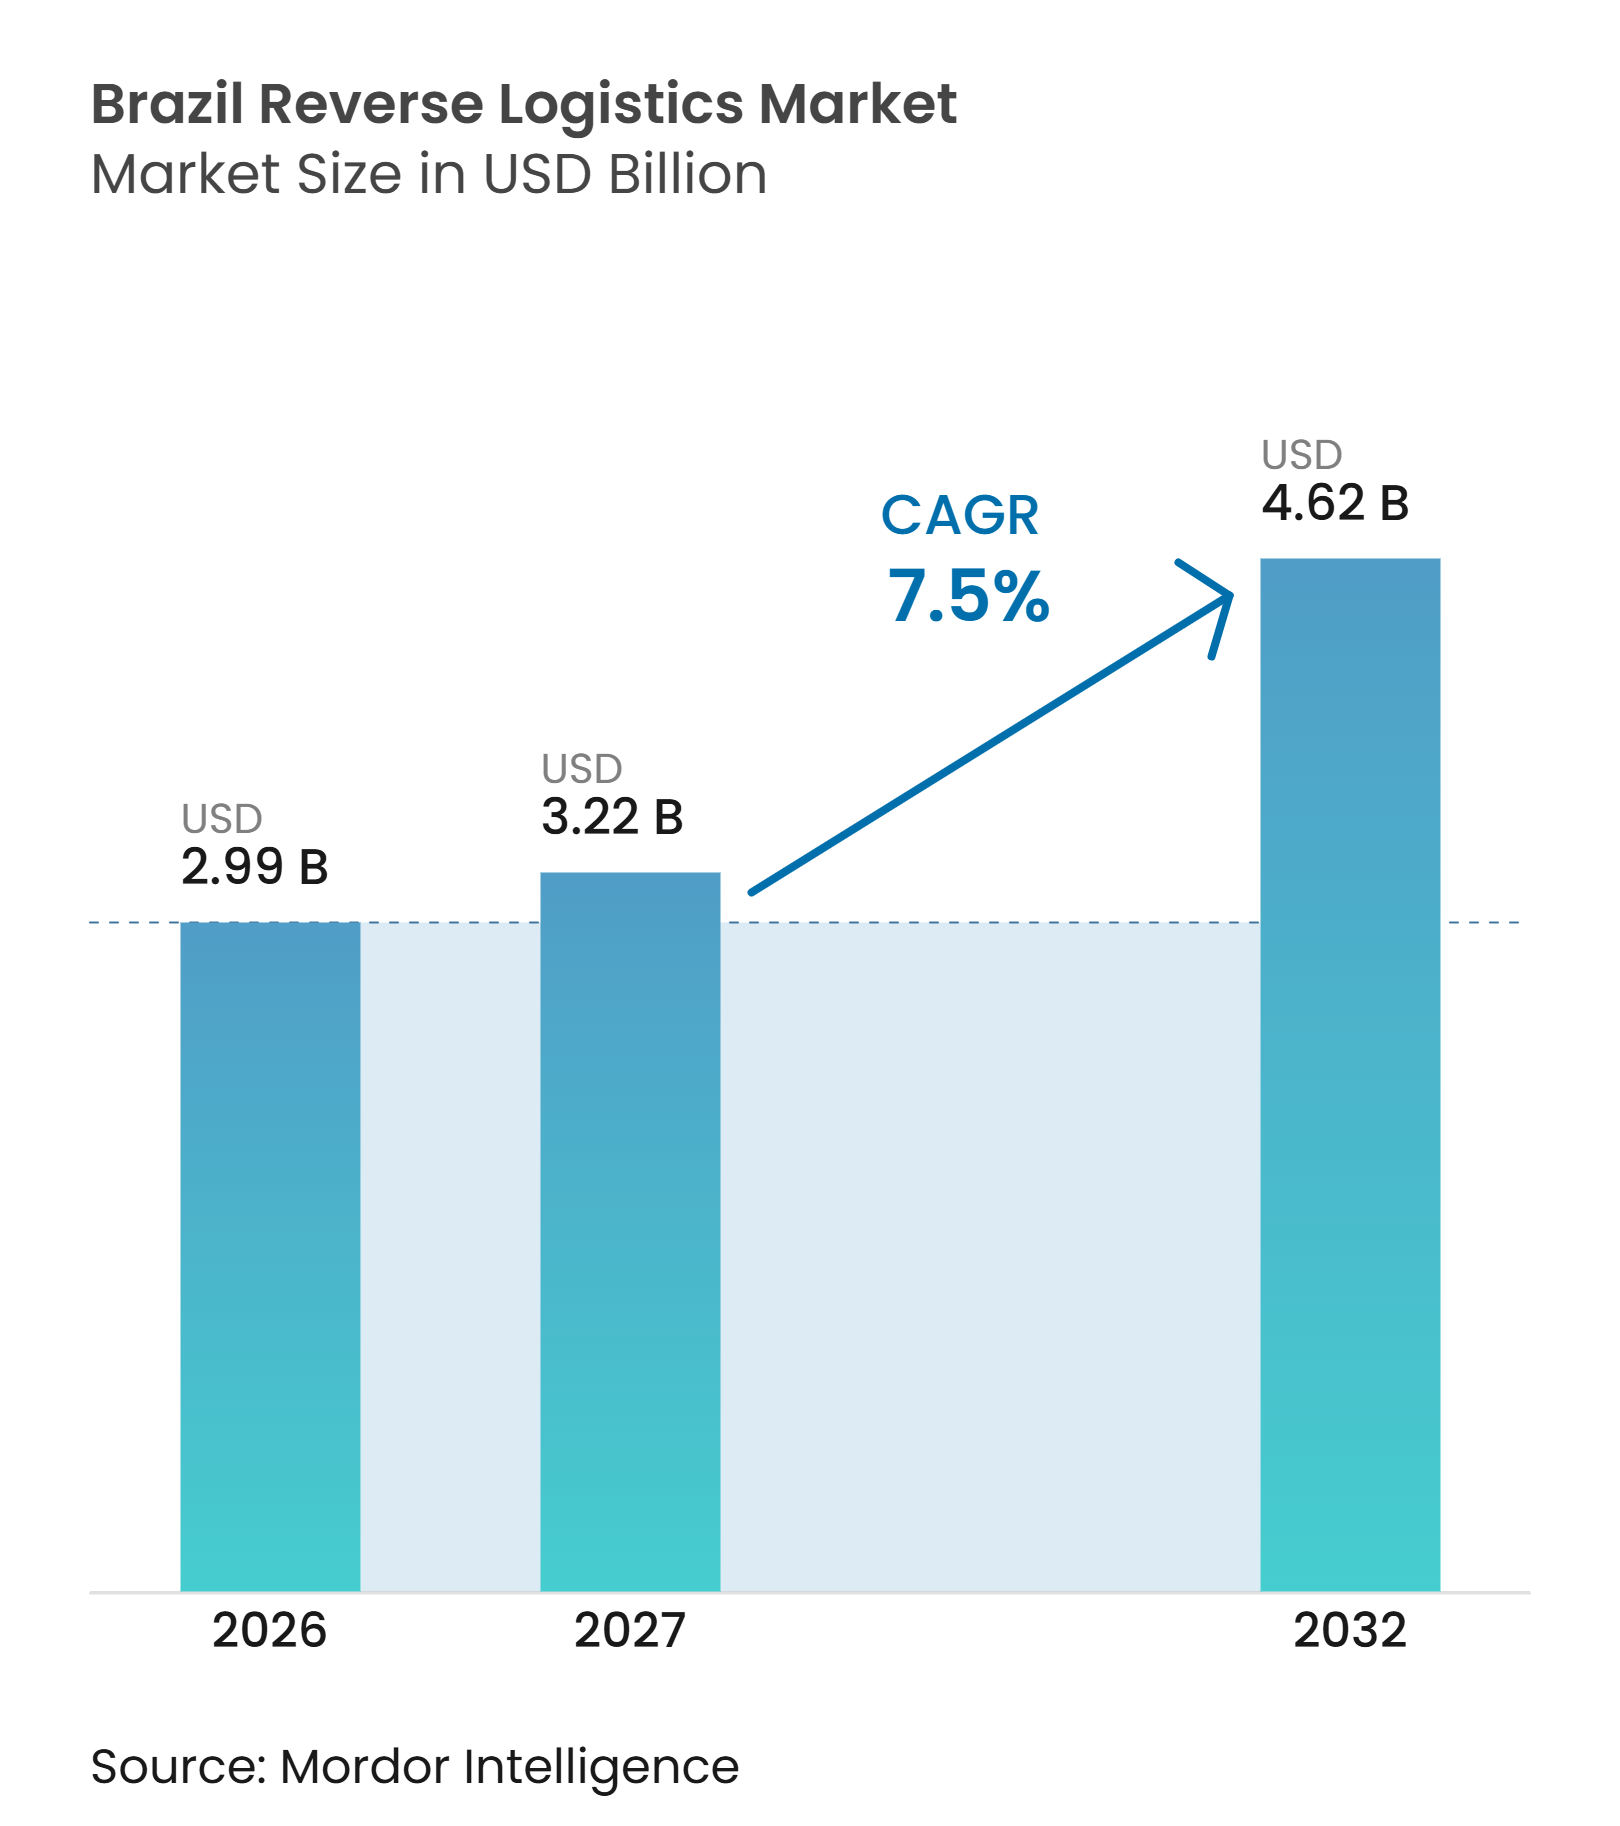
The Brazil reverse logistics market size is valued at USD 2.99 billion in 2026 and is estimated to grow from USD 3.22 billion in 2027 to reach USD 4.62 billion by 2032, at a CAGR of 7.50% during the forecast period 2027 to 2032.
The Brazil reverse logistics market is being shaped by a shift from simple returns collection toward services that recover value through grading, repair, resale, recycling, and controlled disposal. Federal packaging rules are making physical traceability and verified material destinations central to supplier selection, especially for large consumer goods companies. This is raising demand for operators that can combine collection coverage with warehouse controls and compliant reporting. Investments in pickup and drop-off networks, warehouse systems, and route optimization are improving returns economics in major corridors while also widening access in regional cities. The Brazil reverse logistics market therefore offers opportunities for providers that can manage both the cost of collection and the documentation required to prove recovery outcomes.
Key Report Takeaways
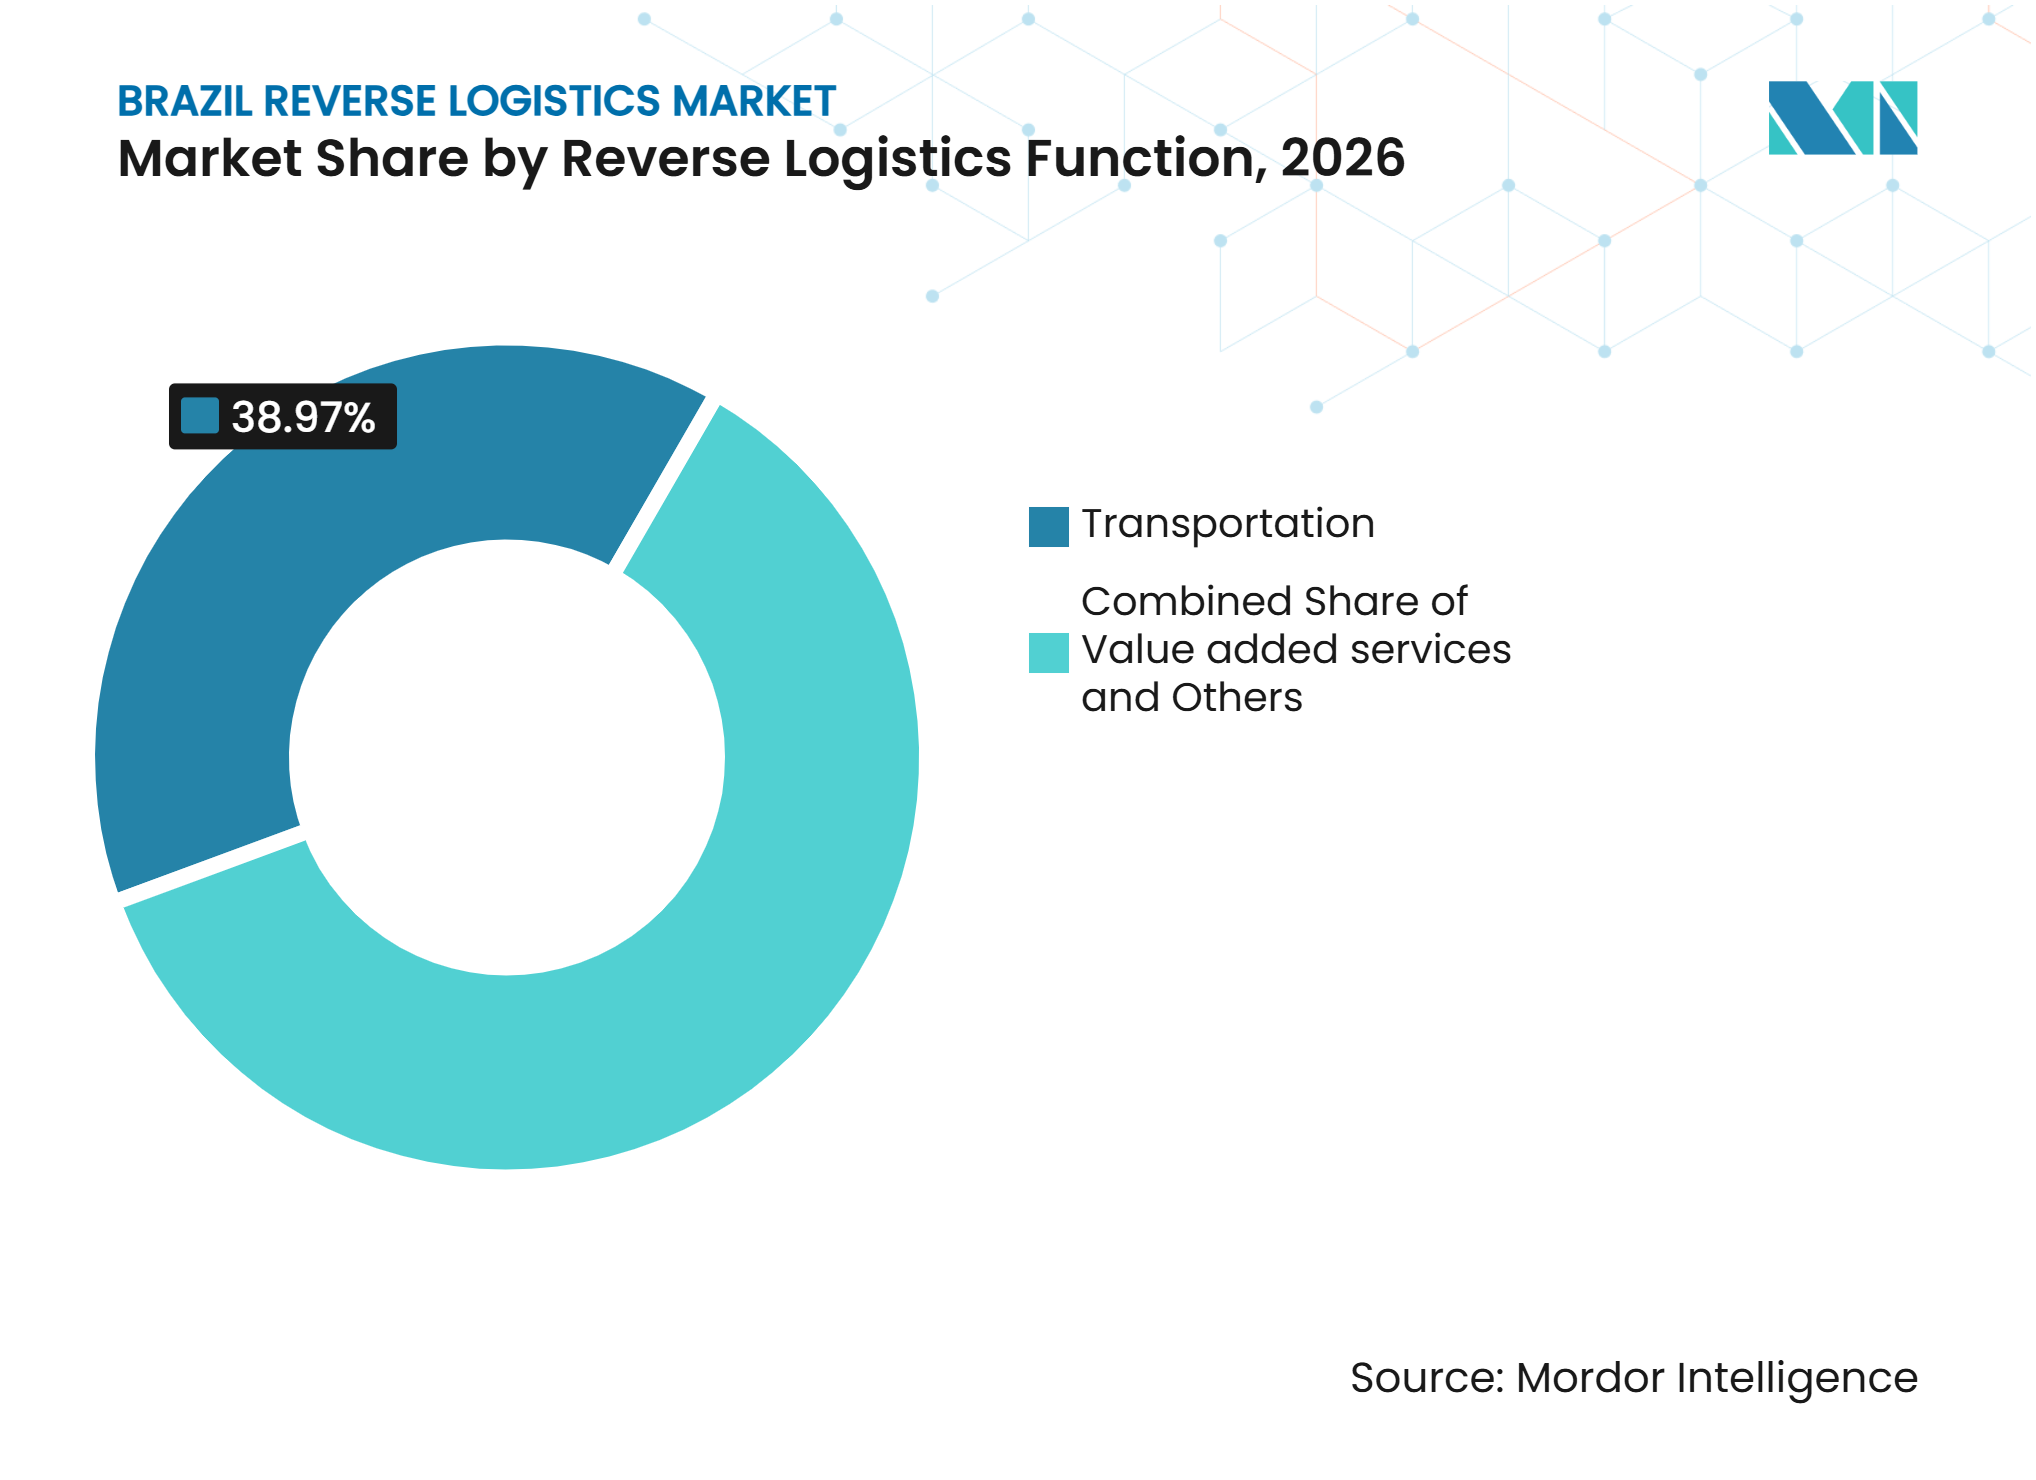
- By reverse logistics function, transportation accounts for 38.97% of the Brazil reverse logistics market share in 2026, while warehousing is forecast to register a 9.76% CAGR through 2032.
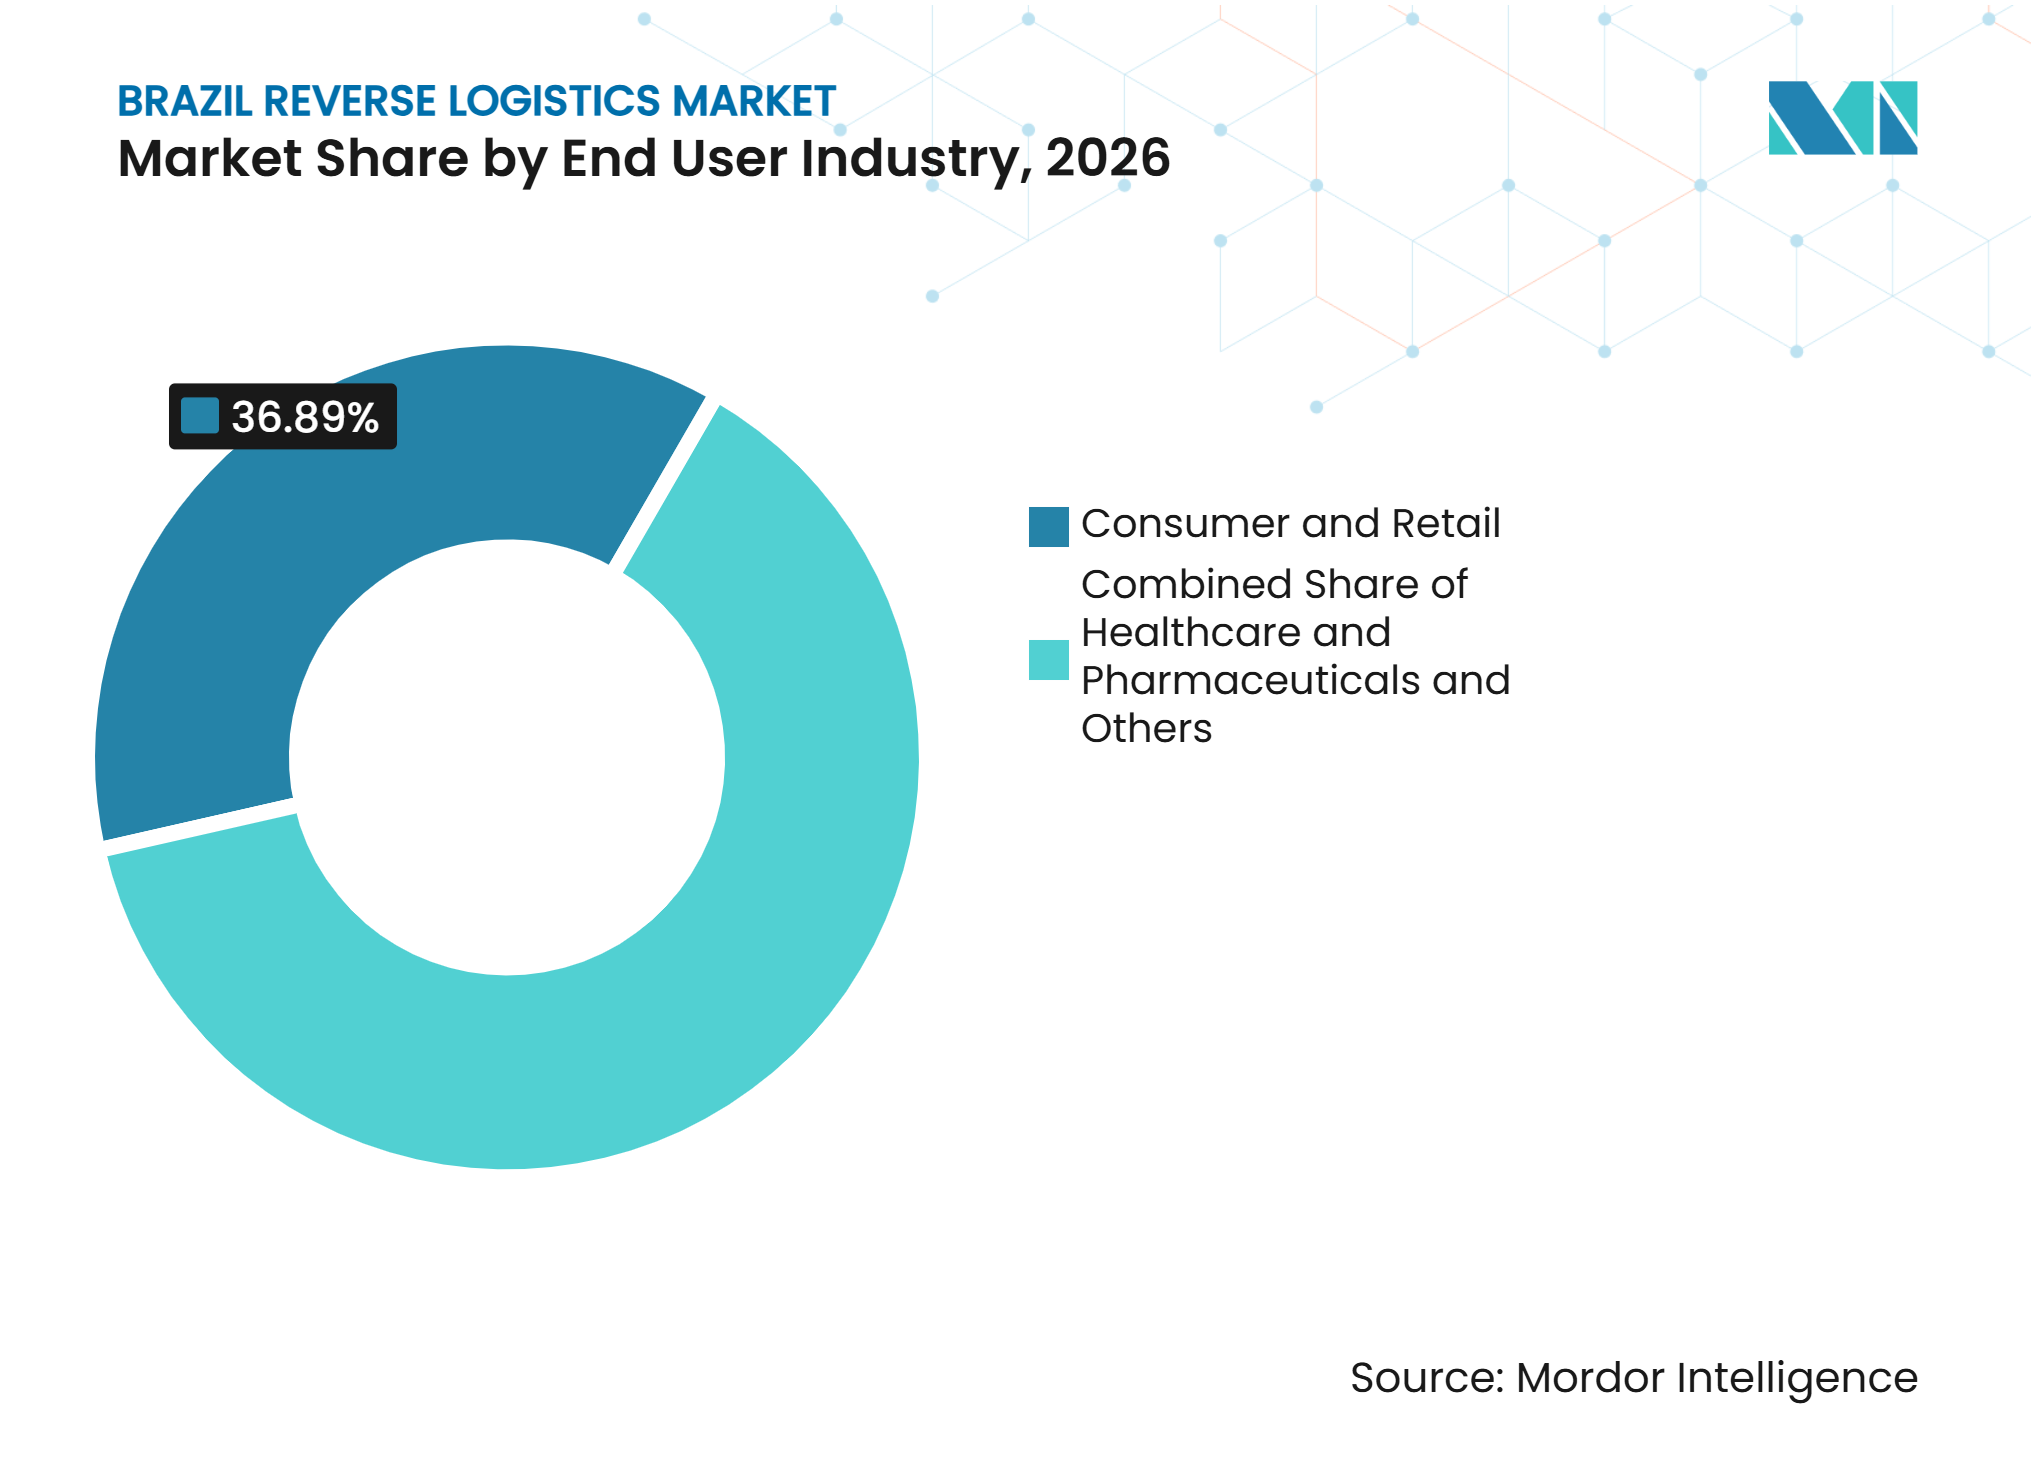
- By end-user industry, consumer and retail accounts for 36.89% of the Brazil reverse logistics market share in 2026, while healthcare and pharmaceuticals are forecast to register a 10.92% CAGR through 2032.
- By geography, Southeast Brazil accounts for 42.17% of Brazil reverse logistics share in 2026, while Northeast Brazil is forecast to register an 8.15% CAGR through 2032.
Note: Market numbers in this report are based on Mordor Intelligence's proprietary estimation framework, which combines nine months of actuals with Q4 projections for base year 2026.
Market Trends and Insights
Drivers Impact Analysis of Brazil Reverse Logistics Market*
| Driver | (~) % Impact on CAGR Forecast | Geographic Relevance | Impact Timeline |
|---|---|---|---|
| E-Commerce Returns Increasing Reverse Logistics Service Demand | +2.0% | National, density highest in Southeast and South | Short term (≤ 2 years) |
| Producer Responsibility Rules Strengthening Recovery Logistics Requirements | +1.5% | National, compliance burden highest in São Paulo and large-volume states | Medium term (2-4 years) |
| Recycling Credits Supporting Verified Reverse Flow Activities | +0.8% | National, spill-over to Northeast for CERE-eligible picker networks | Medium term (2-4 years) |
| Recommerce Growth Increasing Refurbishment and Resale Logistics | +1.0% | Southeast and South primarily, emergent in Northeast | Medium term (2-4 years) |
| PUDO Networks Improving Returns Collection Economics | +0.9% | National, with early gains in São Paulo, Paraná, Pernambuco, and Ceará | Short term (≤ 2 years) |
| SINIR Digitization Strengthening Reverse-Flow Traceability | +0.7% | National | Medium term (2-4 years) |
| Source: Mordor Intelligence | |||
E-Commerce Returns Increasing Reverse Logistics Service Demand
E-commerce is making returned merchandise a recurring operating issue for retailers and logistics providers in the Brazil reverse logistics market. Fashion, footwear, and children’s products generate frequent returns because fit, product expectations, and purchase decisions can differ after delivery. This volume pushes retailers to treat returns as a service line with direct effects on customer retention and working capital. Providers that combine digital return authorization with physical collection can reduce the steps required from shoppers and store staff. The need is strongest in dense consumer markets, where returns can be consolidated into predictable collection routes. It also supports investment in sorting, grading, restocking, and disposition processes that can separate resalable goods from items requiring another recovery path.
PUDO Networks Improving Returns Collection Economics
Pickup and drop-off networks are improving collection economics by consolidating parcels at fixed local points rather than relying solely on home pickup. Total Express moved more than 4 million packages through its pickup, delivery, and return points in 2025, showing the operational scale available through shared physical networks. The company was adding around 100 points each month and had reached 1,235 locations in 338 cities across 15 states. These networks lower the collection burden for smaller brands that cannot justify dedicated return routes. They are particularly relevant where residential density is lower and door-to-door collections are expensive. The same points can support consumer resale transactions, which link returns infrastructure with recommerce activity.
Producer Responsibility Rules Strengthening Recovery Logistics Requirements
Federal Decree No. 12,688 established mandatory reverse-logistics obligations for plastic packaging in October 2025[1]. The decree set a first-year national recovery target of 32% and a recycled-content target of 22% from January 2026 for large companies. Manufacturers, importers, distributors, and retailers must finance and operate systems that connect packaging to certified recycling outcomes. This expands the addressable workload beyond transportation because service providers must organize collection, documentation, and final material destination. The rules favor firms with established relationships across collection and recycling networks. They also make compliance capability more relevant when large customers select logistics partners.
Recycling Credits Supporting Verified Reverse Flow Activities
Recycling credits give companies a mechanism to document eligible recovery activity under Brazil’s reverse-logistics framework. Their usefulness depends on accurate measurement of material flows and on the credibility of the organizations that verify recovery. This creates a practical role for providers that can connect collection records with certified end destinations. The approach can help extend recovery systems into states where waste-picker networks are active but formal logistics coverage remains uneven. It also directs attention toward packaging streams that can be measured and traced consistently. This can support revenue from documentation and compliance services across the Brazil reverse logistics market alongside physical handling.
Restraints Impact Analysis of Brazil Reverse Logistics Market*
| Restraint | (~) % Impact on CAGR Forecast | Geographic Relevance | Impact Timeline |
|---|---|---|---|
| Uneven Recycling Infrastructure Limiting Recovery Network Efficiency | -0.8% | North, Northeast, and interior municipalities nationally | Long term (≥ 4 years) |
| Low-Density Returns Increasing Collection and Repositioning Costs | -0.7% | Non-metropolitan Brazil, most acute in North and Central-West | Medium term (2-4 years) |
| Regulatory Complexity Increasing Reverse Logistics Documentation Burden | -0.5% | National | Medium term (2-4 years) |
| Fragmented Regional Networks Limiting Backhaul Coordination Efficiency | -0.6% | Beyond the São Paulo-Rio de Janeiro axis, South and Northeast secondary hubs | Long term (≥ 4 years) |
| Source: Mordor Intelligence | |||
Uneven Recycling Infrastructure Limiting Recovery Network Efficiency
Recycling capacity is not distributed evenly across Brazil, which limits the efficiency of formal recovery systems outside the most developed corridors. The Southeast has established sorting and recycling networks, while many northern and interior municipalities have fewer certified endpoints. This can require materials to travel long distances before a compliant final destination is reached. The added transport raises costs and weakens the business case for low-value materials. It also makes it harder for obligated companies to demonstrate a continuous physical chain from collection to recovery. Providers with integrated collection and recycling relationships can have an advantage in the Brazil reverse logistics market where local endpoint capacity is limited.
Low-Density Returns Increasing Collection and Repositioning Costs
Low return density remains a major cost constraint in secondary cities and remote regions. A dedicated collection route is difficult to support when parcel volumes do not cover vehicle, labor, and repositioning costs. This makes forward-route backhaul coordination important, but that coordination is not consistently available across the country. The issue is most acute in the North and Central-West, where long distances and weaker road coverage increase collection complexity. Digital freight tools can improve route matching, although their benefits depend on the presence of carriers and usable transport data. As e-commerce reaches more municipalities, formal reverse flows may take time to match the distribution reach of forward deliveries.
*Our forecasts treat driver/restraint impacts as directional, not additive. The impact forecasts reflect baseline growth, mix effects, and variable interactions.
Brazil Reverse Logistics Market Segment Analysis
By Reverse Logistics Function:
Warehousing Investment Rebalances Return ProcessingTransportation accounts for 38.97% of Brazil reverse logistics share in 2026. Transportation leads because dispersed returns must be collected and moved to consolidation, repair, resale, recycling, or disposal points. Road freight remains central to the Brazil reverse logistics market because domestic freight relies heavily on road routes. The Road sub-segment therefore carries the principal share of collection activity for consumer and business returns. Air freight has a specialized role in the handling of rejected cross-border e-commerce consignments. FreteGlobal processed more than 160,000 rejected international shipments through its reverse-logistics operation at Viracopos International Airport in its first year of operation in 2025. Other value-added services remain smaller but include return processing, restocking, refurbishment, and compliant disposition. These services become more important in the Brazil reverse logistics market when customers need proof that a product or material reached its intended recovery destination.
Warehousing is forecast to grow at a 9.76% CAGR through 2032. Warehousing is growing because returned items need assessment before a company can decide whether to resell, repair, recycle, or dispose of them. In this part of the Brazil reverse logistics market, storage is increasingly paired with quality checks, grading, restocking, and controlled disposition. Jadlog committed BRL 100 million (USD 18.07 million) to a distribution center in Perus, São Paulo, intended to centralize and accelerate reprocessing activities[2]. The facility was expected to begin operations in the first half of 2026. JSL spun off its warehousing and intralogistics unit as Intralog in April 2026, reflecting the commercial importance of warehouse-based services. The unit represented BRL 2 billion (USD 361.30 million) in annual revenue and grew 17% in 2025. Digital warehouse controls can also support the records customers need for reverse-flow reporting. These factors explain why providers are building facilities that focus on value recovery rather than simple temporary storage.



By End-User Industry:
Healthcare Returns Accelerate Specialized DemandConsumer and retail accounts for 36.89% of Brazil reverse logistics size in 2026. Consumer and retail activity is connected to frequent online purchase returns, particularly in fashion and footwear. The volume creates recurring demand across the Brazil reverse logistics market for collection, consolidation, product checking, and restocking. Home and decor is a relevant secondary area because bulky returns require transport planning and careful damage assessment. FMCG requirements are also expanding as packaging rules connect consumer-goods companies to documented recycling channels. Automotive, electronics, and industrial customers add more specialized return flows that may require separate handling, assessment, or recovery pathways. Providers that serve several categories can use shared infrastructure while maintaining category-specific controls.
Healthcare and pharmaceuticals are forecast to advance at a 10.92% CAGR through 2032. Healthcare and pharmaceuticals are growing quickly because medicines, diagnostic equipment, and medical components require more controlled return processes. Brazil’s pharmaceutical reverse-logistics framework is anchored in Decree No. 10,388/2020, which established a national system for the return and environmentally appropriate disposal of household medicines. DHL Supply Chain began managing the national logistics chain for GE HealthCare Brazil in April 2025, including reverse logistics for diagnostic-equipment parts. The operation processes around 2,000 return invoice notes each month from hubs in Barueri and Extrema, using road and air transport as required. This work involves parts such as MRI components, CT scanner modules, and surgical arcs, which adds operational and documentation demands. Andreani Logística handled more than 329 tons of healthcare returns in 2025 through road and air operations[3]. These requirements make specialized processes and multi-state coordination more important than in standard parcel returns.

Geography Analysis
Southeast Brazil accounts for 42.17% of Brazil reverse logistics market share in 2026. Its scale reflects concentrated consumer activity, industrial production, and logistics assets in São Paulo and adjacent municipalities. Southeast ports moved nearly 700 million tons in 2025, up 7.52% from the prior year. Fulfillment clusters in Cajamar allow operators to share facilities for sorting, inspection, restocking, and controlled disposition. DHL Express has allocated BRL 118 million (USD 21.32 million) to a planned modular hub in the São Paulo metropolitan area, designed to expand capacity in 2 phases.
Northeast Brazil is forecast to register an 8.15% CAGR through 2032. Industrial warehouse inventory reached 3.09 million m² by the second quarter of 2025, after 434,000 m² were delivered across the preceding 4 quarters[4]. The region has surpassed the South as Brazil’s second-largest regional warehouse market. Ports in Suape and Pecém can support containerized return cargo and backhaul routes. Jadlog uses neighborhood merchants to extend pickup and drop-off access in Bahia, Pernambuco, and Ceará.
The South, Central-West, and North broaden demand beyond the coastal centers. South warehouse vacancy of 2.7% limits space for return-processing operations, while the Central-West is linked to agricultural packaging take-back needs. The North has limited certified processing capacity, but container-port volumes grew at 7.4% annually from 2019 to 2025. Cabotage can aggregate dispersed flows before they move to recovery facilities, while compliance rules still require a documented endpoint in the Brazil reverse logistics market.
Competitive Landscape
Market Concentration
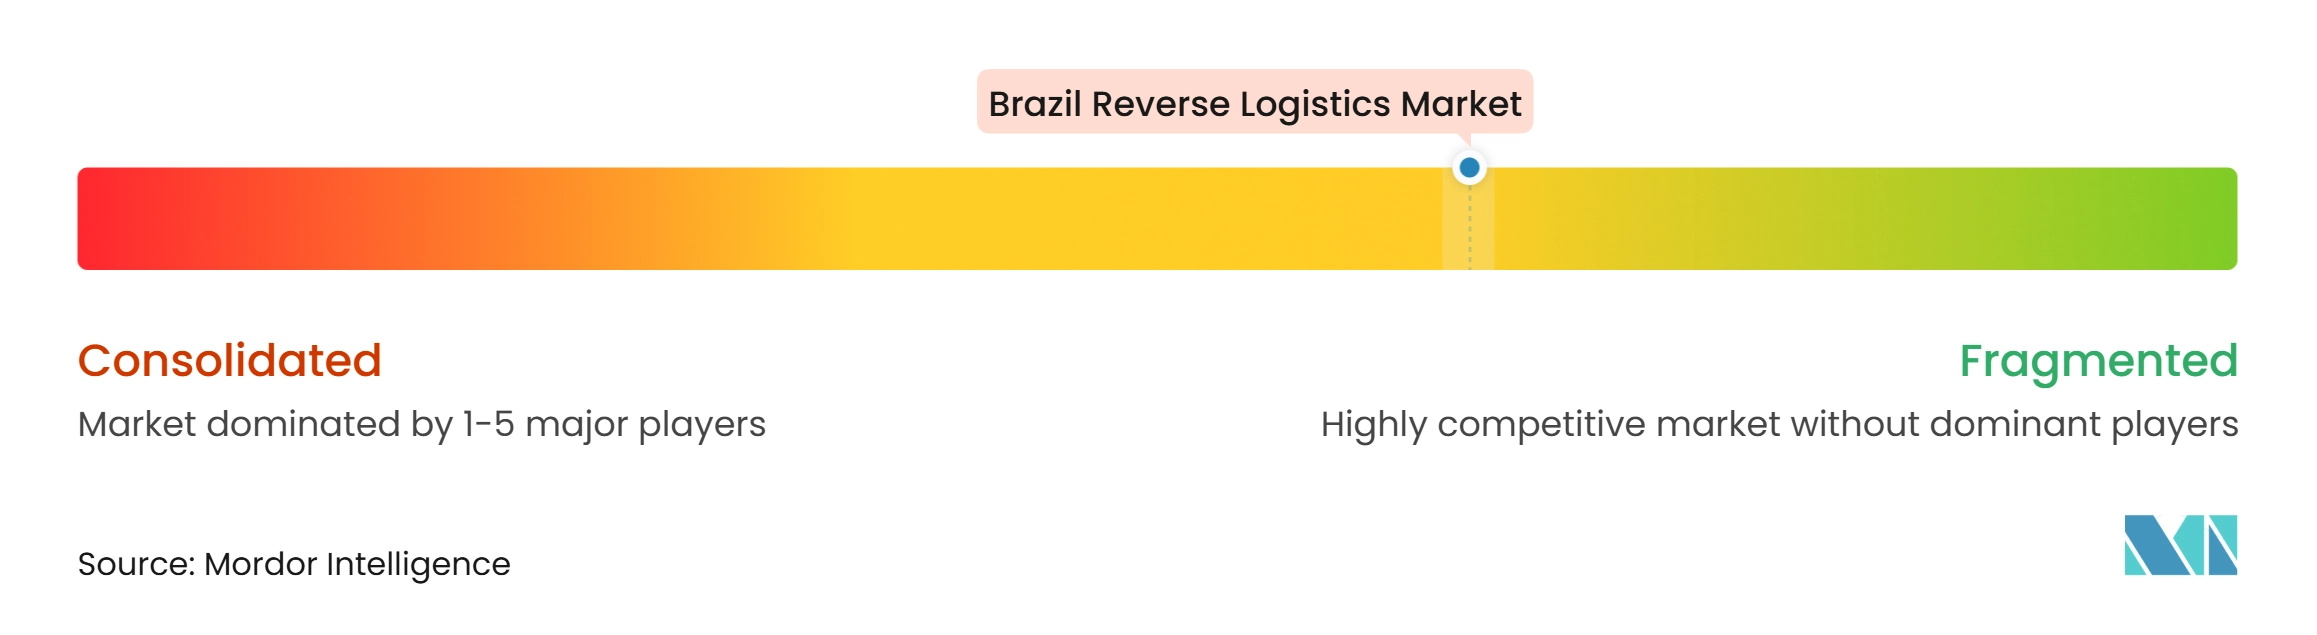
The Brazil reverse logistics market is moderately fragmented because global 3PLs, domestic carriers, environmental specialists, and technology-focused providers serve different parts of the value chain. DHL Supply Chain, CEVA Logistics, DSV, and Kuehne+Nagel can include reverse services within broader supply-chain contracts for multinational customers. Jadlog and Total Express compete through collection coverage and pickup and drop-off networks. GM&C Logística Reversa e Reciclagem, Brasil Reverso, and Loop Logística Reversa focus on regulatory knowledge, certified disposition partnerships, and material-destination reporting.
JSL Digital connects more than 200,000 registered carriers through a platform that supports tracking, payment automation, and backhaul optimization. The platform reported 66.5% revenue growth through the third quarter of 2026. Its route-matching capability can reduce empty vehicle movements that increase the cost of reverse collections. CEVA Logistics signed a contract with Iveco Group for a 20,000 m² parts distribution center in Pouso Alegre, Minas Gerais, with a wireless warehouse management system for real-time parts traceability. Operations began in April 2026, replacing a constrained site in Sorocaba.
DHL Supply Chain’s GE HealthCare arrangement shows how providers can win business by managing controlled equipment returns rather than only parcel collections. The service coordinates national flows of diagnostic-equipment parts using road and air transport from hubs in Barueri and Extrema. Jadlog’s neighborhood merchant network extends returns access without relying on a dedicated branch in every area. Smaller specialists can compete where customers prioritize auditable disposal and regulatory documentation.
Brazil Reverse Logistics Industry Leaders
-
Correios
-
DHL Group
-
Ambipar Environment
-
JSL SA
-
Luft Logistics
- *Disclaimer: Major Players sorted in no particular order
Brazil Reverse Logistics Market Companies Covered in this Report
- Correios
- DHL Group
- Ambipar Environment
- JSL SA
- Luft Logistics
- Total Express
- Jadlog
- CEVA Logistics
- ID Logistics
- Sequoia Logistica e Transportes SA
- DSV A/S
- Kuehne+Nagel International AG
- FedEx
- United Parcel Service Inc.
- Penske Logistics
- GM&C Logistica Reversa e Reciclagem
- Brasil Reverso
- Lorene
- Logam Brasil
- Conecta Cargo
- Loop Logistica Reversal
- Eloverde
Recent Industry Developments in Brazil Reverse Logistics Market
- October 2026: DHL Express announced a BRL 270 million (USD 48.78 million) investment plan to nearly double its retail presence in Brazil from 42 to 75 stores by 2030, with particular focus on the Northeast. A separate BRL 118 million (USD 21.32 million) allocation is earmarked for a planned modular hub in the São Paulo metropolitan area, designed in 2 phases to allow capacity expansion as e-commerce return volumes increase.
- October 2026: Jadlog expanded its nationwide pickup-and-drop-off (PUDO) network to 5,500 service points, including franchises and partner establishments offering parcel collection, pickup, and returns. The expansion strengthened Brazil's reverse logistics infrastructure by improving consumer access to product-return services and supporting more efficient consolidation of returned shipments.
- April 2026: JSL SA spun off its warehousing and intralogistics unit as Intralog, a standalone company representing approximately BRL 2 billion (USD 361.30 million) in annual revenue, the fastest-growing division within JSL, registering 17% expansion in 2025. Intralog positions JSL to pursue dedicated 3PL warehousing and intralogistics contracts independently of the carrier's transportation operations.
- November 2025: CEVA Logistics signed a contract with Iveco Group to operate a new 20,000 m² Parts Distribution Center in Pouso Alegre, Minas Gerais, backed by a BRL 93 million (USD 16.79 million) Iveco investment. The facility deploys a wireless warehouse management system for real-time parts-movement traceability, with operations commencing in April 2026 to replace a capacity-constrained site in Sorocaba, São Paulo.
Brazil Reverse Logistics Market Report Scope
Segmentation Overview
| Transportation | Road |
| Air | |
| Other Modes | |
| Warehousing (Storage, Distribution, Consolidation) | |
| Other Value-added Services (Return Processing, Restocking, Refurbishment, Disposition) |
| Consumer and Retail |
| Home and Decor |
| Healthcare and Pharmaceuticals |
| FMCG |
| Other End Users |
| North |
| Northeast |
| Central-west |
| Southeast |
| South |
| By Reverse Logistics Function | Transportation | Road |
| Air | ||
| Other Modes | ||
| Warehousing (Storage, Distribution, Consolidation) | ||
| Other Value-added Services (Return Processing, Restocking, Refurbishment, Disposition) | ||
| By End-user Industry | Consumer and Retail | |
| Home and Decor | ||
| Healthcare and Pharmaceuticals | ||
| FMCG | ||
| Other End Users | ||
| By Region | North | |
| Northeast | ||
| Central-west | ||
| Southeast | ||
| South |
Key Questions Answered in the Report
What is the forecast for Brazil reverse logistics through 2032?
The sector is forecast to increase from USD 3.22 billion in 2027 to USD 4.62 billion by 2032, at a 7.50% CAGR.
Which reverse logistics function leads in Brazil?
Transportation leads with a 38.97% share in 2026, while warehousing has the fastest projected growth at a 9.76% CAGR through 2032.
Why are pickup and drop-off points important for returns in Brazil?
They consolidate parcels at local locations and can reduce the cost of door-to-door collection, particularly in lower-density areas.
Which end-user segment is growing fastest in Brazil reverse logistics?
Healthcare and pharmaceuticals are forecast to register a 10.92% CAGR through 2032, supported by controlled returns for medicines and medical equipment.
Which Brazilian region has the largest reverse logistics presence?
Southeast Brazil leads with a 42.17% share in 2026 because it combines consumer demand, industry, ports, and established processing infrastructure.
What compliance issue is shaping reverse logistics services in Brazil?
Plastic-packaging rules require documented recovery systems and verified results, increasing the value of traceability and certified material destinations.