Brazil Data Center Rack Market Size and Share
Market Overview
| Study Period | 2020 - 2031 |
|---|---|
| Forecast Data Period | 2026 - 2031 |
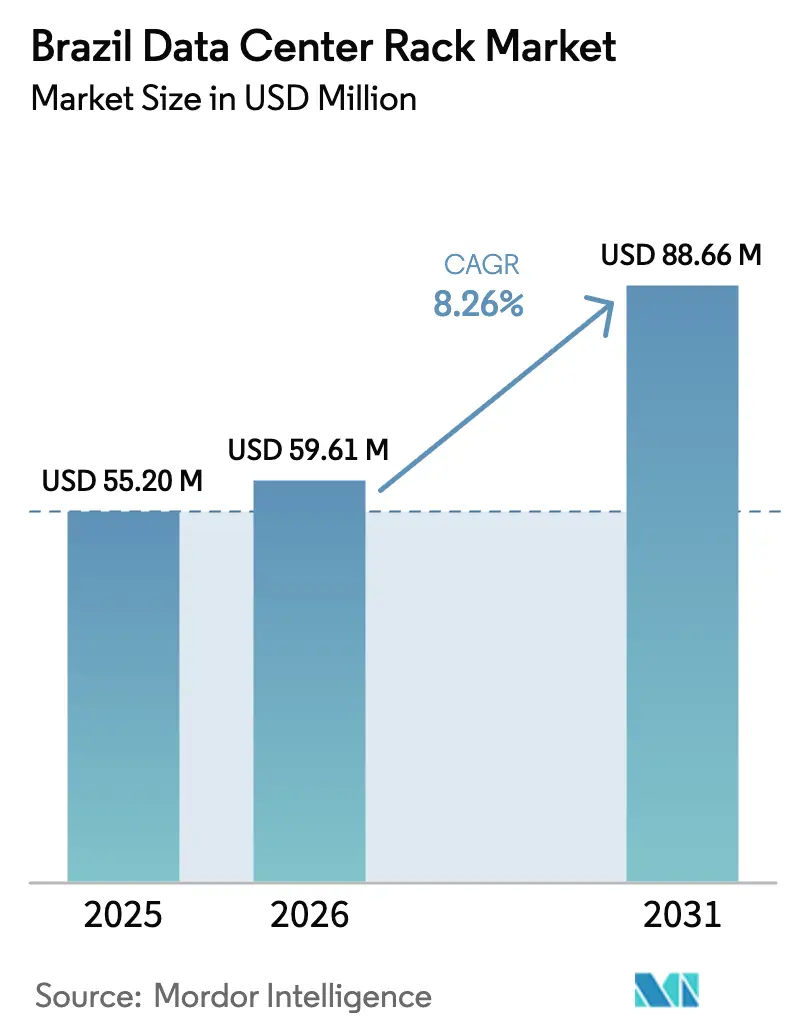
| Base Year Market Size (2025) | USD 55.20 Million |
| Market Size (2026) | USD 59.61 Million |
| Market Size (2031) | USD 88.66 Million |
| Growth Rate (2026 - 2031) | 8.26% CAGR |
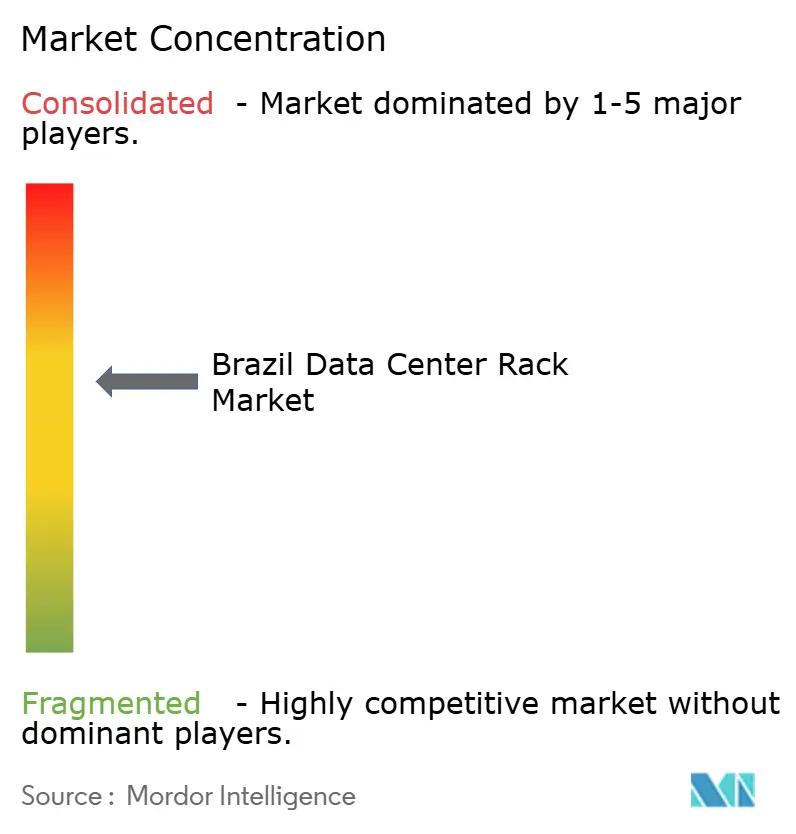
| Market Concentration | Medium |
Major Players *Disclaimer: Major Players sorted in no particular order Image © Mordor Intelligence. Reuse requires attribution under CC BY 4.0. | |
Brazil Data Center Rack Market Analysis by Mordor Intelligence
The Brazil data center rack market size is expected to increase from USD 55.20 million in 2025 to USD 59.61 million in 2026 and reach USD 88.66 million by 2031, growing at a CAGR of 8.26% over 2026-2031. The trajectory reflects sustained hyperscaler capex, sovereign-cloud mandates, and rapid edge build-outs that together tighten supply, lift average rack density, and favor enclosed cabinets designed for liquid cooling. Operators are front-loading orders to beat port congestion and steel surcharges, while PADIS 2026 and REDATA tax incentives support local assembly and energy-efficient designs. Competitive intensity remains moderate as Schneider Electric, Vertiv, Eaton, and Rittal maintain installed-base stickiness, yet Dell Technologies’ vertically integrated server-plus-rack bundles and domestic assemblers leveraging tax credits are shifting share toward locally produced options.
Key Report Takeaways
- By rack type, enclosed cabinets held 77.33% of the Brazil data center rack market share in 2025 and are expanding at a 9.31% CAGR through 2031.
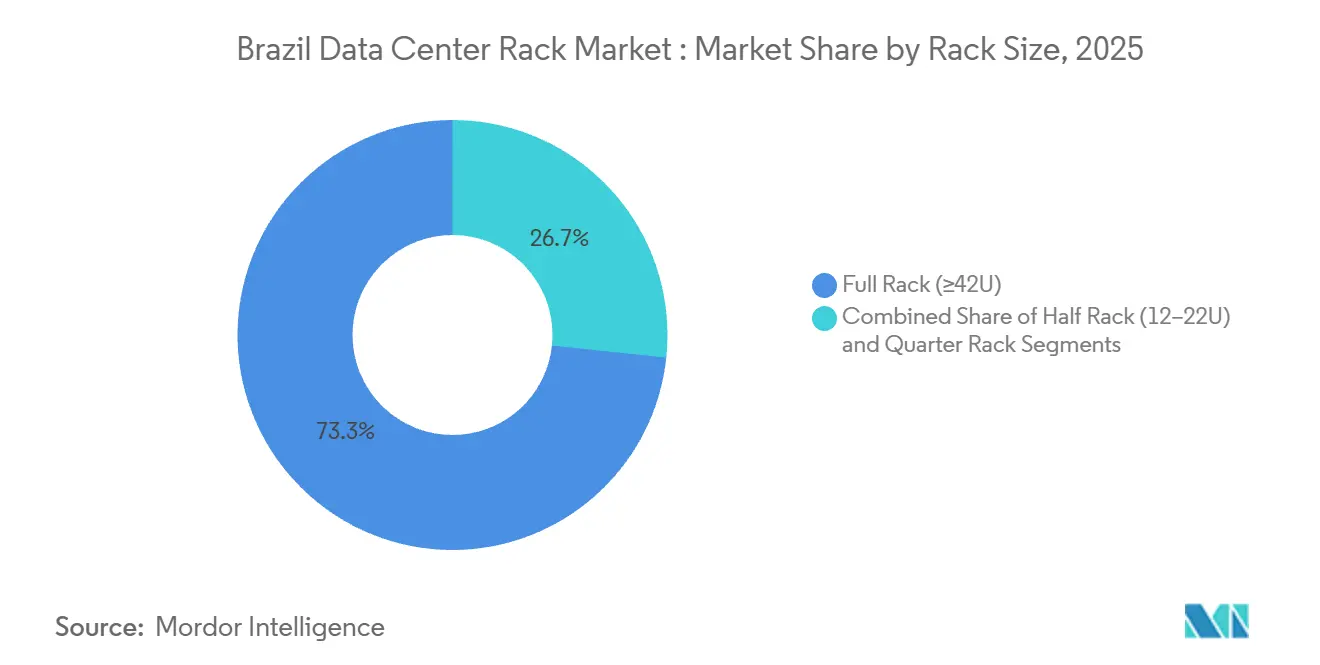
- By rack size, full racks captured a 73.32% share in 2025, while half racks are poised to grow at a 9.23% CAGR between 2026-2031.
- By tier classification, Tier 3 installations accounted for 54.21% of share in 2025; Tier 4 is forecast to post the highest growth at a 9.56% CAGR through 2031.
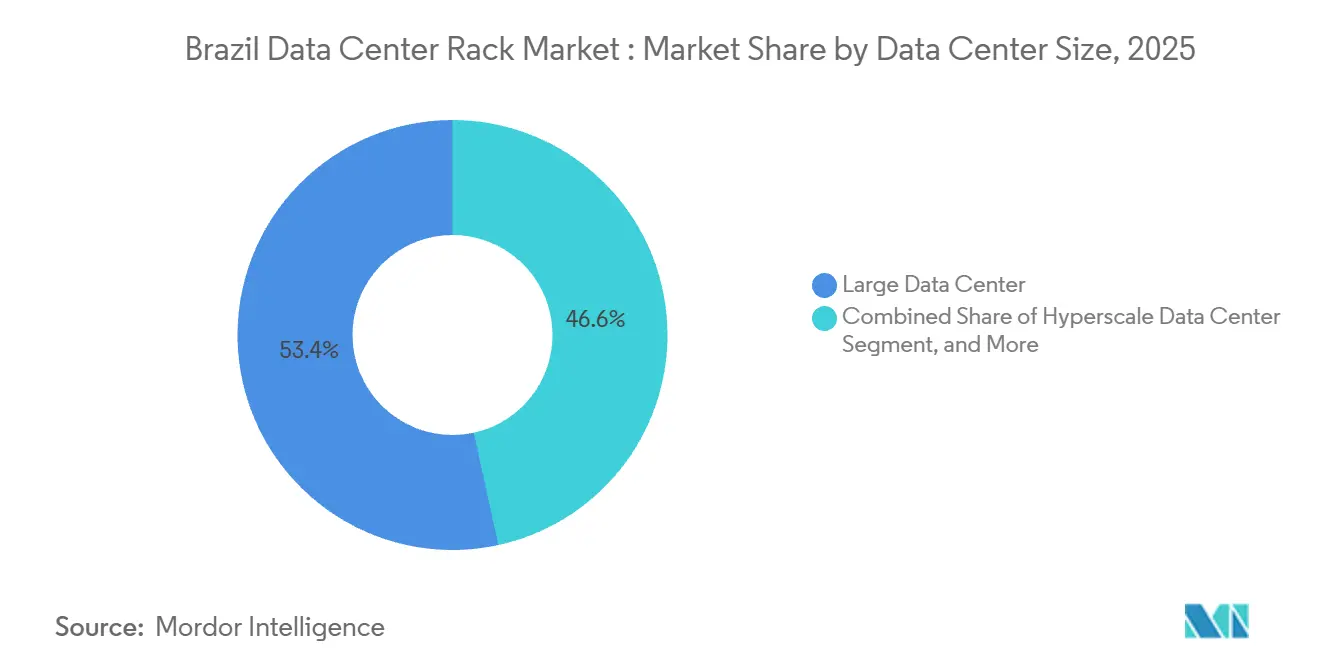
- By data center size, large facilities accounted for 53.42% of the market share in 2025, whereas hyperscale builds are projected to grow at a 9.89% CAGR through 2031.
- By data-center type, colocation sites led with 52.53% share in 2025, while hyperscaler and cloud-service-provider captive locations are set to rise at a 9.71% CAGR over 2026-2031.
Note: Market size and forecast figures in this report are generated using Mordor Intelligence’s proprietary estimation framework, updated with the latest available data and insights as of January 2026.
Competitive positioning in Brazil reflects both domestic market structures and the presence of firms operating internationally. The market landscape study of the global data center rack industry shows how these players are arranged across regions.
Brazil Data Center Rack Market Trends and Insights
Drivers Impact Analysis*
| Driver | (~) % Impact on CAGR Forecast | Geographic Relevance | Impact Timeline |
|---|---|---|---|
| Expansion of AI Training Clusters Requiring >30 kW Racks | +2.1% | National, concentrated in São Paulo, Rio de Janeiro, Campinas | Medium term (2-4 years) |
| Increased Migration to Cloud-Based Operations | +1.8% | National, with early gains in São Paulo, Rio de Janeiro, Brasília | Short term (≤ 2 years) |
| Growing Adoption of High-Density Computing | +1.5% | National, led by São Paulo metropolitan region | Medium term (2-4 years) |
| Demand for Green and Energy-Efficient Data Centers | +1.2% | National, regulatory influence strongest in São Paulo, Rio de Janeiro | Long term (≥ 4 years) |
| Fast-Track Data Center Licensing under Conecta 5G | +0.9% | National, prioritizing underserved regions in North and Northeast | Short term (≤ 2 years) |
| PADIS 2026 Tax Credits for Locally-Assembled 19-Inch Racks | +0.7% | National, manufacturing clusters in São Paulo, Minas Gerais | Medium term (2-4 years) |
| Source: Mordor Intelligence | |||
Expansion of AI Training Clusters Requiring More Than 30 kW Racks
AI workloads are pushing rack power densities from single-digit kilowatt levels to 30-50 kW. Dell began local production of PowerEdge XE7745 AI servers in January 2026, enabling GPU-accelerated training within domestic supply chains.[1]Dell Technologies, “Dell Technologies Begins Local Production of AI Servers in Brazil,” DELL.COM Elea Data Centers and Scala Data Centers together plan over 8 GW of AI-optimized capacity that mandates liquid-cooled, reinforced enclosures. Google’s South America region, live since August 2024, already uses direct-to-chip cooling, highlighting the inadequacy of legacy air-cooled racks for future clusters.[2]Google Cloud, “Google Cloud Region in Brazil,” CLOUD.GOOGLE Vendors now bundle rear-door heat exchangers rated above 40 kW and modular coolant manifolds, positioning AI density as the single largest uplift to the Brazil data center rack market CAGR.
Increased Migration to Cloud-Based Operations
Amazon Web Services committed USD 1.8 billion through 2034 to enlarge its São Paulo region, while Microsoft earmarked USD 2.7 billion for new sites in Hortolândia, Sumaré, and Limeira. Sovereign-cloud clauses under REDATA force public-sector workloads onto Brazilian soil, accelerating local rack uptake. Serpro’s USD 67 million Google Distributed Cloud rollout shows demand for standardized 19-inch cabinets that ship fully cabled to reduce on-site labor. Migration projects scheduled between 2024-2026 underpin a near-term spike in rack orders, especially in São Paulo, where colocation occupancy is already above 98%.
Growing Adoption of High-Density Computing
Dell captured 53% of x86 server revenue in Brazil during Q3 2025 with GPU-ready 2U and 4U systems that maximize compute per rack unit. Equinix’s SP6, opened January 2026, adopts overhead busways and 400 V DC distribution to support 25 kW per rack without exotic cooling. Ascenty’s 47 MW SPO05 likewise targets 20 kW racks for containerized apps. Brazil’s 89% renewable grid reduces the carbon penalty of dense compute, though transmission delays outside São Paulo constrain rapid scale-out. Together, these factors lift power density norms and fuel incremental rack demand.
Demand for Green and Energy-Efficient Data Centers
REDATA suspends federal taxes for projects meeting 100% renewable sourcing and 2% R&D spend, triggering USD 370.7 billion of announced investments. Schneider Electric and Vertiv deliver rack-level metering that feeds building-management analytics, a module Equinix adopted across its fleet to achieve PUE below 1.4. Hot-aisle containment doors and fan-tray modulation cut cooling energy 15-25% versus open frames, helping operators qualify for Leadership in Energy and Environmental Design certification. Hydro-dependency still imposes drought risk, so rack procurement increasingly specifies space for in-enclosure battery modules or DC distribution to accommodate on-site solar and storage.
Restraints Impact Analysis*
| Restraint | (~) % Impact on CAGR Forecast | Geographic Relevance | Impact Timeline |
|---|---|---|---|
| Port-Side Congestion Delaying 48U / 52U Rack Imports | -1.4% | National, acute at Santos, Suape, Vitória ports | Short term (≤ 2 years) |
| Intermittent Power Quality in Regional Grids | -1.1% | National, pronounced in North and Northeast regions | Medium term (2-4 years) |
| Rising Domestic Steel Surcharges Linked to Vale Carbon Fees | -0.8% | National, manufacturing clusters in São Paulo, Minas Gerais | Long term (≥ 4 years) |
| Limited Skilled Workforce for Facility Management | -0.6% | National, concentrated in São Paulo, Rio de Janeiro, Brasília | Medium term (2-4 years) |
| Source: Mordor Intelligence | |||
Port-Side Congestion Delaying 48U / 52U Rack Imports
Congestion at Santos peaked at 290 vessels in February 2025 with median delays of four days; Suape and Vitória suffer even longer queues. Demurrage hit USD 2.3 billion in 2024, inflating rack landed cost or forcing buyers to accept air-freight premiums. The new STS10 terminal will not open before 2030, sustaining the import bottleneck.
Intermittent Power Quality in Regional Grids
Voltage fluctuations linked to transmission bottlenecks mean operators oversize uninterruptible power supply and generator sets, adding 12-18% to the rack's total cost of ownership.[3]Government of Brazil Ministry of Mines and Energy, “Brazilian Energy Grid and Renewable Energy Statistics,” GOV.BR Renewable curtailment in the Northeast reached 8% of potential output in 2024, undermining the economics of on-site solar and complicating REDATA compliance. The AXIA-Siemens modernization will not fully close the reliability gap until 2028.
*Our forecasts treat driver/restraint impacts as directional, not additive. The impact forecasts reflect baseline growth, mix effects, and variable interactions.
Segment Analysis
By Rack Size: Half Racks Address Edge Growth
Half racks captured a small base in 2025 but are forecast to outpace the growth rate of the Brazil data center rack market, with a 9.23% CAGR. Edge nodes in Campinas, Fortaleza, and Brasília are standardizing on 18U-20U units that fit within micro-modules delivered under Conecta 5G. Schneider Electric’s 18U liquid-cooling manifold now supports 25 kW, enabling half-racks to host inference workloads once limited to full cabinets. Ascenty’s Fortaleza build deployed 120 half racks, trimming capital expenditure by 30% compared with 42U equivalents. Full racks still hold 73.32% of the share in 2025, and anchor hyperscale and Tier 3 colocation halls, where return on square meter remains paramount.
Thermal innovation and regulatory speed converge to propel half-rack adoption. Oracle’s Database@Azure integration distributes compute across micro-sites that demand wall-mount or half-height formats. Dell’s 2U PowerEdge variant, produced locally since 2026, targets this form factor. The balance of density, mobility, and installation speed positions half racks as the fastest riser, though full racks retain dominance through 2031.


By Rack Type: Enclosed Cabinets Maintain Supremacy
Enclosed cabinets controlled 77.33% of the share in 2025 and are advancing at 9.31% CAGR, far ahead of open-frame alternatives. Equinix’s RJ3 launched 560 enclosed cabinets with containment doors to hit PUE < 1.35, unlocking REDATA relief. Google employs direct-to-chip cooling inside sealed racks to isolate 40 kW AI loads. Open frames persist in homogeneous hyperscale farms where airflow uniformity offsets the absence of containment, yet they cannot gain traction in colocation, which mixes legacy and high-density tenants.
Vertiv’s rear-door exchanger retrofits keep older enclosed cabinets viable, extending their lifecycle and reinforcing share. Domestic assemblers, buoyed by PADIS credits, are now offering basic enclosed models at 10-15% discounts, but service gaps slow Tier 4 uptake. Given thermal isolation, regulatory incentives, and retrofit paths, enclosed cabinets will stay dominant in the Brazil data center rack market.
By Tier Type: Tier 4 Ramps Under Compliance Pressure
Tier 3 racks accounted for 54.21% of the market share in 2025; however, Tier 4 is set to post the highest CAGR at 9.56% as banking and government workloads impose 99.995% uptime. Serpro’s Google Distributed Cloud deal stipulates Tier 4 sites inside Brasília. Equinix SP6 pursues Tier 4 through 2N power and N+1 cooling, requiring racks with dual power entries and integrated circuit metering. REDATA does not name a tier, yet its renewable-sourcing bar effectively sidelines Tier 1-2 projects, steering capital toward Tier 3 upgrades or greenfield Tier 4 builds.
Ascenty reports São Paulo colocation occupancy above 98%, leaving little Tier 3 headroom; expansion, therefore, shifts to Tier 4 SPO06 and SPO07. While Tier 3 will remain the volume leader, Tier 4 will grab the growth spotlight through 2031. Financial-services regulations that impose a 99.995% uptime requirement have already driven leading banks to pre-lease over 60% of SPO06’s initial rack capacity, fully underwriting Ascenty’s Tier 4 build before construction advances.
By Data Center Size: Hyperscale Surges
Hyperscale facilities are projected to grow at 9.89% CAGR, the swiftest of all size classes, as cloud majors internalize racks to dodge port delays and reduce lifetime cost. Amazon Web Services’ USD 1.8 billion São Paulo expansion exceeds 200 MW and demands up to 5,000 racks per site. Microsoft’s USD 2.7 billion program targets more than 3,000 racks in each of three inland locations. Large multi-tenant colocation remains the biggest slice at 53.42% in 2025, yet its CAGR lags at high single-digits because expansion is tied to enterprise hybrid-cloud budgets rather than hyperscaler cycles.
Liquid-cooled AI megasites such as Elea Data Centers’ Rio AI City and Scala’s AI City redefine hyperscale specs with 40-50 kW racks. These advancements are raising structural and thermal requirements. Medium and small data centers still matter for regulated telecoms and edge compute, but will not outpace hyperscale growth to 2031.
By Data Center Type: Captive Clouds Close Gap with Colocation
Colocation claimed 52.53% of share in 2025, led by Equinix, Ascenty, and Odata. Yet hyperscaler captive builds are rising fastest, at a 9.71% CAGR, as Amazon Web Services, Microsoft, Google, and Oracle opt for self-owned sites. Google’s USD 850 million direct-to-chip cooled region in São Paulo is fully captive, enabling 40 kW racks unencumbered by multi-tenant compromises. Equinix still plans to invest SP6 and SP7 in 2026 to add capacity, but its growth is tied to enterprise demand rather than blockbuster cloud commitments.
Domestic policy levers are accelerating the swing toward self-owned infrastructure. REDATA’s renewable-energy tax exemptions and PADIS 2026 credits allow hyperscalers to import fewer components while still qualifying for fiscal relief, reducing installed costs per rack by double-digit percentages and shrinking the total contract value that colocation operators can bid on. Even so, colocation is expected to retain a majority share by bundling network interconnects and compliance services that captive sites must replicate internally. Enterprise and edge facilities, while smaller, gain fresh relevance as Conecta 5G compresses permit cycles to 90 days, creating quick-turn demand for 12- to 22U half racks that domestic assemblers can deliver under PADIS guidelines. The result is a more segmented buyer landscape in which colocation defends regulated workloads, hyperscalers absorb AI growth, and edge providers carve out low-latency niches, all within a Brazil data center rack market size that continues to expand at an 8.26% headline CAGR.
Geography Analysis
São Paulo and Rio de Janeiro together host roughly 85% of the Brazil data center rack market size in 2025, reflecting proximity to subsea cables, dense fiber corridors, and major enterprise demand centers. São Paulo alone counts 31 of Ascenty’s 36 facilities and six of Equinix’s eight Brazilian sites, creating a self-reinforcing cluster where demand, talent, and connectivity co-locate. Rio de Janeiro complements this hub by offering a disaster-recovery zone 300 km away; Equinix’s RJ3 provides 560 racks since January 2025 to meet that requirement.
Campinas, 90 km northwest of São Paulo, emerges as the tertiary pole with 410 MW operating and 285 MW under construction, attracted by lower land cost and direct fiber backhaul. Conecta 5G incentives are catalyzing expansion into the North and Northeast. Ascenty’s Fortaleza micro-edge site went live mid-2025 with 120 half racks, proving a template for 10-rack nodes in Recife and Manaus. Brasília hosts sovereign-cloud infrastructure; Serpro’s Google appliances satisfy public-sector residency rules inside the Federal District.
Chronic port congestion at Santos slows imports that feed São Paulo builds, extending lead times by up to 19 days for specialized 52U enclosures routed through Suape or Vitória. This bottleneck keeps occupancy tight Ascenty reported 98.8% in Q4 2025 and sustains rack pricing power. Grid-modernization in the Northeast promises long-term relief for voltage instability, but transmission upgrades will not complete before 2028.
Mordor Intelligence evaluates the data center rack market across all key regional markets, including North America, Africa, and Middle East, with deeper country-level insights covering Chile, Canada, South Africa, Saudi Arabia, Australia, and China.
Competitive Landscape
Global suppliers Schneider Electric, Vertiv, Eaton, and Rittal collectively hold about 60-65% of the installed base of enclosed cabinets, anchored by multi-year service contracts with Equinix and Ascenty. Their breadth across power, cooling, and enclosures keeps switching costs high. Dell Technologies disrupts by integrating locally made AI servers with captive rack designs, leveraging PADIS to skip import duties and bypass Santos backlogs, thereby appealing to hyperscalers that prize single-vendor accountability.
Innovation centers on thermal and serviceability. Schneider’s 18U liquid manifolds push half racks into AI territory, while Vertiv’s 40 kW rear-door exchangers retrofit existing cabinets without aisle rebuilds. Equinix embeds rack-level energy metering to document sub-1.4 PUE and capture REDATA relief, highlighting how software and hardware integration differentiates suppliers.
Domestic assemblers in São Paulo and Minas Gerais exploit PADIS 2026 to offer 19-inch cabinets at 10-15% lower prices but lack nationwide service networks, curbing uptake among Tier 4 buyers. Meanwhile, hyperscalers’ captive builds remove them from the open bidding pool, compressing the available pie for third-party suppliers even as total rack volume grows. Overall, rivalry is intensifying yet remains moderated by high switching costs and steady growth in the Brazil data center rack market.
Brazil Data Center Rack Industry Leaders
Eaton Corporation
Rittal GMBH & Co.KG
Schneider Electric SE
Vertiv Group Corp.
Legrand SA
- *Disclaimer: Major Players sorted in no particular order

Recent Industry Developments
- January 2026: Dell Technologies began local production of PowerEdge XE7745 AI servers at Hortolândia to capitalize on PADIS incentives and cut lead times.
- January 2026: Equinix inaugurated SP6 in São Paulo, the first phase of a USD 110 million Tier 4 project featuring 20-25 kW rack densities.
- March 2025: Ascenty issued a USD 98 million bond to fund SPO05-SPO07 totaling 165.4 MW.
- January 2025: Equinix opened RJ3 in Rio de Janeiro with 560 enclosed cabinets and sub-1.35 PUE.


Research Methodology Framework and Report Scope
Market Definitions and Key Coverage
Mordor Intelligence defines the Brazil data center rack market as all new, factory-built quarter, half, and full cabinets or open-frame enclosures installed inside purpose-built, colocated, hyperscale, enterprise, or edge data centers across Brazil during the study period. Revenue is expressed in USD at ex-factory average selling prices and excludes refurbishment or second-hand units.
Scope exclusion: Telecom street-side cabinets and indoor ICT racks deployed outside data-center facilities are not counted.
Segmentation Overview
- By Rack Size
- Quarter Rack (More than 11U)
- Half Rack (12-22U)
- Full Rack (≥42U)
- By Rack Type
- Enclosed Cabinet
- Open-Frame
- Wall-Mount and Micro-Edge Enclosure
- By Tier Type
- Tier 1 and 2
- Tier 3
- Tier 4
- By Data Center Size
- Small Data Center
- Medium Data Center
- Large Data Center
- Hyperscale Data Center
- By Data Center Type
- Colocation Data Center
- Hyperscalers Data Center/CSPs
- Enterprise and Edge Data Center
Detailed Research Methodology and Data Validation
Primary Research
Interviews with facility engineers, colocation procurement leads, power and cooling integrators, and regulators across São Paulo, Rio de Janeiro, Fortaleza, and Porto Alegre helped us verify average rack densities, refresh cycles, and pricing spreads. These conversations also clarified acceptance of liquid-cooled cabinets and regional lead-time bottlenecks, sharpening model assumptions.
Desk Research
Our analysts first built a desktop evidence stack that pulled annual rack import and export codes from Receita Federal, installed rack counts from Agência Nacional de Telecomunicações data-center filings, and power capacity disclosures collated by the Brazilian Data Center Association. Trend insights were enriched through trade publications such as Data Center Dynamics, academic papers from IEEE on high-density cooling, and public 10-K or CVM filings of leading enclosure suppliers. We also extracted company financials through D&B Hoovers and checked press coverage via Dow Jones Factiva to size local production runs, thereby anchoring domestic supply potential.
To cross-check demand, the team referenced macro indicators from IBGE, regional cloud spending tallies from ABES, and port shipment logs on Volza that reveal quarterly inflows of fully assembled cabinets. The listed references illustrate the breadth of sources; several additional public and proprietary datasets were consulted for validation.
Market-Sizing and Forecasting
A blended top-down, bottom-up approach underpins the model. National installed rack stock was rebuilt from data-center IT load capacity and average racks per MW ratios; results were then sense-checked through supplier shipment roll-ups and sampled ASP times volume math. Key variables like new facility megawatt additions, rack density progression, average selling price drift, hyperscale versus retail colocation share, and steel price trends feed a multivariate regression that projects value through 2030. Where bottom-up samples showed gaps, interpolations were guided by verified procurement benchmarks and capacity utilization curves before final reconciliation.
Data Validation and Update Cycle
Outputs pass three filters: statistical anomaly scans, peer analyst review, and senior audit. Divergences beyond preset thresholds trigger re-contact of key sources. Reports refresh each year, with interim updates whenever policy shifts, major investments, or currency swings materially move the baseline.
Why Mordor's Brazil Data Center Rack Baseline Commands Reliability
Published figures vary because firms differ in rack definitions, include ancillary power gear, or roll global ASPs into regional totals.
Key gap drivers lie in scope breadth, refresh cadence, and currency conversion practices. Some publishers pool telecom cabinets with data-center racks or freeze FX rates at contract date; Mordor's study isolates data-center use only, applies rolling twelve-month average FX, and updates after every significant facility commissioning.
Benchmark comparison
| Market Size | Anonymized source | Primary gap driver |
|---|---|---|
| USD 55.2 M (2025) | Mordor Intelligence | - |
| USD 51.4 M (2023) | Global Consultancy A | older base year, excludes edge facilities, no ASP refresh post-pandemic |
| USD 250 M (2024) | Industry Portal B | bundles racks with PDUs and containment, broad component scope inflates value |
The comparison shows that once scope and currency are aligned, values converge toward Mordor's disciplined baseline, giving decision-makers a balanced, transparent reference they can confidently trace back to clearly stated variables and repeatable steps.


Key Questions Answered in the Report
What is the current Brazil data center rack market size and how large is it expected to be by 2031?
The market is valued at USD 59.61 million in 2026 and is projected to reach USD 88.66 million by 2031, expanding at an 8.26% CAGR.
How fast is rack demand growing in Brazilian hyperscale campuses?
Captive hyperscale sites are projected to grow rack deployments at a 9.89% CAGR through 2031, outpacing colocation growth.
Which rack type dominates new deployments?
Enclosed cabinets held 77.33% share in 2025 and remain preferred thanks to hot-aisle containment and liquid-cooling readiness.
What is driving the shift toward Tier 4 facilities?
Financial-services rules that require 99.995% uptime and sovereign-cloud mandates push operators toward fault-tolerant Tier 4 designs.
How is port congestion affecting rack procurement?
Median delays of up to 19 days at Santos, Suape, and Vitória ports inflate landed costs and compel buyers to hold 6-9 months of buffer stock.
Are local tax incentives influencing rack design choices?
Yes, REDATA and PADIS 2026 cut duties on locally assembled, energy-efficient racks, lowering installed cost by low-double-digit percentages.
Which regions beyond São Paulo are seeing new rack installations?
Fortaleza, Brasília, and Campinas are gaining edge and sovereign-cloud nodes, helped by Conecta 5G’s 90-day permit timeline.
Page last updated on:


