
Bio-imaging Technologies Market Size and Share
Market Overview
| Study Period | 2020 - 2031 |
|---|---|
| Market Size (2026) | USD 12.48 Billion |
| Market Size (2031) | USD 17.73 Billion |
| Growth Rate (2026 - 2031) | 7.28 % |
| Fastest Growing Market | Asia-Pacific |
| Largest Market | North America |
| Market Concentration | Medium |
Major Players *Disclaimer: Major Players sorted in no particular order Image © Mordor Intelligence. Reuse requires attribution under CC BY 4.0. | |
Bio-imaging Technologies Market Analysis by Mordor Intelligence
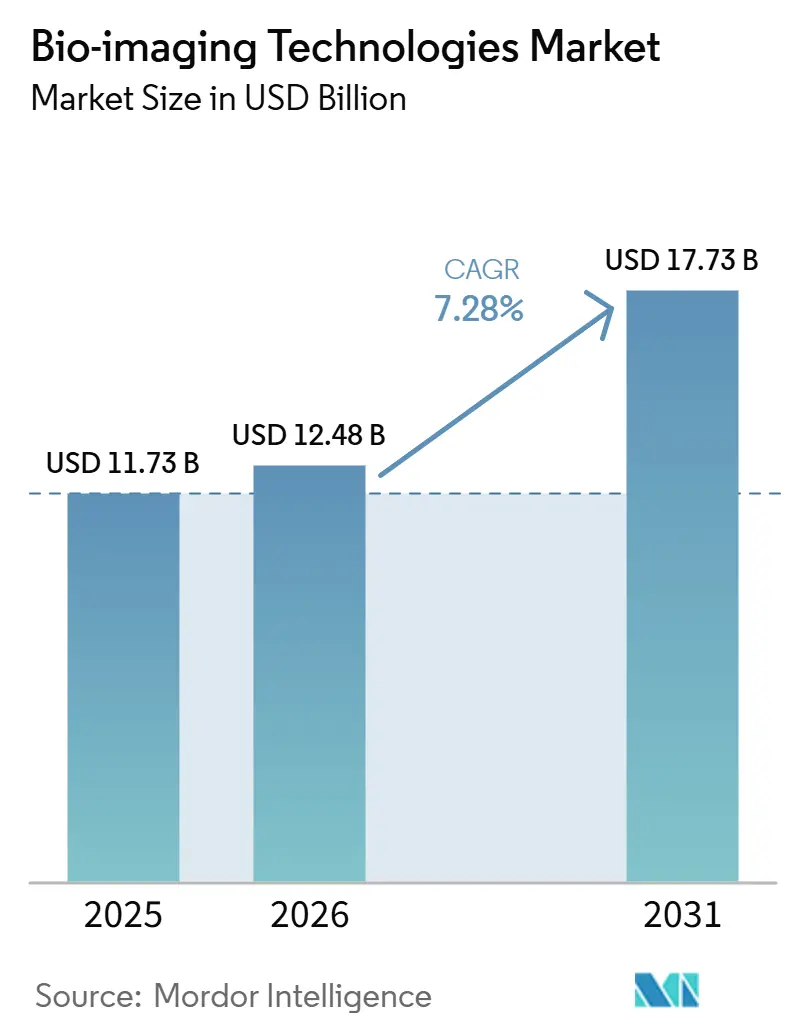
The Bio-imaging Technologies Market size was valued at USD 11.73 billion in 2025 and is estimated to grow from USD 12.48 billion in 2026 to reach USD 17.73 billion by 2031, at a CAGR of 7.28% during the forecast period (2026-2031).
The bio-imaging technologies market is moving from image capture toward clinical decision support across oncology, neurology, and cardiovascular care. Software-based reconstruction and analysis can extend the useful life of installed scanners without a full equipment replacement. This approach shortens product update cycles and expands vendor revenue beyond scanner sales. Demand also reflects the growing role of imaging in therapy planning, early diagnosis, and longitudinal patient monitoring. Capital budgets, reimbursement rules, interoperability, and the availability of trained staff will continue to shape the pace of adoption.
Key Report Takeaways
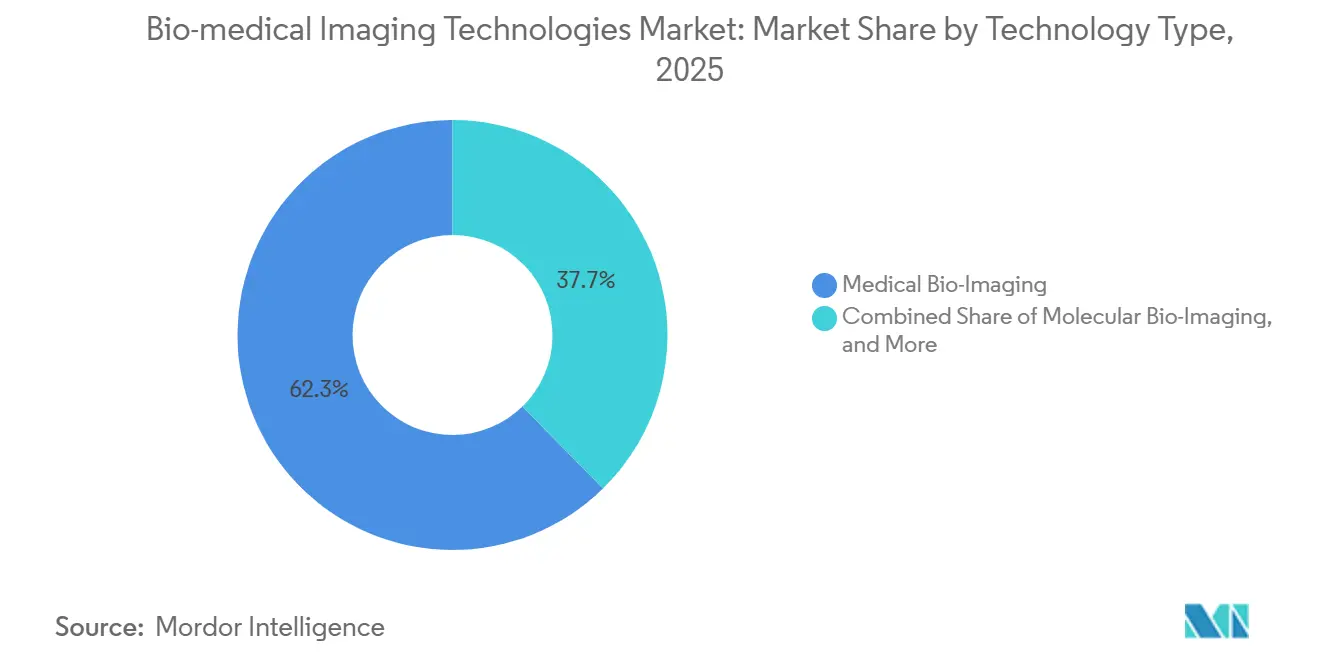
- By technology type, Medical Bio-Imaging held 62.34% of the bio-imaging technologies market share in 2025, while Molecular Bio-Imaging is forecast to grow at a 10.56% CAGR through 2031.
- By modality, Magnetic Resonance Imaging accounted for 22.36% of the market size in 2025, while Nuclear Imaging is projected to expand at a 9.54% CAGR through 2031.
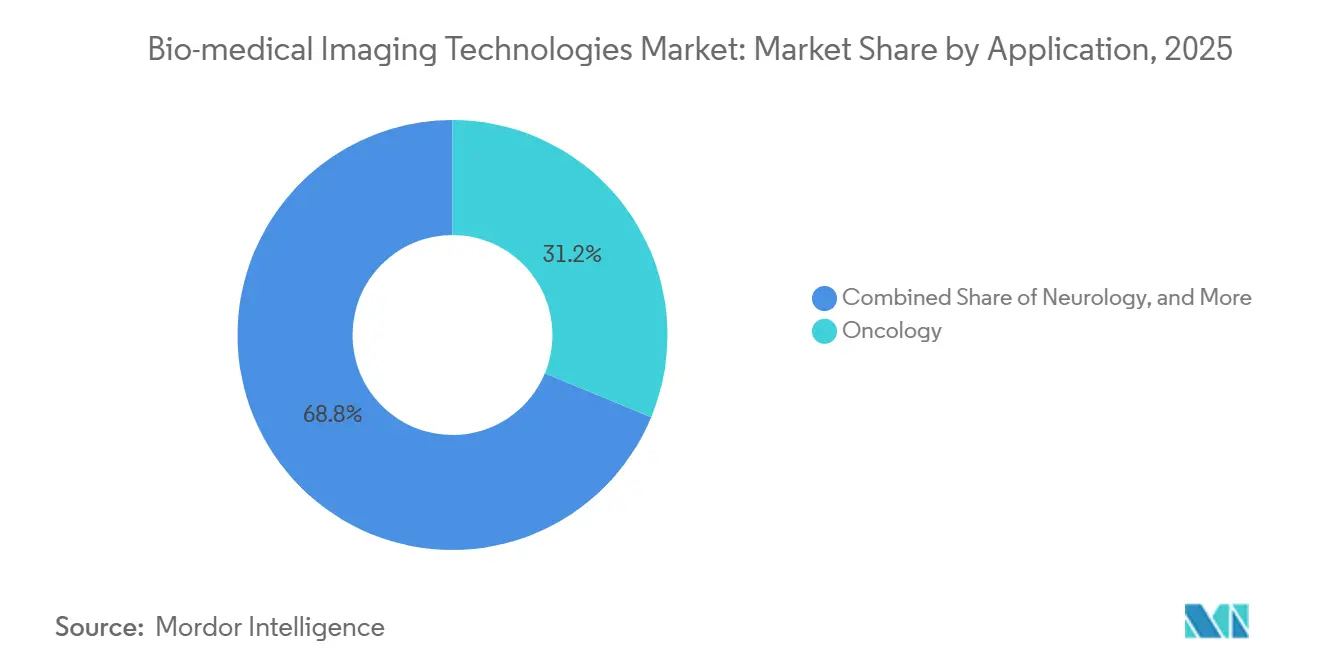
- By application, Oncology held 31.24% of the bio-imaging technologies market share in 2025 and is forecast to grow at a 9.34% CAGR through 2031.
- By end user, Hospitals and Clinics accounted for 46.54% of demand in 2025, while Pharmaceutical and Biotechnology Companies are forecast to expand at a 10.45% CAGR through 2031.
- By geography, North America held 41.34% of revenue in 2025, while Asia-Pacific is forecast to grow at a 10.32% CAGR through 2031.
Note: Market size and forecast figures in this report are generated using Mordor Intelligence’s proprietary estimation framework, updated with the latest available data and insights as of January 2026.
Market Trends and Insights
Drivers Impact Analysis of Bio-imaging Technologies Market*
| Driver | (~) % Impact on CAGR Forecast | Geographic Relevance | Impact Timeline |
|---|---|---|---|
| High-Resolution Imaging for Early Detection | +1.8% | Global, with pronounced impact in North America and Europe | Long term (≥ 4 years) |
| AI-Enabled Reconstruction and Quantitative Analysis | +1.5% | Global, with early gains in North America, Western Europe, and core Asia-Pacific markets | Medium term (2-4 years) |
| Biopharma Imaging for Drug Development and Diagnostics | +1.2% | North America and Europe, with spillover to Asia-Pacific | Medium term (2-4 years) |
| Portable, Cloud-Connected, and Integrated Platforms | +1.0% | Global, with strongest demand in North America, the United Kingdom, Australia, and tier-1 Asia-Pacific markets | Short term (≤ 2 years) |
| Multimodal Imaging for Complex Care | +0.9% | Global, led by Europe and North America, with accelerating demand in Asia-Pacific | Long term (≥ 4 years) |
| Research-Grade Systems in Emerging Laboratories | +0.6% | Core Asia-Pacific markets and emerging Middle East and Africa hubs | Long term (≥ 4 years) |
| Source: Mordor Intelligence | |||
Growing Need for High-Resolution Biological Imaging in Early Disease Detection
Early cancer detection and neurodegenerative disease screening are changing what buyers expect from imaging systems. Hospitals increasingly seek sub-millimeter resolution and volumetric tissue characterization for routine clinical decisions. GE HealthCare[1]GE HealthCare, “AIR Recon DL MR Image Reconstruction,” GE HealthCare, gehealthcare.comstated that AIR Recon DL had been used in more than 80 million patient scans by mid-2025 and could reduce scan times by up to 50%.
Faster MRI examinations can improve scanner throughput, although they shift more pressure to image reporting and interpretation capacity. Photon-counting CT also offers tissue information that conventional CT cannot provide, supporting earlier assessment of lesions. In neurology and oncology, the use of 7T MRI and PET-MRI supports broader demand for high-resolution and multimodal imaging.
Rising AI-Enabled Image Reconstruction and Quantitative Analysis
The bio-imaging technologies market is seeing AI reconstruction shift competition from detector hardware toward software performance and clinical workflow value. Siemens Healthineers reported that Deep Resolve supported an MRI scan-time reduction of more than 20% at NHS Fife, which created capacity for 1,900 additional appointments in 6 months. Philips[2]Philips, “Philips Receives FDA 510(k) Clearance for Verida,” Philips Press Room, philips.comreceived FDA 510(k) clearance for Verida, a detector-based spectral CT system that uses an AI reconstruction engine. Philips stated that the system reconstructs 145 images per second and can support up to 270 examinations daily. Software updates can improve the performance of legacy scanner fleets without a capital replacement. This reduces barriers to adoption for hospitals while increasing the importance of software integration and procurement standards.
Expanding Biopharma Use in Drug Discovery, Companion Diagnostics, and Translational Research
The bio-imaging technologies market is also supported as biopharma companies use imaging biomarkers earlier in drug development to improve patient selection and trial decisions. Revvity[3]Revvity, “Revvity Unveils New AI Software Offering to Transform Preclinical Imaging Analysis,” BusinessWire, businesswire.comintroduced Living Image Synergy AI in September 2025 for multimodal in vivo analysis across optical imaging, microCT, and ultrasound. The platform addresses reproducibility and data consistency issues in translational research. GE HealthCare completed its acquisition of Nihon Medi-Physics in March 2025, adding a Japanese SPECT and PET radiopharmaceutical supplier to its imaging portfolio. This transaction shows how imaging equipment suppliers are pursuing revenue from agents used in companion diagnostics. Research on transgenic reporter systems also supports the use of PET and bioluminescent imaging together in tumor models.
Procurement Shift toward Portable, Cloud-Connected, and Workflow-Integrated Imaging Platforms
The bio-imaging technologies market is affected as health systems reassess the operating costs of locally managed imaging infrastructure. Emory Healthcare completed the migration of more than 1.3 million annual imaging examinations to Sectra One Cloud in June 2026[4]Sectra, “Sectra’s First US Cloud Migration, Emory Healthcare Boosts Scalability and Security by Moving to Sectra One Cloud,” PR Newswire, prnewswire.com. The move transfers infrastructure maintenance and upgrades to the vendor and supports common software versions across sites. Philips launched the Alturion ultrasound system in June 2026 with FDA clearance and CE marking for high-volume settings. Portable and connected systems can help facilities use imaging results when specialist resources are limited. Buyers are therefore placing more weight on workflow integration, remote access, and lifecycle costs alongside image quality.
Restraints Impact Analysis of Bio-imaging Technologies Market*
| Restraint | (~) % Impact on CAGR Forecast | Geographic Relevance | Impact Timeline |
|---|---|---|---|
| High Cost of Advanced Systems and Software Upgrades | -1.2% | Global, with a disproportionate effect in tier-2 Asia-Pacific markets, Middle East and Africa, and South America | Long term (≥ 4 years) |
| Reimbursement Pressure and Slow Clinical Validation | -0.9% | Primarily North America and Europe, with a secondary effect in Asia-Pacific | Medium term (2-4 years) |
| Interoperability Gaps across Hardware, AI, and Laboratory Systems | -0.7% | Global, most acute in multivendor hospitals in emerging markets | Medium term (2-4 years) |
| Shortage of Imaging and AI-Skilled Personnel | -0.6% | Global, most acute in rural North America, sub-Saharan Africa, and South Asia | Long term (≥ 4 years) |
| Source: Mordor Intelligence | |||
High Capital Cost of Advanced Imaging Systems and Software Upgrades
The bio-imaging technologies market faces a cost barrier because acquiring an advanced imaging platform extends beyond the scanner purchase price. A 1.5T or 3.0T MRI system can start at USD 900,000, while installation, service contracts, and software licenses increase lifecycle expenditure. The input data indicates installation costs of USD 150,000 to USD 500,000 and annual service costs of USD 42,000 to USD 134,000. These costs can delay approvals at community hospitals and diagnostic centers, especially in markets with limited financing. A 2026 study across 46 European countries also identified infrastructure, training, and reimbursement as barriers to equitable cardiovascular MRI access. Refurbished systems can reduce capital outlay by 30% to 60%, but buyers must weigh those savings against software compatibility and warranty limitations.
Reimbursement Pressure, Validation Requirements, and Workforce Constraints
The bio-imaging technologies market also faces a reimbursement challenge because regulatory clearance does not automatically result in a clear reimbursement pathway for AI-enabled imaging workflows. CMS and FDA announced the RAPID coverage pathway in April 2026, which may provide national Medicare coverage for eligible Breakthrough Devices as early as 2 months after authorization. The pathway is selective and does not resolve bundled payment limits for most imaging tools. Coverage decisions also require evidence of clinical outcomes, not only better image quality, which can slow implementation. Hospitals need interoperable connections across scanners, AI models, and laboratory information systems to realize workflow benefits. Shortfalls in imaging scientists, AI-trained radiology staff, and advanced application specialists further limit adoption, especially outside major urban care systems.
*Our forecasts treat driver/restraint impacts as directional, not additive. The impact forecasts reflect baseline growth, mix effects, and variable interactions.
Bio-imaging Technologies Market Segment Analysis
By Technology Type:
Molecular Bio-Imaging Expands within a Clinical-Led BaseMedical Bio-Imaging held 62.34% of the revenue share in 2025, reflecting its central role in hospital radiology, diagnostic imaging centers, and emergency care. Its position rests on established clinical workflows and regulated modalities used in everyday diagnostic decisions.
Molecular Bio-Imaging is projected to record the highest growth at a 10.56% CAGR through 2031. The segment benefits from theranostics, where an imaging agent is linked to a therapeutic radiopharmaceutical for patient selection and treatment monitoring. Lantheus received FDA approval for PYLARIFY TruVu in 2026, a reformulated PSMA PET imaging agent that is intended to improve manufacturing efficiency and supply flexibility.



By Modality:
MRI Leads Revenue while Nuclear Imaging Grows FasterWithin the bio-imaging technologies market, Magnetic Resonance Imaging held 22.36% of the bio-imaging technologies market size in 2025. MRI remains important in soft-tissue oncology, neurological assessment, cardiology, and clinical pathways where avoiding ionizing radiation has value. Nuclear Imaging is forecast to grow at a 9.54% CAGR through 2031.
The segment is supported by radiopharmaceutical approvals, theranostic care models, and broader clinical use in oncology and neurology. Lantheus received FDA tentative approval for PNT2003 in March 2026, a radioequivalent to Lutetium Lu 177 Dotatate for gastroenteropancreatic neuroendocrine tumors. The approval points to a generic pathway that could broaden access to radioligand procedures.
By Application:
Oncology Combines Leading Scale and GrowthThe oncology segment accounted for 31.24% of the revenue share in 2025 and is forecast to expand at a 9.34% CAGR through 2031. It is the only application in the supplied data that combined the largest revenue share with the fastest projected growth. Imaging is used across therapy planning, patient stratification for targeted treatment, and response monitoring. A 2026 study on glioma classification found that combining radiology and pathology foundation models outperformed unimodal approaches. This supports the procurement of integrated imaging platforms at oncology centers. The application base is therefore tied to both existing diagnostic volume and new precision treatment pathways. Orthopedics, gastroenterology, and infectious disease research form the remaining application base. In May 2026, Japan’s AI Medical Service received approval for gastroAI model-G3 for early gastric cancer and adenoma detection.
By End User:
Hospitals Lead Demand while Biopharma Spending RisesWithin the bio-imaging technologies market, Hospitals and Clinics held 46.54% of end-user demand in 2025. Their leading position reflects imaging use across inpatient, outpatient, and emergency care. GE HealthCare and Catholic Health entered a 10-year Care Alliance covering more than 1,300 technology deployments across 40 hospitals and outpatient sites. The agreement carried a value of USD 500 million in the supplied information. Large health systems use these arrangements to update equipment, standardize operations, and support service continuity. Hospitals will remain the central purchaser group because they manage the broadest range of clinical imaging procedures.
Pharmaceutical and Biotechnology Companies are projected to grow at a 10.45% CAGR through 2031, the fastest rate among end users. The growth is linked to radioligand therapy development and the need for matched molecular imaging in patient selection and response monitoring.
Geography Analysis
North America Bio-imaging Technologies Market
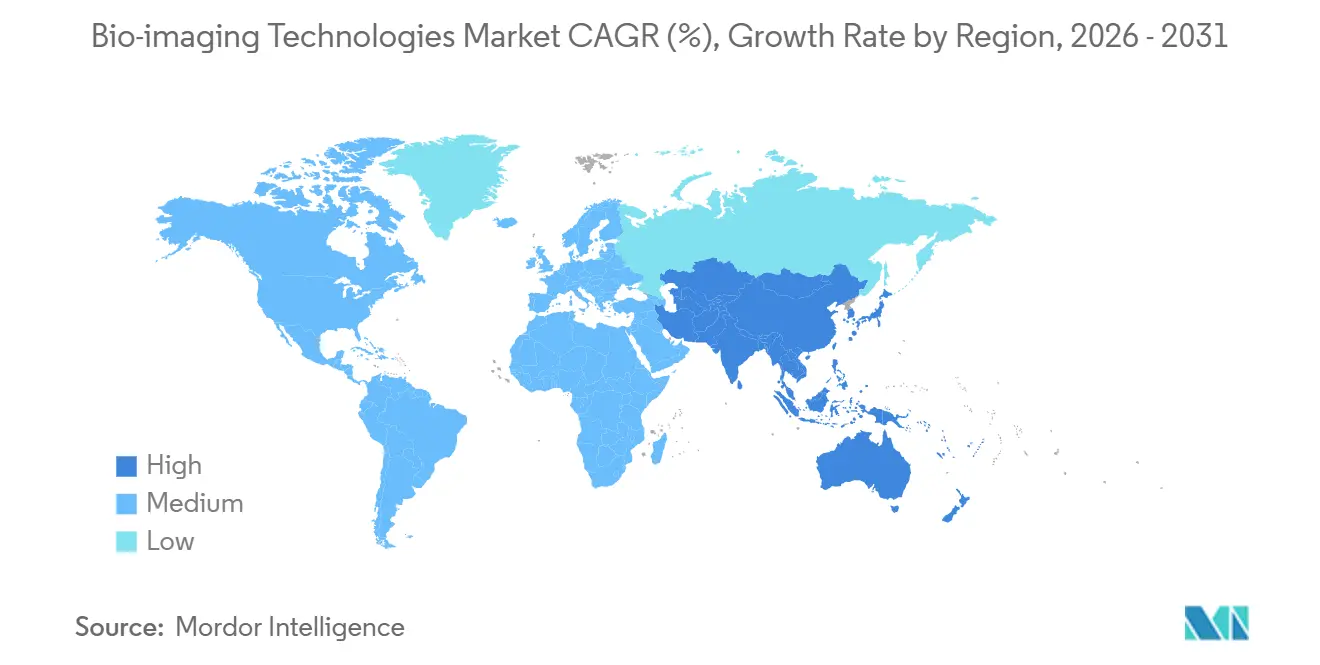
North America held 41.34% of the revenue share in 2025. The region has a large installed base of clinical imaging equipment, major cancer centers using multimodal protocols, and an evolving reimbursement environment. The CMS-FDA RAPID pathway announced in April 2026 may better align regulatory authorization and Medicare coverage for eligible devices. The United States represents the largest share within the region. Canada and Mexico are smaller markets where cloud imaging and teleradiology can extend diagnostic services into underserved areas.
APAC Bio-imaging Technologies Market
Asia-Pacific is projected to expand at a 10.32% CAGR through 2031, the fastest regional pace in the supplied data. The growth is linked to policy direction, domestic technology investment, and an expanding private diagnostic sector. China’s November 2025 directive called for AI-assisted medical imaging diagnosis in all secondary-level and higher hospitals by 2030.

Competitive Landscape
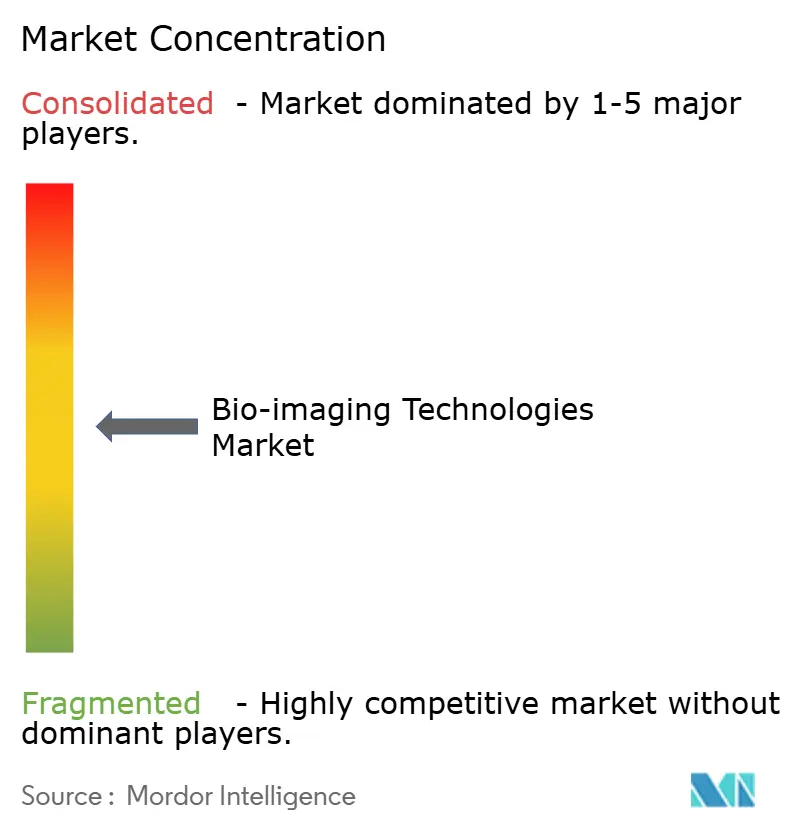
The bio-imaging technologies market has moderate consolidation in clinical hardware. GE HealthCare, Siemens Healthineers, and Koninklijke Philips lead the upper tier with portfolios covering CT, MRI, X-Ray, ultrasound, and AI software. In the bio-imaging technologies market, competition is more fragmented in radiopharmaceuticals, preclinical imaging, and molecular bio-imaging.
Lantheus, Bracco Imaging, Bruker, and Revvity compete through specialized offerings in these areas. The leading hardware vendors use long-term partnerships and service agreements to connect equipment, software, maintenance, and clinical operations. Siemens Healthineers entered a 10-year Value Partnership with Onvida Health in April 2026 to modernize diagnostic imaging and therapy equipment.
Bio-imaging Technologies Industry Leaders
GE HealthCare
Siemens Healthineers AG
Koninklijke Philips N.V.
Canon Inc.
FUJIFILM Holdings Corporation
- *Disclaimer: Major Players sorted in no particular order
Bio-imaging Technologies Market Companies Covered in this Report
- Agilent Technologies
- Bayer
- Bracco Imaging S.p.A.
- Bruker
- Canon
- Carestream Health
- Esaote S.p.A.
- FUJIFILM
- GE Healthcare
- Hologic
- Koninklijke Philips
- Lantheus Holdings, Inc.
- Mediso
- Revvity, Inc.
- Samsung Group
- Shimadzu
- Siemens Healthineers
- Thermo Fisher Scientific

Recent Industry Developments in Bio-imaging Technologies Market
- April 2026: Philips received FDA 510(k) clearance for Verida spectral CT, a detector-based spectral CT system powered by AI deep-learning reconstruction. Philips stated that the system processes 145 images per second and enables up to 270 examinations daily.
- March 2026: GE HealthCare completed the acquisition of Intelerad for USD 2.3 billion, integrating a medical imaging software provider to accelerate its cloud-first enterprise imaging strategy across hospital, ambulatory, and specialty clinic settings.


Global Bio-imaging Technologies Market Report Scope
As per the scope of the market, bio-imaging technologies comprise a broad range of imaging systems and associated software used to visualize anatomical structures, physiological functions, and molecular activities within living organisms. These technologies support clinical diagnosis, disease monitoring, image-guided interventions, drug discovery, preclinical research, and precision medicine applications across healthcare providers, research institutions, and life sciences organizations.
The bio-imaging technologies market report segments the market by technology type, including medical bio-imaging, molecular bio-imaging, and other imaging technologies such as functional and preclinical bio-imaging. The market is further segmented by modality into X-ray, computed tomography (CT), magnetic resonance imaging (MRI), ultrasound imaging, nuclear imaging, optical imaging, and others, including positron emission tomography (PET) and photoacoustic imaging. Application-based segmentation covers oncology, neurology, cardiology, orthopedics, gastroenterology, and others. The report also categorizes the market by end user, comprising hospitals and clinics, diagnostic imaging centers, academic and research institutes, pharmaceutical and biotechnology companies, and contract research organizations. Geographically, the market is segmented into North America, Europe, Asia-Pacific, the Middle East & Africa, and South America. The market report also covers the estimated market sizes and trends for 17 countries across major regions globally. For each segment, the market size and forecast are provided in terms of value (USD).
| Medical Bio-Imaging |
| Molecular Bio-Imaging |
| Others (Functional Bio-Imaging, Preclinical Bio-Imaging and More) |
| X-Ray |
| Computed Tomography |
| Magnetic Resonance Imaging |
| Ultrasound Imaging |
| Nuclear Imaging |
| Optical Imaging |
| Others (Positron Emission Tomography, Photoacoustic Imaging, and More) |
| Oncology |
| Neurology |
| Cardiology |
| Orthopedics |
| Gastroenterology |
| Others (Precision Medicine, Regenerative Medicine, and More) |
| Hospitals And Clinics |
| Diagnostic Imaging Centers |
| Academic And Research Institutes |
| Pharmaceutical And Biotechnology Companies |
| Contract Research Organizations |
| North America | United States |
| Canada | |
| Mexico | |
| Europe | Germany |
| United Kingdom | |
| France | |
| Italy | |
| Spain | |
| Rest of Europe | |
| Asia-Pacific | China |
| India | |
| Japan | |
| Australia | |
| South Korea | |
| Rest of Asia-Pacific | |
| Middle East and Africa | GCC |
| South Africa | |
| Rest of Middle East and Africa | |
| South America | Brazil |
| Argentina | |
| Rest of South America |
| By Technology Type | Medical Bio-Imaging | |
| Molecular Bio-Imaging | ||
| Others (Functional Bio-Imaging, Preclinical Bio-Imaging and More) | ||
| By Modality | X-Ray | |
| Computed Tomography | ||
| Magnetic Resonance Imaging | ||
| Ultrasound Imaging | ||
| Nuclear Imaging | ||
| Optical Imaging | ||
| Others (Positron Emission Tomography, Photoacoustic Imaging, and More) | ||
| By Application | Oncology | |
| Neurology | ||
| Cardiology | ||
| Orthopedics | ||
| Gastroenterology | ||
| Others (Precision Medicine, Regenerative Medicine, and More) | ||
| By End User | Hospitals And Clinics | |
| Diagnostic Imaging Centers | ||
| Academic And Research Institutes | ||
| Pharmaceutical And Biotechnology Companies | ||
| Contract Research Organizations | ||
| By Geography | North America | United States |
| Canada | ||
| Mexico | ||
| Europe | Germany | |
| United Kingdom | ||
| France | ||
| Italy | ||
| Spain | ||
| Rest of Europe | ||
| Asia-Pacific | China | |
| India | ||
| Japan | ||
| Australia | ||
| South Korea | ||
| Rest of Asia-Pacific | ||
| Middle East and Africa | GCC | |
| South Africa | ||
| Rest of Middle East and Africa | ||
| South America | Brazil | |
| Argentina | ||
| Rest of South America | ||


Key Questions Answered in the Report
What is the forecast growth of the bio-imaging technologies market?
The bio-imaging technologies market is projected to grow from USD 12.48 billion in 2026 to USD 17.73 billion by 2031, at a 7.28% CAGR.
Which technology type is growing fastest in bio-imaging?
Molecular Bio-Imaging is projected to grow at a 10.56% CAGR through 2031, supported by theranostics and companion diagnostics.
Which modality holds the largest revenue share?
Magnetic Resonance Imaging held a 22.36% share in 2025, while Nuclear Imaging has the fastest projected modality growth at 9.54% CAGR through 2031.
Why is oncology important for imaging vendors?
Oncology held 31.24% of revenue in 2025 and is projected to expand at a 9.34% CAGR through 2031 as imaging supports diagnosis, therapy planning, and response monitoring.
Which region is growing fastest?
Asia-Pacific is projected to grow at a 10.32% CAGR through 2031, supported by policy initiatives, diagnostic infrastructure, and technology investment.
Page last updated on:





