
Chemiluminescence Imaging Market Size and Share
Market Overview
| Study Period | 2020 - 2031 |
|---|---|
| Market Size (2026) | USD 4.49 Billion |
| Market Size (2031) | USD 5.98 Billion |
| Growth Rate (2026 - 2031) | 5.89 % |
| Fastest Growing Market | Asia-Pacific |
| Largest Market | North America |
| Market Concentration | Medium |
Major Players *Disclaimer: Major Players sorted in no particular order Image © Mordor Intelligence. Reuse requires attribution under CC BY 4.0. | |
Chemiluminescence Imaging Market Analysis by Mordor Intelligence
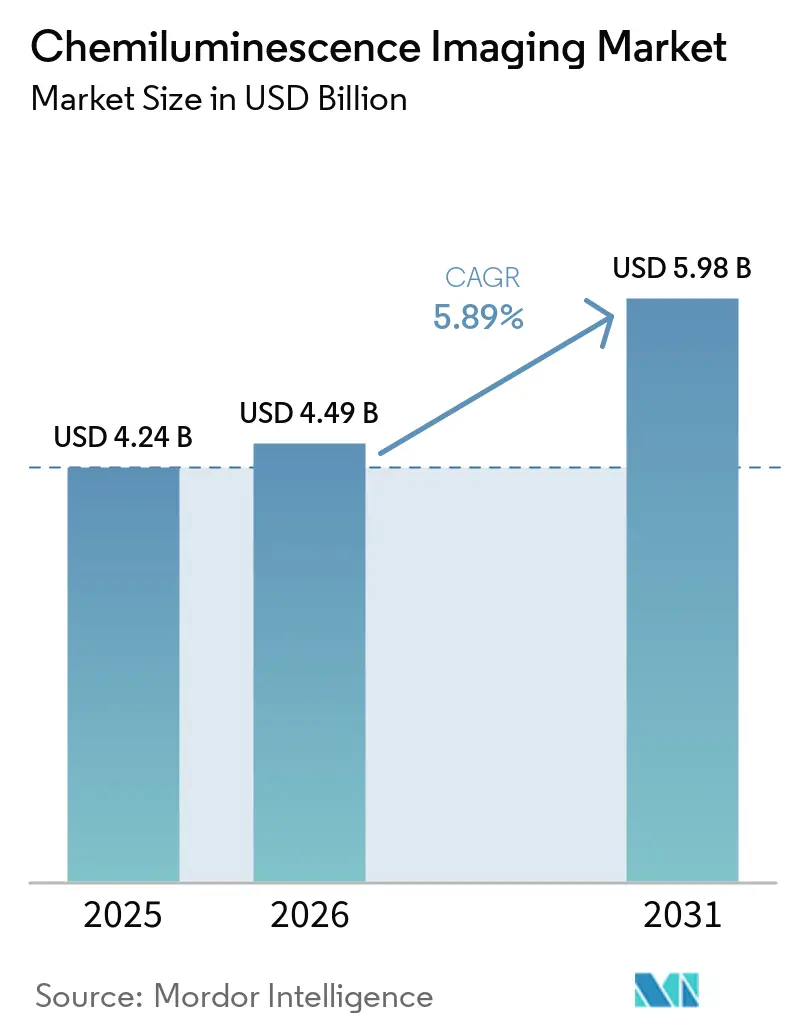
The Chemiluminescence Imaging Market size is projected to expand from USD 4.24 billion in 2025 and USD 4.49 billion in 2026 to USD 5.98 billion by 2031, registering a CAGR of 5.89% between 2026 to 2031.
Demand is supported by sensitive protein detection in drug discovery, proteomics, and clinical diagnostics. Biologics developers use protein characterization repeatedly to assess purity, potency, and comparability, which sustains the use of electrochemiluminescence-based western blotting. Centralized hospital laboratories are also adopting automated chemiluminescent immunoassay analyzers, creating demand that differs from research laboratory workflows. The chemiluminescence imaging market combines long equipment replacement cycles with recurring purchases of reagents and consumables. Connected systems can also tie software, instrument data, and validated reagent workflows together, which can make platform changes more difficult for regulated laboratories.
Key Report Takeaways
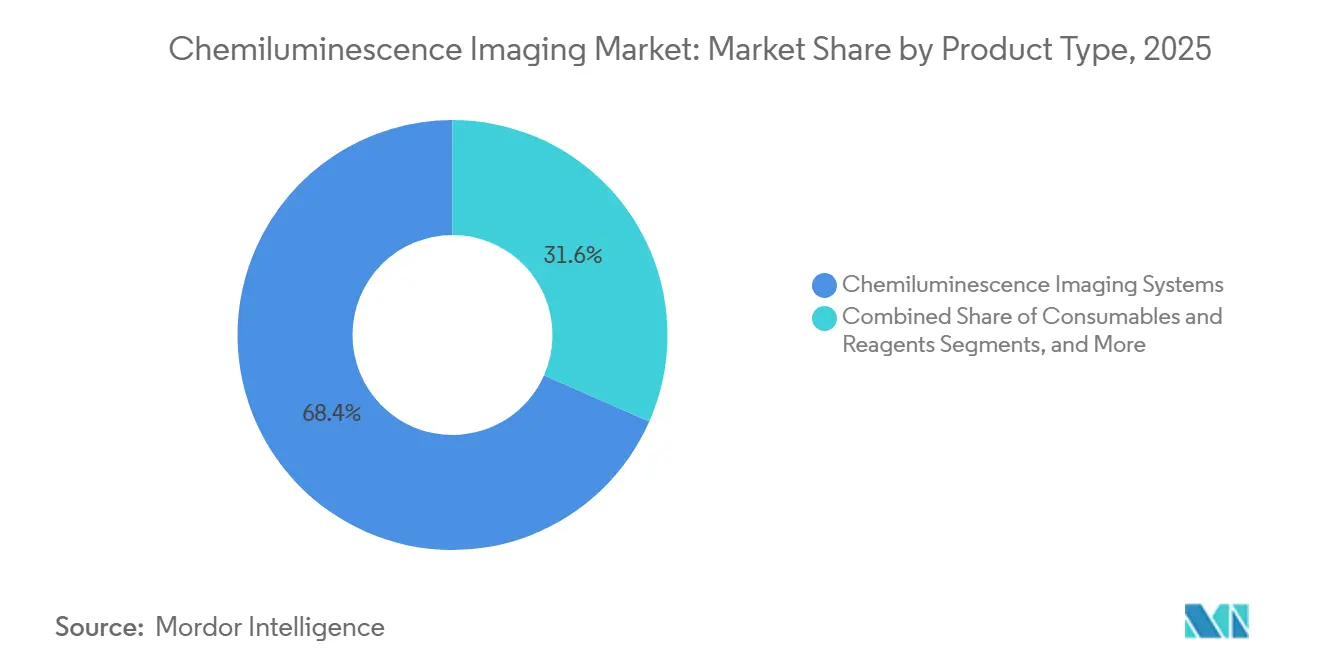
- By product type, chemiluminescence imaging systems held 68.40% of the chemiluminescence imaging market share in 2025, while consumables and reagents are projected to grow at a CAGR of 7.90% through 2031.
- By application, western blotting accounted for 47.68% of the chemiluminescence imaging market size in 2025, while chemiluminescence immunoassay imaging is projected to grow at a CAGR of 8.35% through 2031.
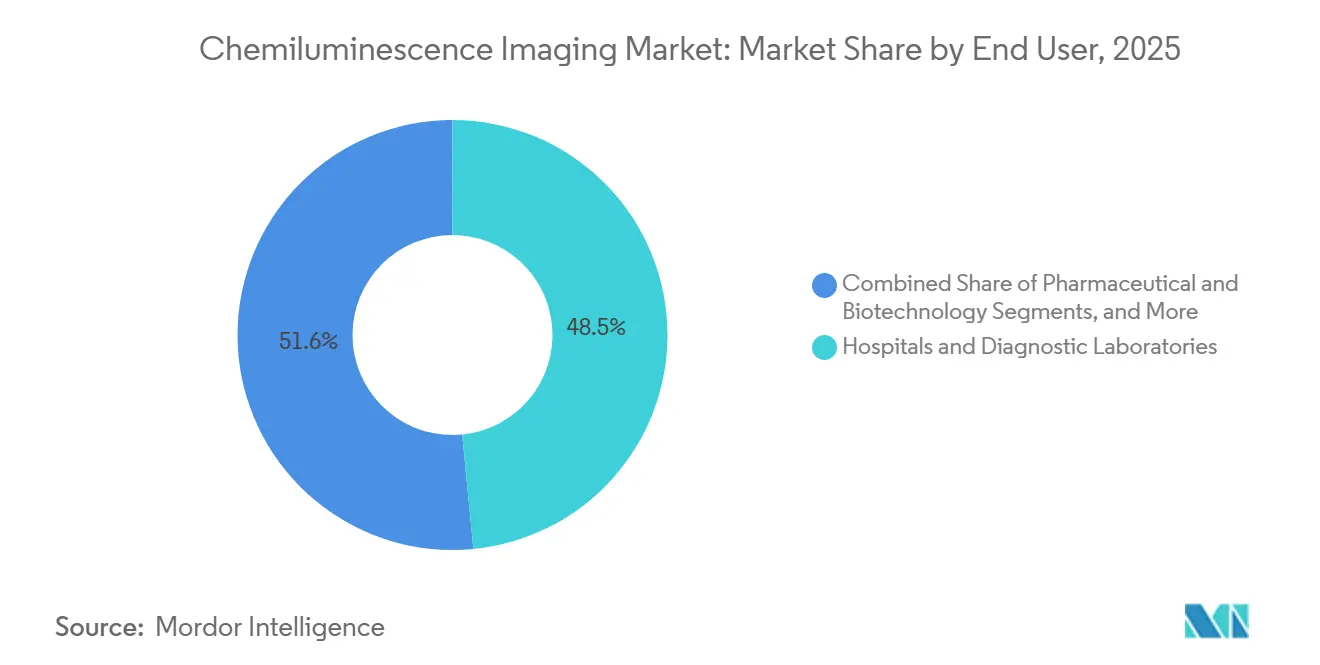
- By end user, hospitals and diagnostic laboratories held 48.45% of revenue in 2025, while pharmaceutical and biotechnology companies are projected to expand at a CAGR of 9.45% through 2031.
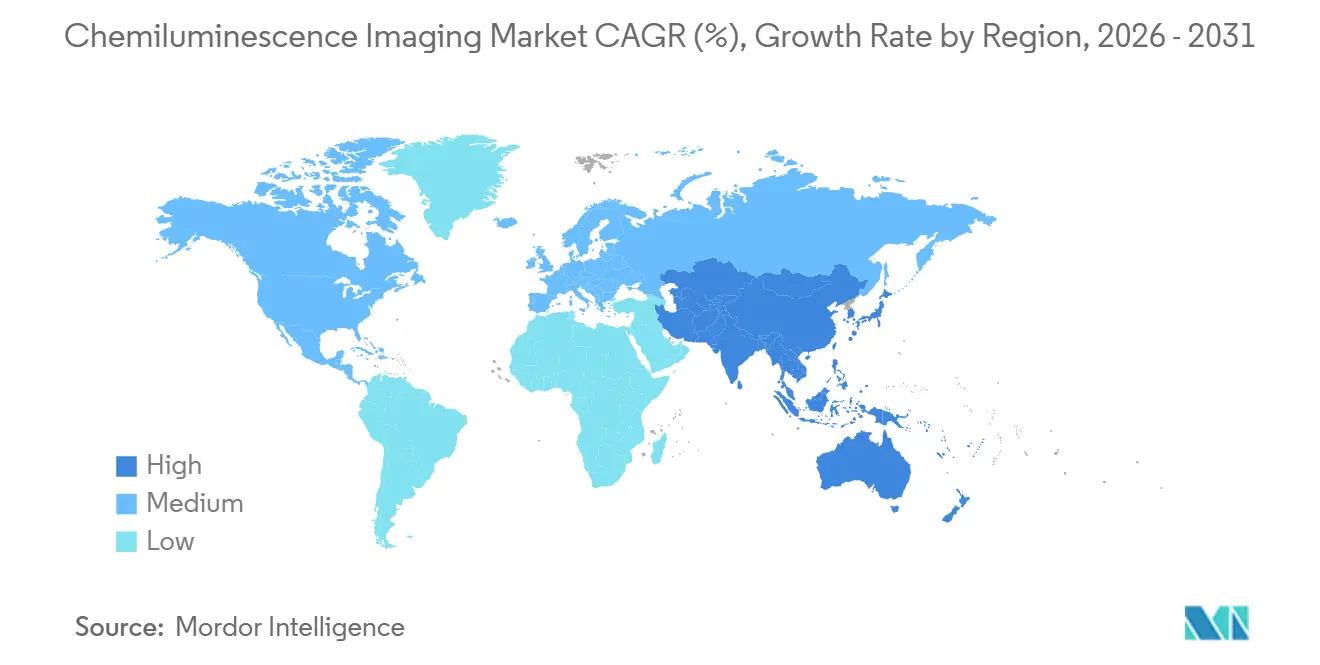
- By geography, North America held 39.44% of revenue in 2025, while Asia-Pacific is projected to grow at a CAGR of 11.88% through 2031.
Note: Market size and forecast figures in this report are generated using Mordor Intelligence’s proprietary estimation framework, updated with the latest available data and insights as of January 2026.
Market Trends and Insights
Drivers Impact Analysis of Chemiluminescence Imaging Market*
| DRIVER | (~) % IMPACT ON CAGR FORECAST | GEOGRAPHIC RELEVANCE | IMPACT TIMELINE |
|---|---|---|---|
| Quantitative camera-based western blotting | +1.8% | Global, with concentrated relevance in North America and Europe | Medium term (2-4 years) |
| High-sensitivity ECL protein research workflows | +1.5% | Global | Long term (≥ 4 years) |
| Multipurpose gel, blot, and luminescence platforms | +1.2% | North America and Europe, with growing relevance in Asia-Pacific | Medium term (2-4 years) |
| Cloud-connected image analysis and traceable quantification | +0.9% | North America and Europe, with Asia-Pacific emerging | Medium term (2-4 years) |
| Absolute photon-counted quantification | +0.5% | North America and Europe, with early adoption in Japan | Long term (≥ 4 years) |
| Source: Mordor Intelligence | |||
Expansion of Quantitative Camera-Based Western Blotting
The shift from X-ray film to scientific-grade digital camera detection remains a key driver of the chemiluminescence imaging market. Smaller academic laboratories and facilities in emerging economies have not completed this transition. Scientific CMOS sensors provide more than 75% peak quantum efficiency and 65,536 gray levels, supporting consistent quantitative protein analysis. Digital capture also retains timestamps, audit trails, and laboratory information management system data.
These capabilities support pharmaceutical quality control, where laboratories must maintain data integrity. Higher compliance requirements drive demand for premium instruments in regulated settings. Digital workflows enable consistent exposure comparison, electronic record retention, and reduced manual documentation. The market benefits as laboratories replace legacy processes with validated digital workflows that provide sensitive detection and traceable records.
Continued Use of High-Sensitivity ECL Workflows in Protein Research
ECL-based western blotting remains widely used to detect low-abundance proteins in research workflows. The method supports sensitive detection through HRP-catalyzed luminol oxidation under optimized substrate conditions. Biologics programs require repeated characterization of therapeutic antibodies and related proteins, supporting the use of validated detection methods in development and quality-control activities. The chemiluminescence imaging market remains linked to recurring testing demand. Laboratories face substantial revalidation requirements when changing established detection methods, which preserves the role of ECL workflows. Recurring substrate use also supports consumables revenue after instrument installation and limits the transition to alternative detection platforms.
Demand for Multipurpose Gel, Blot, and Luminescence Imaging Platforms
Laboratories with limited bench space or constrained budgets are increasingly selecting platforms that combine gel documentation, western blotting, and luminescence detection. This approach reduces the need to validate separate instruments for each workflow. Contract research and development organizations require flexible platforms to support diverse client projects. In July 2024, Bio-Rad introduced ChemiDoc Go, a benchtop unit with 20.48 MP BSI CMOS chemiluminescence detection, StarBright fluorescence, LED transillumination, and BR.io cloud connectivity. Integrated platforms increase switching costs because laboratories may need to replace related capabilities, software, and validated methods. This demand pattern favors vendors that combine optical performance, service support, and application expertise.
Cloud-Connected and Automated Image Analysis Adoption
Laboratory digitalization is transforming standalone imaging workstations into connected components of broader data and quality systems. Connected platforms provide remote image access, exposure optimization, software updates, and links to laboratory information management systems. These functions reduce manual review requirements and support data-integrity compliance. Bio-Rad has highlighted the importance of digital imaging controls for laboratory compliance. The chemiluminescence imaging market is expanding beyond cameras and optics, with software capabilities becoming an important purchasing consideration for regulated laboratories. Revvity launched Living Image Synergy AI in September 2025 for preclinical imaging analysis across optical, microCT, ultrasound, and other modalities. The platform demonstrated how automated segmentation and quantification can improve reproducibility and throughput.
Restraints Impact Analysis of Chemiluminescence Imaging Market*
| RESTRAINT | (~) % IMPACT ON CAGR FORECAST | GEOGRAPHIC RELEVANCE | IMPACT TIMELINE |
|---|---|---|---|
| Multiplex fluorescence and automated capillary western substitution | -0.9% | North America and Europe, where premium system budgets are available | Medium term (2-4 years) |
| Reproducibility and dynamic-range limits in chemiluminescent quantification | -0.8% | Global | Medium term (2-4 years) |
| Validation requirements for clinical and regulated workflows | -0.7% | North America and Europe, including FDA 21 CFR Part 11 and EU GMP Annex 11 settings | Long term (≥ 4 years) |
| Source: Mordor Intelligence | |||
Substitution by Multiplex Fluorescence and Automated Capillary Western Platforms
Near-infrared fluorescence systems offer a 4–5 order-of-magnitude dynamic range, compared with the 2–3 order range commonly associated with chemiluminescence. They detect 2–4 protein targets on a membrane without stripping and reprobing, providing laboratories with an alternative for multiplexing-focused experiments. Automated capillary western systems eliminate membrane transfer and blotting steps and complete assays in under 90 minutes, supporting high-throughput pharmaceutical screening. These alternatives constrain demand for conventional systems at the premium end of the chemiluminescence imaging market. Pressure is strongest for systems priced above USD 40,000, where laboratories have capital budgets for broader functionality. Mid-tier academic and government laboratories often have more limited budgets, making ECL-based chemiluminescence a more accessible option.
Reproducibility and Dynamic-Range Limitations in Chemiluminescent Quantification
Chemiluminescent signals can peak within seconds or minutes after substrate addition and then decline, creating variation between runs and operators. A 2–3 logarithmic order dynamic range can make it difficult to capture both high- and low-abundance proteins in a single exposure. Laboratories may require multiple exposures and additional image review, increasing reliance on skilled operators and established procedures. These limitations make reproducibility a continuing restraint for the chemiluminescence imaging market. Absolute photon-counting systems with NIST-traceable calibration can address exposure and comparability issues. However, premium system prices can limit adoption among academic and smaller diagnostic laboratories.
*Our forecasts treat driver/restraint impacts as directional, not additive. The impact forecasts reflect baseline growth, mix effects, and variable interactions.
Chemiluminescence Imaging Market Segment Analysis
By Product Type:
Installed Systems Support Revenue While Consumables Grow FasterChemiluminescence imaging systems held 68.40% of revenue in 2025, reflecting the capital value of instruments installed in laboratories. Service contracts, validated standard operating procedures, and operator training extend the commercial life of these systems. Consumables and reagents are forecast to grow at a CAGR of 7.90% from 2026 to 2031, as active platforms require compatible substrates and reagents throughout their operating life. This creates recurring revenue beyond the initial equipment purchase.
The installed base strengthens long-term relationships between instrument providers and laboratories. Reagent selection is often linked to validated protocols and system performance requirements, while connected platforms increase demand for accessories and software. Electronic audit trails, user access controls, and electronic signatures support regulated procurement requirements. The revenue mix can shift toward consumables, software licenses, and compliance-focused upgrades after system installation.

By Application:
Western Blotting Leads Revenue While Immunoassay Imaging Grows FasterWestern blotting accounted for 47.58% of the chemiluminescence imaging market size in 2025, driven by its routine use in molecular biology, proteomics, and biopharmaceutical quality control. The technique remains essential for protein verification and established laboratory workflows. Stain-free total protein normalization improves data quality while maintaining chemiluminescence detection workflows. Dot blotting, slot blotting, DNA and RNA hybridization, and reporter gene or luciferase assays remain smaller applications that use sensitive photon detection.
Chemiluminescence immunoassay imaging is forecast to grow at a CAGR of 8.35% from 2026 to 2031, supported by demand for sensitive biomarker measurement and standardized, high-throughput workflows. In March 2026, Siemens Healthineers launched the Atellica IM phosphorylated tau 217 and brain-derived tau chemiluminescent immunoassays for research use. These assays support quantitative measurement of Alzheimer’s-associated biomarkers through blood-based testing. Automated analyzers in clinical chemistry create a volume-driven model that expands the use of chemiluminescence in hospital laboratory testing.
By End User:
Hospitals Generate Volume While Pharma and Biotech Grow FasterHospitals and diagnostic laboratories accounted for 48.45% of revenue in 2025, reflecting the use of automated chemiluminescence immunoassay analyzers in centralized laboratory settings. These platforms can process more than 140 tests per hour and depend on standardized testing volumes and reagent cartridge utilization. This model differs from manual western blot imaging, where equipment replacement occurs less frequently. The chemiluminescence imaging market serves both demand models.
Pharmaceutical and biotechnology companies are forecast to grow at a CAGR of 9.45% from 2026 to 2031, driven by expanding biologics programs requiring robust protein characterization and reproducible documentation. In April 2026, Danaher subsidiary Abcam launched SimpleStep Ignite, a chemiluminescent ELISA platform offering 50 times higher sensitivity and a 35 times wider measuring range than colorimetric ELISAs, with results available in 55 minutes. The platform targets pharmaceutical companies, contract research organizations, and research laboratories seeking higher-throughput biomarker quantification. Academic institutions and forensic, food, agriculture, and environmental laboratories also support adoption for applications including allergen identification, GMO verification, and contaminant screening.
Geography Analysis
North America Chemiluminescence Imaging Market
North America held 39.44% of the chemiluminescence imaging market share in 2025, supported by biopharmaceutical investments, academic research, and clinical laboratory applications. The United States accounted for a significant share of regional demand, while FDA 21 CFR Part 11 requirements increased demand for systems with electronic records and audit trails. In May 2026, Siemens Healthineers stated that its Atellica IM Testosterone II immunoassay achieved CDC Hormone Standardization Program certification for total testosterone. Canada contributed through academic and government-funded research, while Mexico expanded with increasing pharmaceutical manufacturing investments.
EMEA and South America Chemiluminescence Imaging Market
Europe was the second-largest regional contributor to the chemiluminescence imaging market, led by established pharmaceutical and biomedical research systems in Germany, the United Kingdom, and France. The EU In Vitro Diagnostic Regulation affected deployment timelines for new immunoassay platforms in hospitals. In August 2025, Revvity’s Euroimmun division launched the IDS i20, a CE-marked and FDA-listed platform that runs 20 analytes across six diagnostic specialties at 140 tests per hour. Brazil led demand in South America, while demand in the Middle East and Africa was concentrated in GCC hospital networks. Import dependence above 70% in developing regions made supply reliability and currency-adjusted pricing important procurement considerations.
APAC Chemiluminescence Imaging Market
Asia-Pacific is forecast to grow at a CAGR of 11.88% from 2026 to 2031, the highest rate in the chemiluminescence imaging market. Government-directed proteomics spending, biopharmaceutical manufacturing growth, and clinical diagnostics investments support demand. China’s precision medicine and biotechnology programs strengthen research infrastructure, while Tanon Science & Technology competes in mid-tier imaging systems. India is expanding laboratory equipment procurement through Department of Biotechnology and Department of Science & Technology funding programs, while Japan, South Korea, Australia, Singapore, and Malaysia contribute through research, diagnostics, and biopharmaceutical manufacturing investments.
Competitive Landscape
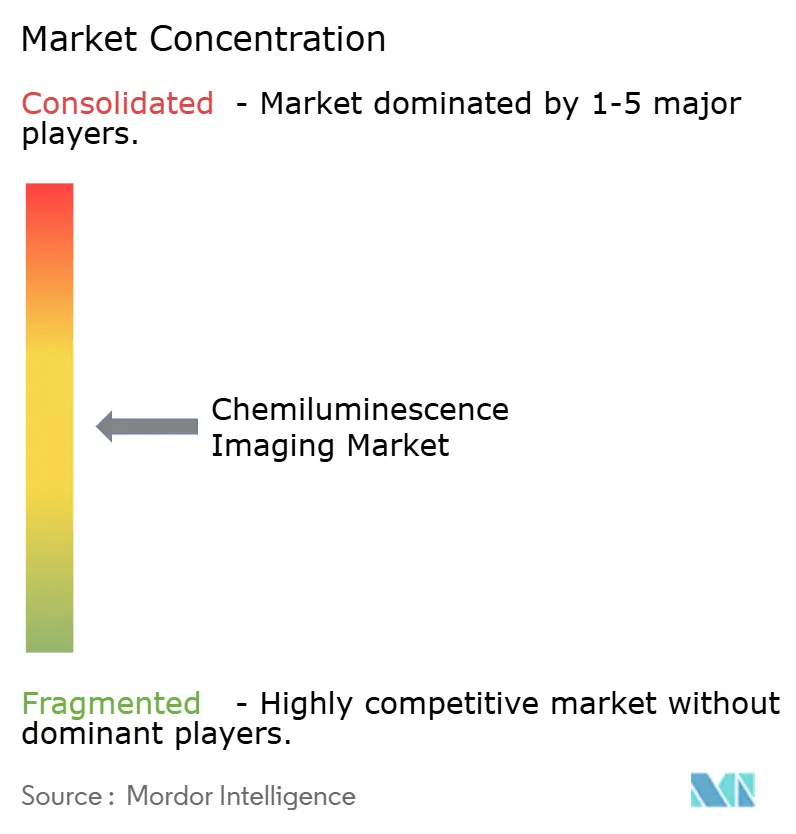
The chemiluminescence imaging market is moderately consolidated, with major life sciences and diagnostic companies holding significant positions. Thermo Fisher Scientific, Bio-Rad Laboratories, Danaher through Abcam and Beckman Coulter, Siemens Healthineers, and Revvity are among the leading suppliers of instruments and reagents. Instrument placements generate recurring demand for compatible reagents and assays, while diagnostic portfolios support recurring revenue in competitive accounts. Analytik Jena, Vilber, UVITec, and Azure Biosystems compete through optical performance, including quantum efficiency, lens aperture, and sensor cooling. Domestic Chinese manufacturers are expanding through government procurement channels and lower-cost systems, increasing price pressure in the mid-range segment.
Leading suppliers are integrating chemiluminescence, fluorescence, and UV documentation into unified systems. They are also incorporating automated quantification, cloud-based data management, and compliance features into their software platforms. Revvity introduced EnVision Nexus One at SLAS2026 in February 2026, featuring enhanced luminescence sensitivity and built-in 21 CFR Part 11 compliance tools through Kaleido software. This approach embeds regulatory software into the core platform. Similarly, Bio-Rad Laboratories launched ChemiDoc Go in July 2024, combining chemiluminescence detection, fluorescence, LED transillumination, and cloud connectivity in a benchtop device. These strategies increase switching costs and operational effort for users.
Clinical applications are an important strategic direction for the chemiluminescence imaging market. Vendors are expanding beyond research instruments into fully automated immunoassay analyzers for hospital laboratories. Siemens Healthineers received CE marking in July 2026 for 24 capillary blood testing claims on Atellica CH, IM, and CI analyzers, including systems with chemiluminescent immunoassay capabilities. Point-of-care chemiluminescence immunoassay devices remain a future growth opportunity. Competition is stronger in the mid-range tier, while premium systems retain pricing through sensitivity, traceability, and workflow integration.
Chemiluminescence Imaging Industry Leaders
-
Bio-Rad Laboratories, Inc.
-
Danaher Corporation
-
Siemens Healthineers AG
-
Merck KGaA
-
Thermo Fisher Scientific Inc.
- *Disclaimer: Major Players sorted in no particular order
Chemiluminescence Imaging Market Companies Covered in this Report
- Analytik Jena
- ATTO
- Azure Biosystems
- Berthold Technologies
- Bio-Rad Laboratories
- Bio-Techne
- Cleaver Scientific
- Danaher
- DiaSorin
- LI-COR, Inc.
- Merck
- Pop-Bio Ltd
- Revvity, Inc.
- Siemens Healthineers
- Syngene International
- Tanon Science & Technology Co., Ltd.
- Tecan Group
- Thermo Fisher Scientific
- UVITEC Limited
- Vilber GmbH
Recent Industry Developments in Chemiluminescence Imaging Market
- May 2026: Siemens Healthineers announced that its Atellica IM Testosterone II chemiluminescent immunoassay received CDC Hormone Standardization Program certification for Total Testosterone, supported by validation published in The Journal of Clinical Endocrinology & Metabolism.
- April 2026: Danaher subsidiary Abcam launched the SimpleStep Ignite chemiluminescent ELISA platform, offering 50 times greater sensitivity, a 35 times broader measuring range, and 55-minute completion versus colorimetric ELISAs.
- February 2026: Revvity unveiled the EnVision Nexus One multimode plate reader with enhanced luminescence detection and 21 CFR Part 11 compliance tools, alongside the Opera Phenix OptIQ screening system for cellular imaging.
Global Chemiluminescence Imaging Market Report Scope
As per the scope of the report, chemiluminescence imaging is an analytical technique that captures and visualizes the light emitted from chemical reactions. It requires no external light source, relying instead on internal chemical energy to map target molecules like proteins, DNA, or cellular processes with high sensitivity.
The chemiluminescence imaging market is segmented by product type, application, end user, and geography. By product type, the market includes chemiluminescence imaging systems, consumables and reagents, and accessories and software. By application, the market is segmented into Western blotting, gel documentation, dot blot and slot blot analysis, chemiluminescence immunoassay imaging, DNA and RNA hybridization, reporter gene and luciferase assays, and others. By end user, the market is segmented into pharmaceutical and biotechnology companies, academic and research institutes, hospitals and diagnostic laboratories, contract research and development organizations, forensic laboratories, food, agriculture, and environmental testing laboratories, and others. By geography, the market is analyzed across North America, Europe, Asia-Pacific, the Middle East and Africa, and South America. The report also covers the estimated market sizes and trends for 17 countries across major regions globally. The report offers market sizes and forecasts in terms of value (USD) for the above segments.
Segmentation Overview
| Chemiluminescence Imaging Systems |
| Consumables and Reagents |
| Accessories and Softwares |
| Western Blotting |
| Gel Documentation |
| Dot Blot and Slot Blot Analysis |
| Chemiluminescence Immunoassay Imaging |
| DNA and RNA Hybridization |
| Reporter Gene and Luciferase Assays |
| Others |
| Pharmaceutical and Biotechnology Companies |
| Academic and Research Institutes |
| Hospitals and Diagnostic Laboratories |
| Contract Research and Development Organizations |
| Forensic Laboratories |
| Food, Agriculture and Environmental Testing Laboratories |
| Others |
| North America | United States |
| Canada | |
| Mexico | |
| Europe | Germany |
| United Kingdom | |
| France | |
| Italy | |
| Spain | |
| Rest of Europe | |
| Asia-Pacific | China |
| India | |
| Japan | |
| Australia | |
| South Korea | |
| Rest of Asia-Pacific | |
| Middle East and Africa | GCC |
| South Africa | |
| Rest of Middle East and Africa | |
| South America | Brazil |
| Argentina | |
| Rest of South America |
| By Product Type | Chemiluminescence Imaging Systems | |
| Consumables and Reagents | ||
| Accessories and Softwares | ||
| By Application | Western Blotting | |
| Gel Documentation | ||
| Dot Blot and Slot Blot Analysis | ||
| Chemiluminescence Immunoassay Imaging | ||
| DNA and RNA Hybridization | ||
| Reporter Gene and Luciferase Assays | ||
| Others | ||
| By End User | Pharmaceutical and Biotechnology Companies | |
| Academic and Research Institutes | ||
| Hospitals and Diagnostic Laboratories | ||
| Contract Research and Development Organizations | ||
| Forensic Laboratories | ||
| Food, Agriculture and Environmental Testing Laboratories | ||
| Others | ||
| By Geography | North America | United States |
| Canada | ||
| Mexico | ||
| Europe | Germany | |
| United Kingdom | ||
| France | ||
| Italy | ||
| Spain | ||
| Rest of Europe | ||
| Asia-Pacific | China | |
| India | ||
| Japan | ||
| Australia | ||
| South Korea | ||
| Rest of Asia-Pacific | ||
| Middle East and Africa | GCC | |
| South Africa | ||
| Rest of Middle East and Africa | ||
| South America | Brazil | |
| Argentina | ||
| Rest of South America | ||
Key Questions Answered in the Report
What is driving demand for chemiluminescence imaging systems?
Demand is supported by sensitive protein detection for biologics development, proteomics, clinical diagnostics, and recurring ECL reagent use after system placement.
How large is the chemiluminescence imaging market in 2026?
The chemiluminescence imaging market is USD 4.49 billion in 2026 and is projected to reach USD 5.98 billion by 2031 at a CAGR of 5.89%.
Which product category leads revenue?
Chemiluminescence imaging systems led with 68.40% of revenue in 2025, while consumables and reagents are forecast to grow at a CAGR of 7.90% through 2031.
Which application is growing fastest?
Chemiluminescence immunoassay imaging is the fastest-growing application, with a forecast CAGR of 8.35% from 2026 to 2031. Blood-based biomarker assays show how automated analyzers can extend chemiluminescence into clinical laboratory workflows beyond research-oriented protein verification and manual research imaging workflows, including high-volume standardized test panels.
Which end users are expanding fastest?
Pharmaceutical and biotechnology companies are forecast to grow at a CAGR of 9.45% through 2031, supported by biologics development and protein characterization needs. These users need reproducible data, documented quality procedures, and methods that fit existing validation practices during development, comparability, quality-control work, regulated laboratory review, and multi-site data comparisons.
Which region is growing fastest?
Asia-Pacific is forecast to grow at a CAGR of 11.88% from 2026 to 2031, supported by research infrastructure, biopharmaceutical manufacturing, and clinical diagnostics investment.