
Market Overview
| Study Period | 2020 - 2031 |
|---|---|
| Forecast Data Period | 2026 - 2031 |
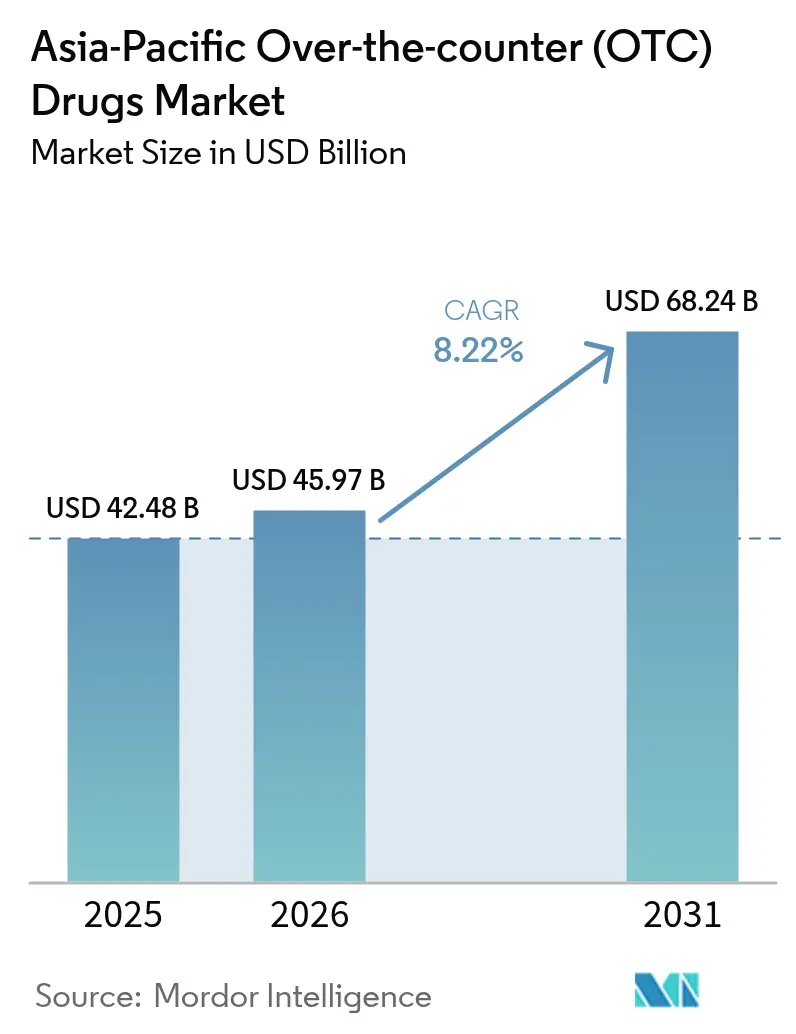
| Base Year Market Size (2025) | USD 42.48 Billion |
| Market Size (2026) | USD 45.97 Billion |
| Market Size (2031) | USD 68.24 Billion |
| Growth Rate (2026 - 2031) | 8.22 % |
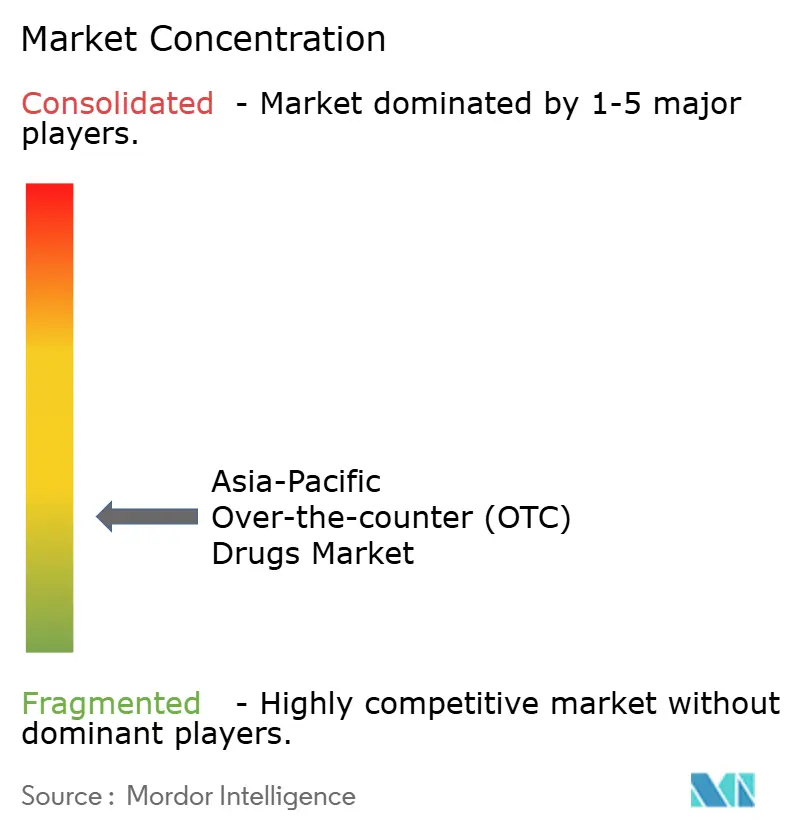
| Market Concentration | Low |
Major Players *Disclaimer: Major Players sorted in no particular order Image © Mordor Intelligence. Reuse requires attribution under CC BY 4.0. | |
Asia-Pacific Over-the-counter (OTC) Drugs Market Analysis by Mordor Intelligence
The Asia-Pacific Over-the-Counter (OTC) Drugs market size in 2026 is estimated at USD 45.97 billion, growing from 2025 value of USD 42.48 billion with 2031 projections showing USD 68.24 billion, growing at 8.22% CAGR over 2026-2031. Demand pivots on rising preventive-care mind-sets, widening self-medication habits and digital health ecosystems that simplify product discovery. Regulatory harmonization—from Japan’s switch pathways to the Philippines’ streamlined payment system—reduces approval friction, strengthening the Asia-Pacific Over-the-Counter (OTC) Drugs market’s resilience across diverse income tiers. Demographic aging intensifies chronic-condition prevalence, fueling demand for pain, digestive and sleep remedies, while urban stress and air pollution sustain cough, cold and respiratory categories. Multinational and local firms accelerate Rx-to-OTC switches, capturing higher margins and extending product lifecycles in a cost-sensitive environment. Digital commerce, AI-based self-diagnosis and omnichannel strategies reshape consumer touchpoints, reinforcing volume growth across both mature and emerging geographies.
Key Report Takeaways
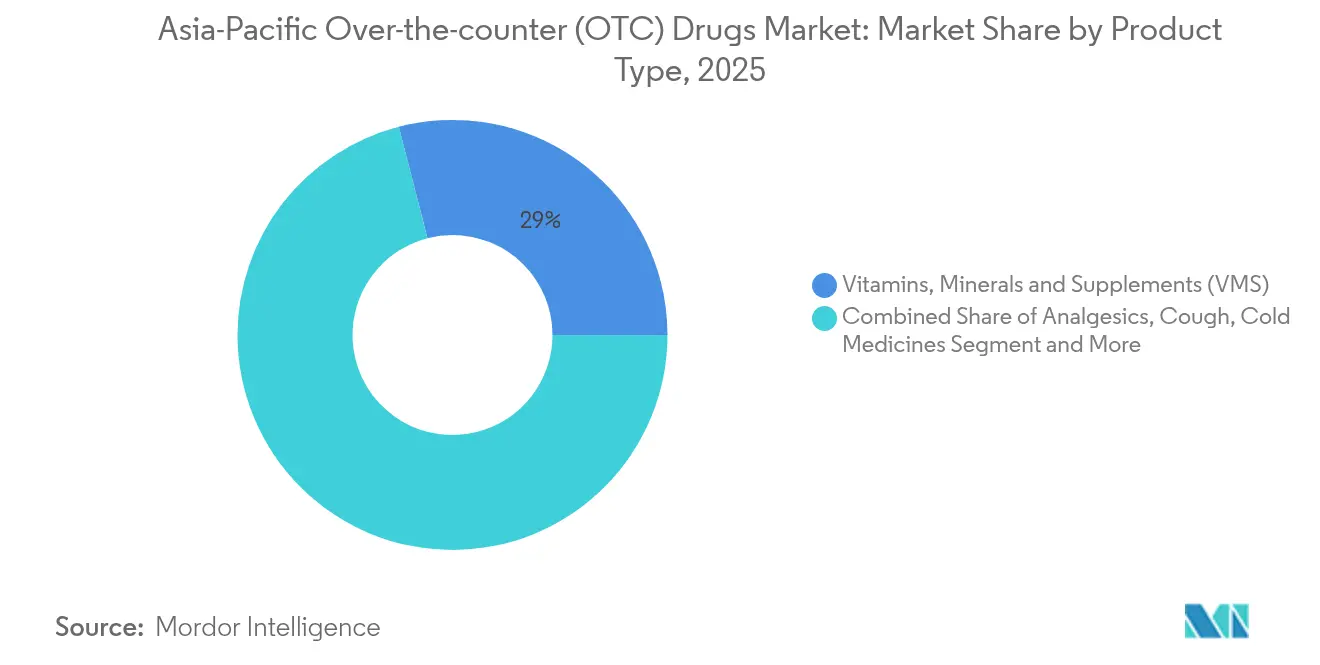
- By product type, Vitamins, Minerals & Supplements commanded 29.02% of Asia-Pacific Over-the-Counter (OTC) Drugs market share in 2025, whereas Sleep Aids are advancing at a 9.88% CAGR through 2031.
- By formulation, Tablets & Capsules held 44.84% share of the Asia-Pacific Over-the-Counter (OTC) Drugs market size in 2025, while Gummies & Chewables exhibit the fastest 13.12% CAGR to 2031.
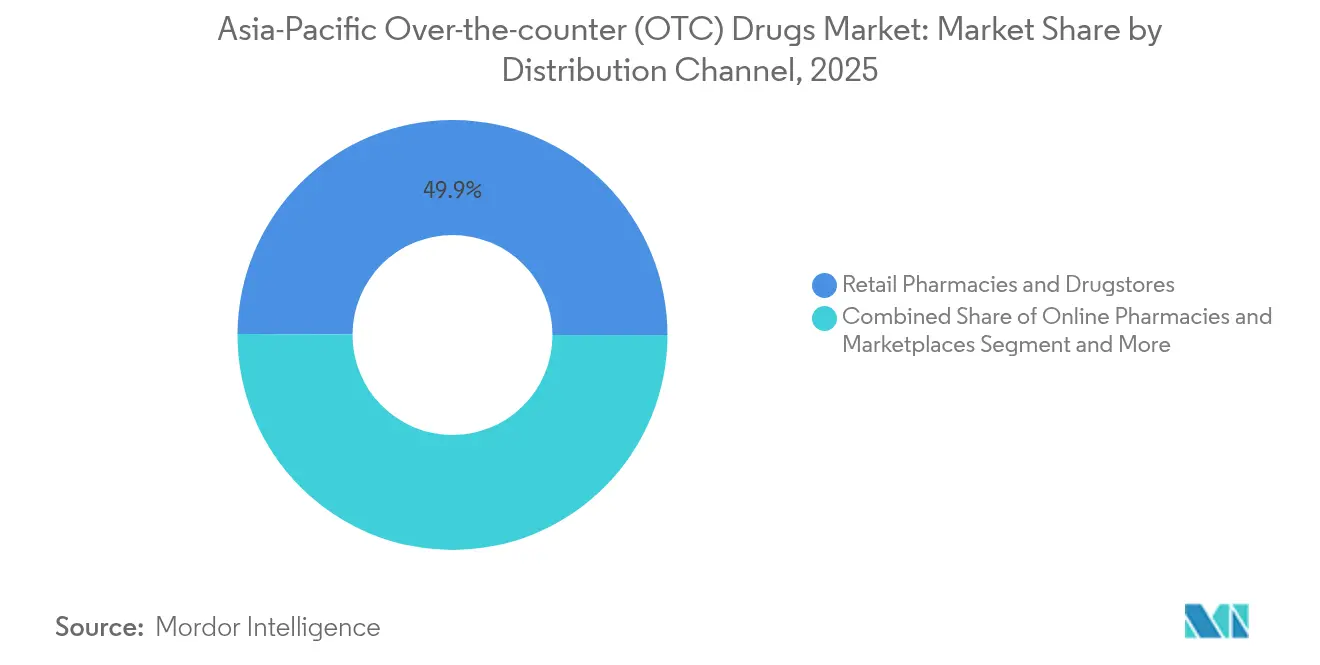
- By distribution, Retail Pharmacies & Drugstores led with 49.92% revenue share in 2025; Online Pharmacies & Marketplaces, however, are expanding at a 15.04% CAGR through 2031.
- By geography, China accounted for 36.05% of the Asia-Pacific Over-the-Counter (OTC) Drugs market in 2025, whereas India posts the region’s quickest 11.21% CAGR to 2031.
Note: Market size and forecast figures in this report are generated using Mordor Intelligence’s proprietary estimation framework, updated with the latest available data and insights as of 2026.
Asia-Pacific Over-the-counter (OTC) Drugs Market Trends and Insights
Drivers Impact Analysis*
| Driver | (~) % Impact on CAGR Forecast | Geographic Relevance | Impact Timeline |
|---|---|---|---|
| High Penetration In Emerging APAC Markets with Increasing OTC Approvals | +2.1% | Southeast Asia, India, Vietnam | Medium term (2-4 years) |
| Rx-To-OTC Switches by Multinational & Local Pharma | +1.8% | Japan, South Korea, Australia | Short term (≤ 2 years) |
| Rapid Growth of Self-Medication Among Ageing Population | +2.3% | Japan, China, South Korea | Long term (≥ 4 years) |
| Cross-Border E-Pharmacy Platforms Accelerating Regional Access | +1.5% | APAC core, spill-over to rural areas | Medium term (2-4 years) |
| AI-Based Self-Diagnosis Tools Driving Impulse OTC Purchases | +0.9% | Urban centers across APAC | Short term (≤ 2 years) |
| Source: Mordor Intelligence | |||
High Penetration in Emerging APAC Markets with Increasing OTC Approvals
Emerging economies remove bureaucratic bottlenecks, enabling faster brand rollouts and improving safety oversight through harmonized digital submissions. The Philippines’ new payment portal has trimmed approval lead-times from months to weeks, prompting multinationals to prioritize Asia-first launches over traditional Western rollouts. Rising investment inflows in Vietnam and Indonesia facilitate technology transfer that equips domestic firms with improved formulation skills. Superior pharmacist training and upgraded retail footprints nurture consumer trust in self-medication, boosting the Asia-Pacific Over-the-Counter (OTC) Drugs market across lower-income cohorts.
Rx-to-OTC Switches by Multinational & Local Pharma
Structured switch programs, notably in Japan, have shifted allergy sprays and proton-pump inhibitors to OTC status, enlarging access while securing premium pricing for proven actives. Sato Pharmaceutical’s once-daily Nazoncek nasal spray exemplifies how timely switches create fresh categories, generate exclusivity windows and protect brand equity. Local manufacturers exploit cultural nuance by tailoring flavor, dosage and pack size, running neck-and-neck with global giants as the Asia-Pacific Over-the-Counter (OTC) Drugs market widens.
Rapid Growth of Self-Medication Among Ageing Population
Longer lifespans and strained healthcare systems motivate seniors to self-manage minor ailments. In Japan, affluent retirees willingly pay for premium joint-pain and digestive solutions, demonstrating a readiness to trade up for trusted brands. Adult children often act as proxy shoppers for elders, inflating unit volumes. Heightened health literacy and steep out-of-pocket costs steer chronic symptom management toward community pharmacies, embedding OTC options within household health routines[1]The World & Vietnam Report, “Vietnam's Pharmaceutical Sector Sees Surge in Major M&A Activity,” baoquocte.vn.
Cross-Border E-Pharmacy Platforms Accelerating Regional Access
Mobile-first marketplaces bypass geographic barriers, allowing remote consumers to acquire SKUs absent locally. Regulatory arbitrage permits products cleared in one jurisdiction to reach neighboring markets online, stretching the Asia-Pacific Over-the-Counter (OTC) Drugs market beyond domestic boundaries. Aggregated demand lowers procurement costs, while verified supplier networks mitigate authenticity concerns. Logistics scale—from same-day fulfilment in metro zones to drone pilots in islands—builds a defensible moat for digital players.
Restraints Impact Analysis*
| Restraint | (~) % Impact on CAGR Forecast | Geographic Relevance | Impact Timeline |
|---|---|---|---|
| Low Consumer Awareness & Risk of Drug Abuse | -1.2% | Rural areas across APAC | Long term (≥ 4 years) |
| Stringent, Non-Harmonised OTC Regulations Across APAC | -1.8% | APAC-wide regulatory complexity | Medium term (2-4 years) |
| API Supply-Chain Concentration Creating Stock-Out Risks | -1.4% | Global, concentrated in China dependency | Short term (≤ 2 years) |
| Growth Of Counterfeit OTC Products on E-Commerce Sites | -0.8% | E-commerce platforms across APAC | Medium term (2-4 years) |
| Source: Mordor Intelligence | |||
Low Consumer Awareness & Risk of Drug Abuse
Limited health literacy in rural zones elevates misuse risks, prompting authorities to restrict pack sizes and enforce warning labels that dampen market uptake. Companies must allocate budget to education campaigns in multiple languages, raising cost-of-sales ratios within the Asia-Pacific Over-the-Counter (OTC) Drugs market. Pharmacies hesitate to widen assortments when liability fears loom, and traditional medicine beliefs sometimes clash with dosage norms.
Stringent, Non-Harmonised OTC Regulations Across APAC
Fragmented rules inflate dossier customization and extend time-to-market. Small players struggle with country-specific labeling, serialization and post-market surveillance, encouraging consolidation that paradoxically narrows consumer choice. Continuous compliance audits drain working capital, discouraging novel formulation trials within the Asia-Pacific Over-the-Counter (OTC) Drugs market. Regional trade pacts promise gradual convergence, yet progress remains uneven[2]Food and Drug Administration Philippines, “Drug Products Verification Portal,” fda.gov.ph.
*Our forecasts treat driver/restraint impacts as directional, not additive. The impact forecasts reflect baseline growth, mix effects, and variable interactions.
Segment Analysis
By Product Type: VMS Dominance Meets Sleep Innovation
Vitamins, Minerals & Supplements anchored the Asia-Pacific Over-the-Counter (OTC) Drugs market with a 29.02% slice in 2025, reflecting persistent demand for immune, bone and metabolic support. Sleep Aids, however, are scaling at a 9.88% CAGR as urban screen exposure and shift-work cycles disrupt circadian rhythms. The Asia-Pacific Over-the-Counter (OTC) Drugs market size for Sleep Aids is forecast to reach a high-single-digit share by 2031, aided by melatonin gummies that combine natural positioning with palatable formats. Cough, Cold & Flu preparations maintain steady baseline volumes tied to pollution peaks, and analgesics cater to mobility-focused seniors and fitness-minded millennials. Dermatology OTCs capitalize on K-beauty influence, while probiotics and antacids address diet-driven digestive issues across the region’s diverse cuisines.
Extended shelf space for premium omega-3, collagen and joint formulas reflects growing affordability among middle-income households. Retailers deploy end-cap promotions for immunity bundles, cross-merchandising with functional beverages to reinforce preventive care behavior. E-pharmacy search analytics reveal surging keyword queries for “natural sleep” and “herbal stress relief,” informing targeted SKU introductions. Regulatory scrutiny around weight-loss aids persists, yet demand endures through herbal claims compliance. Ophthalmic OTCs gain ground as screen-induced dry-eye cases climb, confirming the Asia-Pacific Over-the-Counter (OTC) Drugs market’s adaptability to lifestyle shifts.



By Formulation Type: Traditional Tablets Face Gummy Innovation
Tablets & Capsules dominated with 44.84% revenue in 2025, underpinned by cost efficiencies and dosing precision. Gummies & Chewables, posting a 13.12% CAGR, capture taste-averse demographics and support daily-routine adherence. Enhanced bioavailability formats—including fast-melt strips and liposomal gels—surface as premium propositions, reinforcing differentiation within the Asia-Pacific Over-the-Counter (OTC) Drugs market. Liquids & Syrups sustain traction among pediatric and geriatric cohorts who require ease of swallowing, while sprays cater to respiratory and topical pain niches that demand rapid onset.
Flavor, texture and sugar-content optimization guide new-product pipelines. Manufacturers integrate plant-based gelling agents to attract vegan consumers, and child-resistant but senior-friendly closures improve compliance. Convenience packaging—single-serve sachets and pocket-size droppers—aligns with on-the-go usage. Topicals capitalize on traditional Chinese medicine ingredients, bridging heritage trust with modern R&D validation. Nasal and throat sprays gain further legitimacy after Japan’s approval of once-daily corticosteroid formulations, boosting consumer confidence in prescription-grade outcomes.
By Distribution Channel: Digital Disruption Accelerates
Retail Pharmacies & Drugstores retained 49.92% share in 2025, buoyed by face-to-face counseling and authenticity safeguards. Online Pharmacies & Marketplaces are doubling the Asia-Pacific Over-the-Counter (OTC) Drugs market growth rate at 15.04% CAGR by offering broad assortments, price comparison and discreet delivery options. Hybrid click-and-collect models let consumers secure online prices while obtaining in-store pharmacist verification, knitting satisfaction with safety. Hospital dispensaries focus on post-procedure symptom control and chronic comorbidity kits, whereas convenience stores add last-minute remedies near transit hubs.
Cross-border platforms integrate AI chatbots that auto-translate product data sheets, enhancing trust in foreign-language labeling. Blockchain lot-tracking battles counterfeit risk, and same-day delivery services adopt cold-chain pouches for probiotics and temperature-sensitive gels. Physical retailers invest in loyalty apps, leveraging purchase histories to push tailored offers that stretch basket sizes across the Asia-Pacific Over-the-Counter (OTC) Drugs market.
Geography Analysis
China’s 36.05% share underscores manufacturing heft, streamlined fast-track approvals and rising middle-class wellness budgets. Urban tier-2 and tier-3 cities now drive incremental volumes, propelled by e-commerce penetration that eclipses brick-and-mortar rollouts. India’s 11.21% CAGR outpaces the Asia-Pacific Over-the-Counter (OTC) Drugs market average, reflecting government-backed generic drug programs, widespread smartphone adoption and English-language telehealth services. Japan exhibits premiumization, with seniors favoring top-shelf brands positioned as near-prescription grade, and switch opportunities sustaining pipeline vitality.
Australia serves as pilot ground for multinational debuts due to transparent regulations and high per-capita spend, whereas South Korea showcases tech-enabled self-care ecosystems that weave wearables with pharmacy apps. Vietnam and Indonesia leverage foreign direct investment to upgrade manufacturing facilities, shortening supply chains and easing import reliance. Smaller ASEAN nations harmonize guidelines via regional trade accords, laying groundwork for collective bargaining power on pharmacovigilance and quality audits. Diverse cultural dynamics mandate localized messaging—from Ayurvedic-aligned positioning in India to TCM-infused labels in China—yet unified digital marketing frameworks enable regional campaign efficiencies, sustaining the Asia-Pacific Over-the-Counter (OTC) Drugs market momentum.
Regulatory Landscape
Asia-Pacific OTC regulation remains largely country-specific, with regulators tightening requirements around quality, labeling, and post-market obligations while expanding access channels in selected areas. In June 2026, Indonesia's BPOM implemented Regulation No. 5 of 2026 that expands distribution of OTC and limited OTC medicines into certain non-pharmacy retail outlets (for example, hypermarkets, supermarkets, and minimarkets). This broadens reach, but it also raises the bar for retail controls and consumer-use safeguards. Australia continues to anchor OTC access through Therapeutic Goods Administration (TGA) oversight, requiring products to be included on the Australian Register of Therapeutic Goods (ARTG) via registration or listing based on risk profile.
Compliance expectations are also being refreshed through formal guidance updates. In January 2026, Malaysia's National Pharmaceutical Regulatory Agency (NPRA) issued the Drug Registration Guidance Document (DRGD) 3rd Edition, 11th Revision, reinforcing administrative, licensing, and post-registration requirements that affect OTC and related self-care portfolios (including required consumer information for self-administered products). India continues to regulate drugs under the Drugs and Cosmetics Act (1940) and Rules (1945) administered through CDSCO, supporting a structured pathway for safety and quality while OTC category definitions and enforcement vary across the region.
Competitive Landscape
The Asia-Pacific Over-the-Counter (OTC) Drugs market features fragmentation: global heavyweights vie with agile domestic firms adept at rural distribution and culture-specific branding. Switch categories such as PPIs and intranasal steroids cluster around a few innovators due to regulatory rigor, whereas VMS and herbal topicals display low entry barriers that invite niche entrants. Partnerships between multinationals and local manufacturers multiply, exchanging advanced formulations for last-mile reach. White-space remains in under-served rural micro-markets, where drone pilots and mobile vans test viability. AI-infused recommendation engines and blockchain verification distinguish omnichannel leaders, who couple delivery speed with safety assurance.
Recent acquisitions signal portfolio rationalization; Eisai’s OTC launch of Pariet S and Livzon’s Vietnamese takeover expand regional footprints. Japanese and Singaporean conglomerates purchase heritage wellness brands to embed familiarity within digital channels while sustaining pharmacy shelf presence. Competitive advantage increasingly hinges on regulatory affairs scale, data-driven marketing and formulation science that merges traditional botanicals with clinically validated actives. The Asia-Pacific Over-the-Counter (OTC) Drugs market thereby rewards firms that can orchestrate multi-country compliance, algorithmic targeting and localized value propositions simultaneously.
Asia-Pacific Over-the-counter (OTC) Drugs Industry Leaders
Procter & Gamble
Sanofi SA
Dr. Reddy's Laboratories
Haleon PLC
Bayer AG
- *Disclaimer: Major Players sorted in no particular order

Market Opportunities and Future Outlook
Regulatory actions that widen access channels and formalize compliance documentation create room for OTC brands that can operate across both pharmacy and adjacent retail. Indonesia's BPOM Regulation No. 5 of 2026, which permits distribution of OTC and limited OTC medicines through select non-pharmacy retail formats, adds incremental points of sale that favor companies with strong packaging, labeling, and consumer-education toolkits suited to self-selection environments. Malaysia's January 2026 DRGD revision also increases the emphasis on robust registration and post-registration capabilities, which benefits portfolios that can keep pace with changing administrative and patient-information requirements.
Digital distribution and omnichannel execution are practical levers for reach across a geographically diverse region, particularly where authenticity concerns are rising and online access is accelerating. In South Korea, rapid adoption of online pharmaceutical distribution platforms (with local players such as Blue M Tech and Baropharm highlighted in 2025-2026 coverage) signals continued investment in tech-enabled inventory and fulfillment models that can support wider OTC assortments and faster replenishment. At the category level, ongoing Rx-to-OTC switch programs and premiumization in mature markets (notably Japan) support opportunities for differentiated formats (for example, gummies and once-daily therapies) that align with convenience, adherence, and consumer-led decision-making.
Recent Industry Developments
- May 2026: Procter & Gamble Health Limited reported FY2026 results and highlighted continued innovation in its consumer health portfolio, including Livogen Iron Gummies and Neurobion Nerve Pain Relief Cream. The update points to sustained investment behind format innovation (such as gummies) and topical self-care, aligning with faster-growing OTC sub-segments and modern retail activation in India.
- March 2026: Haleon announced a GBP 65 million investment to build a new oral health manufacturing facility in Shanghai, China. The capacity addition strengthens local supply agility for a major OTC player and supports deeper penetration beyond top-tier metros, matching demand expansion in tier 2 and tier 3 cities.
- June 2025: Eisai Co., Ltd. launched Pariet S, positioned as Japan's first OTC proton pump inhibitor, through pharmacies and drugstores. The launch adds to momentum in Rx-to-OTC switching in Japan, expanding access to higher-acuity self-care categories while raising competitive intensity for gastrointestinal OTC brands.


Research Methodology Framework and Report Scope
Market Definition and Coverage
For this study, the market covers non-prescription medicines that consumers can buy directly for self-care of common conditions, and it is measured as total sales value across Asia-Pacific in current US dollars.
Scope exclusions: Prescription-only drugs and in-hospital prescription therapies are not counted even if they treat similar symptoms.
Segmentation Overview
- By Product Type
- Cough, Cold & Flu Medicines
- Analgesics
- Non-opioid
- Opioid-based
- Dermatology OTC
- Topical Antifungals
- Acne Treatments
- Gastrointestinal OTC
- Antacids & Anti-ulcerants
- Laxatives & Antidiarrheals
- Vitamins, Minerals & Supplements (VMS)
- Weight-loss & Dietary Products
- Ophthalmic OTC
- Sleep Aids
- By Formulation Type
- Tablets & Capsules
- Liquids & Syrups
- Topicals (Creams, Ointments, Gels)
- Sprays & Inhalers
- Gummies & Chewables
- By Distribution Channel
- Hospital Pharmacies
- Retail Pharmacies & Drugstores
- Convenience & Grocery Stores
- Online Pharmacies & Marketplaces
- By Country
- China
- Japan
- India
- Australia
- South Korea
- Rest of South-East Asia
Data Sources, Market Sizing, and Validation
Desk Research
Desk work starts with building a clean view of the demand pool and the rules for what can be sold as OTC in each country. We typically review public medicine regulator portals and notices, such as national drug authorities and pharmacovigilance updates, to understand switches between prescription and OTC status and label requirements.
To size the market with practical inputs, we pull supporting indicators from sources such as WHO health statistics, World Bank macro and population series, UN Comtrade trade data for relevant pharmaceutical categories, national statistics offices for household spend and retail trends, and peer-reviewed public health journals for prevalence of common minor ailments. Company annual reports, investor presentations, association publications, and reputable press are then used to time major launches and channel shifts. Where available, our paid subscriptions for company financials and news intelligence, patent databases, and shipment-level import export records are used to cross-check directional movement. These desk sources are not exhaustive, and many other public references were used for data collection, validation, and clarification.
Primary Interviews and Surveys
Primary discussions are used to pressure-test what the desk inputs cannot fully explain, especially category mix, channel margins, and the practical impact of regulatory or reimbursement changes on OTC buying. We speak with a spread of manufacturers, distributors, pharmacy and retail channel participants, and healthcare practitioners where OTC switching behavior matters, and coverage is kept across major Asia-Pacific markets so assumptions are not driven by one country.
Distribution of primary research fieldwork respondents
| Company type | Respondent position |
|---|---|
| Top tier: 39% | CXOs: 13% |
| Mid tier: 42% | Functional/Unit leaders: 27% |
| Smaller Players: 19% | Managers: 60% |
Market-Sizing & Forecasting
Market sizing is built using a top-down approach where country-level OTC demand is reconstructed from population, age mix, self-medication adoption, and retail medicine spending signals, which are then adjusted by OTC eligibility and category mix. Once the regional total is formed, it is corroborated through selective bottom-up approximations, such as sampled brand and category price points multiplied by estimated volumes, distributor and retailer channel checks, and revenue benchmarks from a set of exposed suppliers, which helps correct for over-counting and under-counting.
Key model inputs include the share of medicines that are OTC versus prescription by country, pharmacy and non-pharmacy channel mix, average selling price movement by major OTC categories (for example cough and cold, analgesics, GI, dermatology, and VMS where it is treated as OTC), seasonality tied to respiratory outbreaks, and policy changes that influence OTC switches and advertising. For forecasting, we typically use scenario analysis supported by a light multivariate regression on macro drivers, then the forward path is reviewed with primary respondents so the assumptions stay realistic. Where data gaps exist for smaller countries, proxies are applied using comparable markets and per-capita consumption bands, and the impact is reviewed so it does not distort the regional total.
Data Validation & Update Cycle
Outputs are triangulated against independent signals such as trade movement, retail and pharmacy channel trends, and supplier commentary, and then variances are investigated before finalization. Outliers are flagged through country-by-country checks, category share sanity tests, and year-on-year growth reconciliation so sudden jumps are not accepted without a clear reason.
Before sign-off, the model and assumptions go through a multi-step analyst review, and follow-up calls are triggered when a variable moves outside the expected range (for example, a sharp ASP change or a large channel shift). Reports are refreshed annually, and interim updates are done when material events occur, such as major regulatory reclassifications or macro shocks. Right before delivery, we run a final data pass so clients receive the most current view available.
Mordor Intelligence's Asia Pacific Over the Counter Otc Drugs Market Market Size Versus Other Published Estimates
Published market sizes for Asia-Pacific OTC drugs often do not match because the scope lines are drawn differently and the underlying demand signals are not always aligned country by country. Differences also come from how firms treat product boundaries, currency timing, and how often assumptions are refreshed.
The table shows a wide spread, and in Mordor Intelligence's model the total includes vitamins, minerals, and supplements as an OTC product type while still excluding prescription-only therapies, which can materially change the starting value in countries where VMS is a large part of self-care spending.
Benchmark comparison
| Source | Market Size | Gaps in Research Methodology |
|---|---|---|
| Mordor Intelligence | USD 42.48 B (2025) | |
| Regional Consultancy A | USD 75.65 B (2025) | Uses a broader OTC interpretation that likely inflates the total through wider consumer health add-ons and less consistent country-level eligibility checks, and it appears to start from a higher spending pool before filtering to drug-only categories. |
| Trade Journal B | USD 52.20 B (2025) | Uses a different base-year set and country basket, which shifts the regional weight, and it tends to apply faster category growth and ASP progression without the same level of channel and regulatory cross-checks across markets. |
Taken together, the gap mostly comes down to what gets counted as OTC, how the country list is handled, and whether prices and category mix are reconciled with real channel signals. By keeping the steps repeatable and tying each country total back to a small set of observable inputs, the estimate stays easier to audit and update as the market changes.


Key Questions Answered in the Report
What is the current value of the Asia-Pacific Over-the-Counter (OTC) Drugs market?
It reached USD 45.97 billion in 2026 and is projected to hit USD 68.24 billion by 2031.
Which product category leads sales in the region?
Vitamins, Minerals & Supplements hold the largest 29.02% share.
Which segment shows the fastest growth?
Sleep Aids are expanding at a 9.88% CAGR through 2031.
How quickly are online pharmacies growing?
Online Pharmacies & Marketplaces are scaling at a 15.04% CAGR.
Which country contributes the most to regional revenue?
China commands 36.05% of total sales.
What factor most boosts market expansion?
Harmonized regulatory pathways and Rx-to-OTC switches together add over 3% to CAGR.
Page last updated on:





