
Asia-Pacific Advertising Video-on-Demand Market Size and Share
Market Overview
| Study Period | 2020 - 2031 |
|---|---|
| Forecast Data Period | 2026 - 2031 |
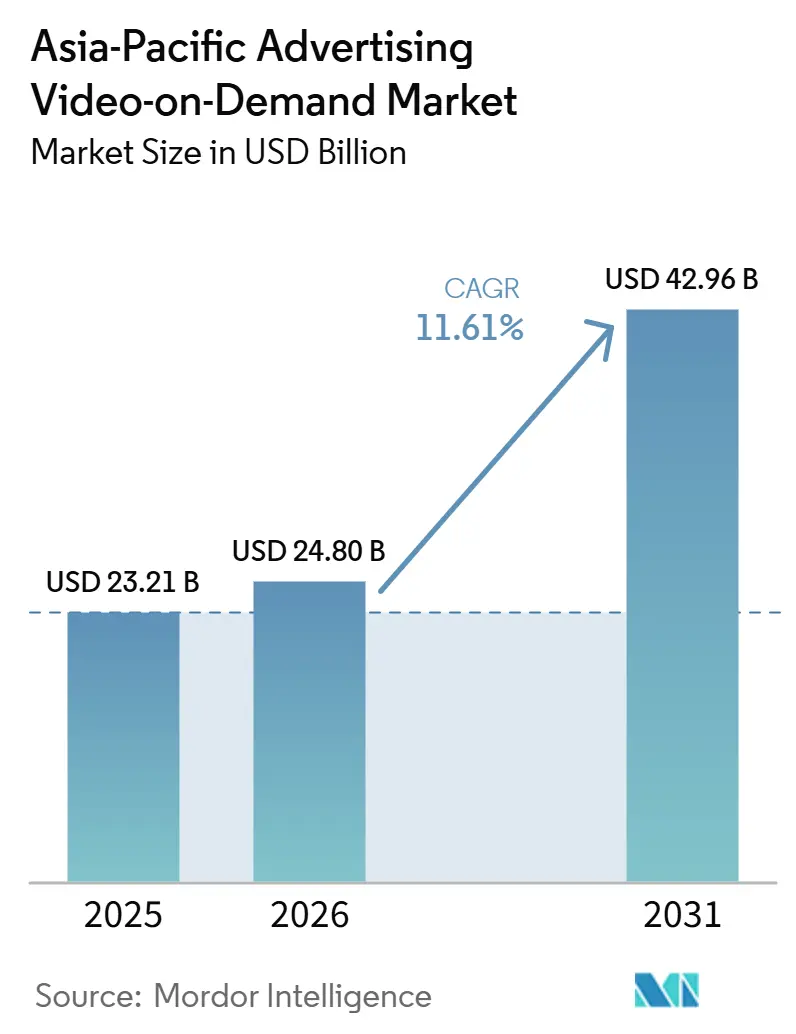
| Base Year Market Size (2025) | USD 23.21 Billion |
| Market Size (2026) | USD 24.80 Billion |
| Market Size (2031) | USD 42.96 Billion |
| Growth Rate (2026 - 2031) | 11.61 % |
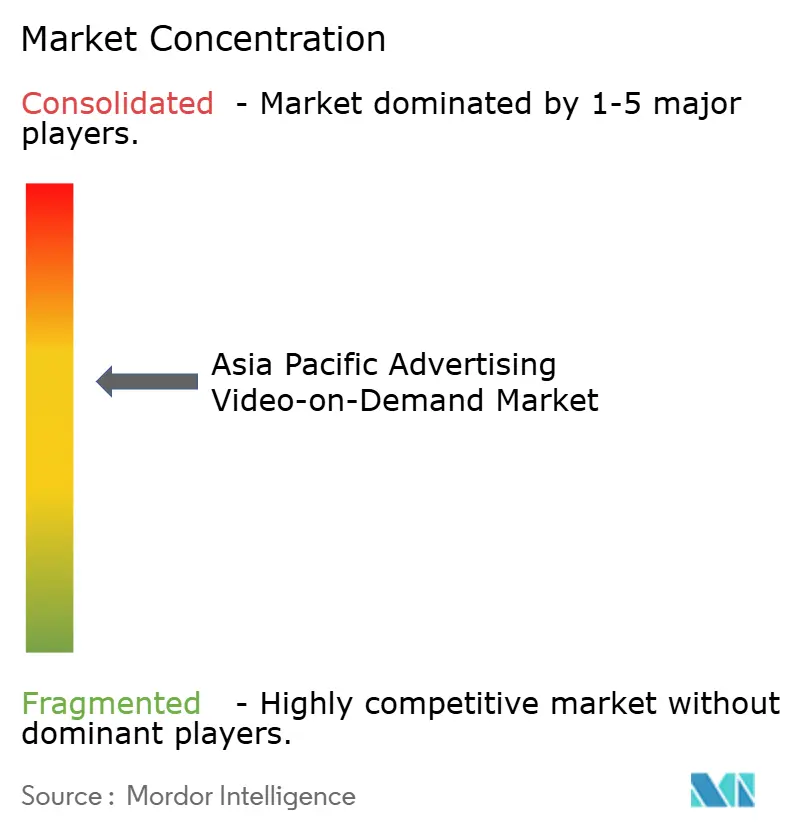
| Market Concentration | Medium |
Major Players *Disclaimer: Major Players sorted in no particular order Image © Mordor Intelligence. Reuse requires attribution under CC BY 4.0. | |
Asia-Pacific Advertising Video-on-Demand Market Analysis by Mordor Intelligence
The Asia-Pacific advertising video-on-demand market size is expected to grow from USD 23.21 billion in 2025 to USD 24.80 billion in 2026 and is forecast to reach USD 42.96 billion by 2031 at 11.61% CAGR over 2026-2031. The Asia-Pacific advertising video-on-demand (AVOD) market is expanding as audiences continue to shift from linear television toward digital video. Advertising-supported viewing fits the region’s price-sensitive, mobile-first consumer base and gives platforms a large addressable audience. The gap between regional video revenue per person and U.S. levels leaves room for stronger monetization as viewing time, data capabilities, and connected television inventory develop. Platforms with first-party data, local content, and direct relationships with telecom operators are better positioned to convert this audience growth into advertising revenue. Competition is also increasing around measurement, content costs, privacy compliance, and the ability to offer advertisers reliable, verified inventory.
Key Report Takeaways
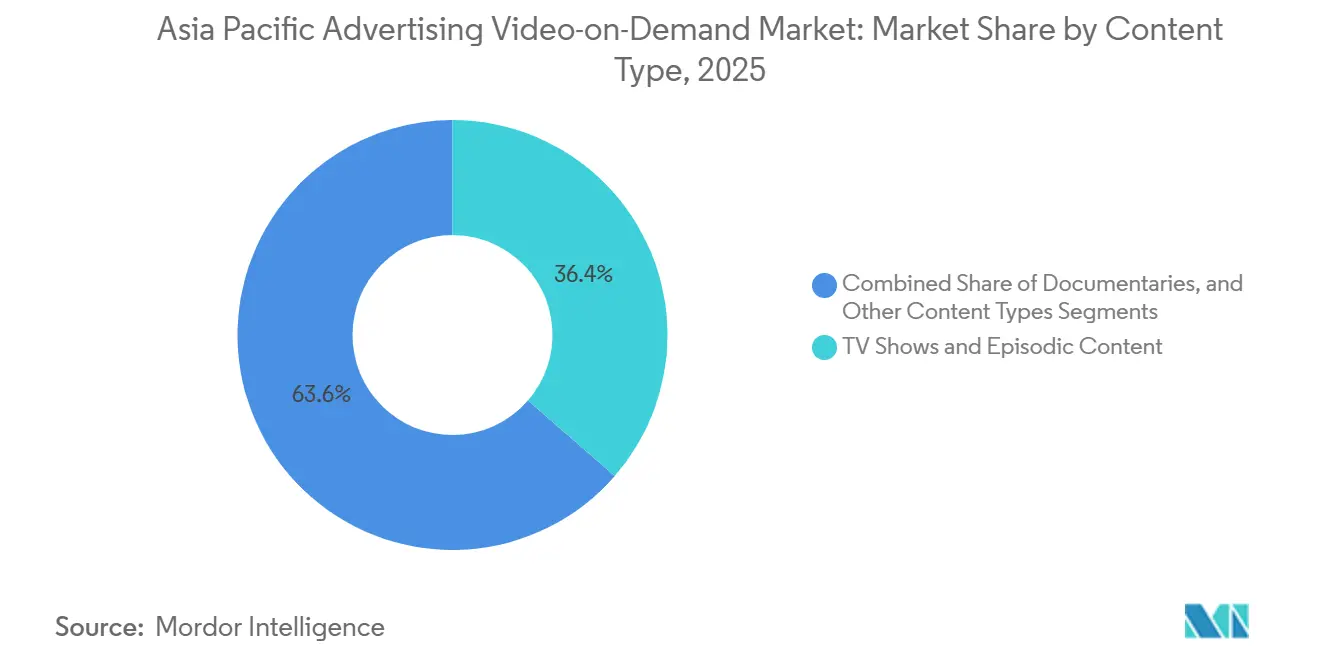
- By content type, TV shows and episodic content held 36.38% of the Asia-Pacific advertising video-on-demand market in 2025, while documentaries are projected to expand at a 12.18% CAGR through 2031.
- By device type, smartphones and tablets accounted for 38.81% of the Asia-Pacific advertising video-on-demand market in 2025, while smart TVs are projected to expand at an 11.91% CAGR through 2031.
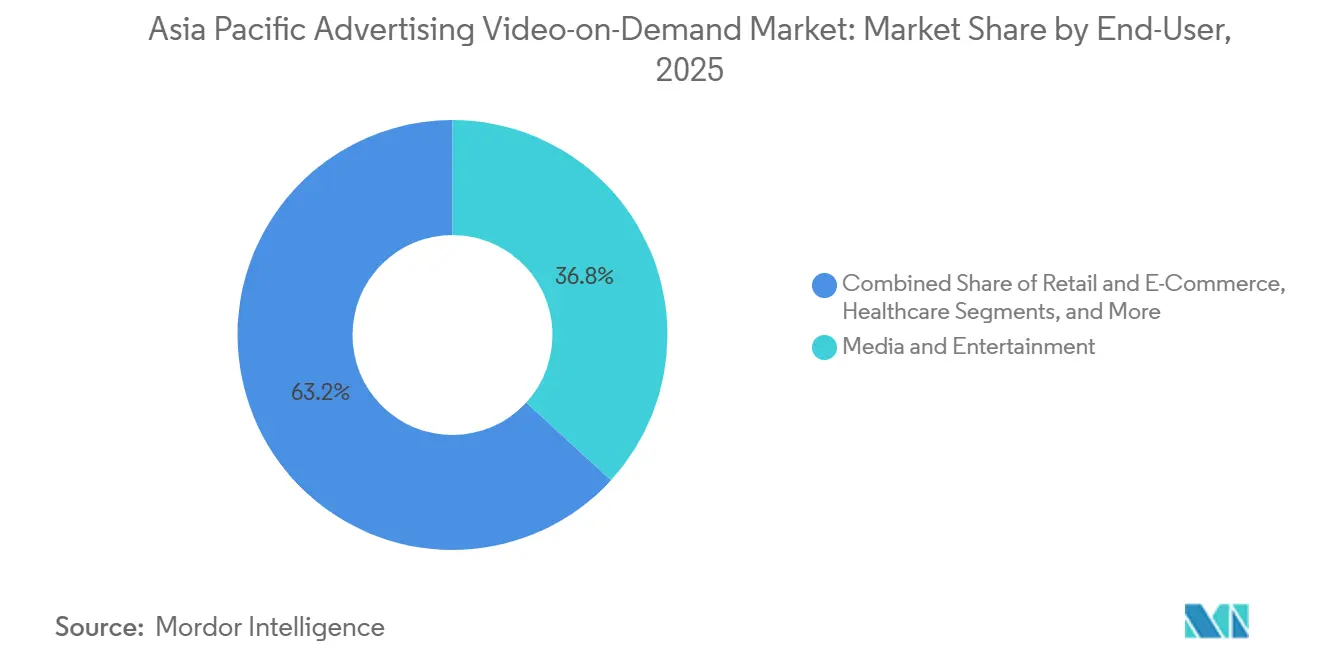
- By end-user, media and entertainment held 36.81% of the Asia-Pacific advertising video-on-demand (AVOD) market in 2025, while education is projected to expand at a 12.06% CAGR through 2031.
- By ad format, pre-roll accounted for 44.73% of the Asia-Pacific advertising video-on-demand (AVOD) market in 2025, while mid-roll is projected to expand at a 12.11% CAGR through 2031.
- By geography, China held 37.11% of the Asia-Pacific advertising video-on-demand market (AVOD) in 2025, while India is projected to expand at a 12.34% CAGR through 2031.
Note: Market size and forecast figures in this report are generated using Mordor Intelligence’s proprietary estimation framework, updated with the latest available data and insights as of January 2026.
Asia-Pacific Advertising Video-on-Demand Market Trends and Insights
Drivers Impact Analysis*
| Driver | (~) % Impact on CAGR Forecast | Geographic Relevance | Impact Timeline |
|---|---|---|---|
| Rising Connected TV Ad Spend Migration | +2.5% | Global, led by India, Australia, Japan, South Korea | Medium term (2-4 years) |
| Mobile-First Streaming and Affordable Data | +2.2% | Asia-Pacific core, strongest in India, Indonesia, Southeast Asia | Short term (≤ 2 years) |
| Localized and Multilingual Content Supply | +2.0% | Global, concentrated in India, Japan, South Korea, Southeast Asia | Medium term (2-4 years) |
| FAST and Broadcaster Library Monetization | +1.8% | Australia, Japan, South Korea, with spillover to Southeast Asia | Medium term (2-4 years) |
| Commerce Signal-Led and Shoppable CTV | +1.5% | Southeast Asia, India, Australia, early stage in Japan and South Korea | Long term (≥ 4 years) |
| Micro-Drama and AI-Enabled Content Localization | +1.3% | China, India, Indonesia, Japan, Thailand | Medium term (2-4 years) |
| Source: Mordor Intelligence | |||
Rising Connected TV Ad Spend Migration
Connected television is reshaping the Asia-Pacific advertising video-on-demand market because it combines wider household viewing with higher-value ad placements. Smart TVs provide a more suitable setting for longer creative formats, shared viewing, and premium brand campaigns than many mobile placements. Growing home broadband access and lower smart TV prices are expanding the available connected television audience across India, Australia, Japan, and South Korea. This supports a shift in platform strategy from reach alone toward the quality of attention and the price achieved for each impression. The move is still limited by fragmented measurement across platforms and device makers. A platform that gives advertisers a dependable view of reach and frequency can strengthen its role in the Asia-Pacific advertising video-on-demand (AVOD) market as linear budgets move to streaming.
Mobile-First Streaming and Affordable Data
Mobile access remains the main entry point to the Asia-Pacific advertising video-on-demand market for many households. Telecom operators support this model by bundling data plans with video services, which lowers the practical cost of streaming for prepaid and postpaid customers. These bundles also give platforms a route to large subscriber bases without relying only on direct consumer acquisition. India and Southeast Asia are especially important because low-cost smartphones are often the primary personal screen. The mobile environment also creates large volumes of commerce and viewing signals that can support more relevant advertising when consent is available. Platforms without strong telecom relationships may face weaker distribution and less access to audience intelligence.
Localized and Multilingual Content Supply
Localized programming is becoming a more direct revenue tool within the Asia-Pacific advertising video-on-demand market. Dubbing, subtitling, and language adaptation help services reach audiences that may not respond to a single national language catalog. CAMB.AI opened an Asia-Pacific office in Tokyo in July 2025 and partnered with Dentsu to support AI-driven translation and localization of Japanese media for international distribution.[1] South Korea’s Ministry of Science and ICT supported 20 K-Channel projects for local-language AI dubbing of more than 4,400 titles across 20 countries.[2] This approach can improve content utilization and make smaller language audiences commercially viable. It also raises the cost of underinvestment because local competitors can capture engaged viewers with more relevant programming.
FAST and Broadcaster Library Monetization
Free ad-supported streaming television gives broadcasters another way to earn from existing libraries within the Asia-Pacific advertising video-on-demand market. The model is attractive because news, entertainment, sports highlights, and catalog programming can be organized into continuous channels without the cost of commissioning every title. Broadcasters can use content that has already recovered much of its original production cost, which can improve the economics of each additional viewing hour. This makes FAST relevant in Australia, Japan, South Korea, and emerging Southeast Asian markets. The model also gives advertisers a more familiar television-like buying environment with digital delivery and targeting. Success depends on content rights, device distribution, and sufficient audience scale to support stable ad sales.
Restraints Impact Analysis*
| Restraint | (~) % Impact on CAGR Forecast | Geographic Relevance | Impact Timeline |
|---|---|---|---|
| Ad-Load Fatigue and Viewer Churn | -1.8% | Global, highest severity in Indonesia, Philippines, Thailand, Singapore | Short term (≤ 2 years) |
| Privacy-Led Targeting Constraints | -1.5% | Global, highest regulatory intensity in India, China, Australia, South Korea | Medium term (2-4 years) |
| Cross-Platform Measurement and Invalid Traffic Leakage | -1.2% | Asia-Pacific core, highest invalid traffic exposure in Japan, Singapore, India | Medium term (2-4 years) |
| Rights Fragmentation and Local Censorship Friction | -0.9% | India, Japan, Southeast Asia, with country-level variation | Long term (≥ 4 years) |
| Source: Mordor Intelligence | |||
Ad-Load Fatigue and Viewer Churn
Ad-load fatigue can limit growth in the Asia-Pacific advertising video-on-demand market when repeated or poorly timed commercials interrupt viewing. The Trade Desk reported in July 2025 that 66% of consumers across 6 Southeast Asian markets tuned out repetitive ads shown on a single channel.[3] Indonesia, the Philippines, and Thailand showed particularly high sensitivity to repeated exposure in that research. The problem is harder to manage when the same household sees a campaign across several services that do not share frequency controls. Platforms can respond through server-side ad insertion, creative rotation, and better relevance rules. Those investments can protect viewing sessions and help preserve the advertising inventory that supports the Asia-Pacific advertising video-on-demand (AVOD) market.
Privacy-Led Targeting Constraints
Privacy requirements are narrowing the data practices available to advertising-supported video services. India notified its Digital Personal Data Protection Rules in November 2025, creating a phased compliance schedule that includes consent and children’s data requirements for relevant digital services. China’s Cyberspace Administration published draft rules on app-level personal information collection and use in January 2026. Australia, South Korea, Japan, Singapore, Thailand, China, and India each have separate privacy frameworks that affect consent, data sharing, and audience profiling. This increases compliance work for platforms operating across several markets. Country-specific consent systems and first-party data practices can become a competitive advantage where they allow advertising activity to continue within local rules.
*Our forecasts treat driver/restraint impacts as directional, not additive. The impact forecasts reflect baseline growth, mix effects, and variable interactions.
Segment Analysis
By Content Type: Episodic Formats Lead, Documentaries Gain Ground
TV shows and episodic content held 36.38% of the Asia-Pacific advertising video-on-demand market in 2025. Serialized drama and reality formats can keep viewers engaged across several episodes and create more advertising opportunities within each session. Their repeatable structure also helps platforms schedule new releases and maintain a predictable content pipeline. Movies and films remain important, particularly in Japan and South Korea, where theatrical catalogs can add library depth without the cost of a fully original slate. Documentary viewing serves more defined interests, including finance, health, business, history, and science. This audience profile can be useful for advertisers seeking more specific contexts than broad entertainment provides.
Documentaries are projected to expand at a 12.18% CAGR through 2031, the highest rate among the listed content formats. The segment can benefit from viewers who select programs for clear informational purposes and may be more receptive to relevant advertising. Micro-dramas are also changing the role of other content categories in the Asia-Pacific advertising video-on-demand market. iQIYI reported in July 2026 that its micro-drama library had surpassed 50,000 titles, while original Chinese animation viewing duration rose 98% year over year. Short episodes fit mobile viewing habits and can support frequent ad opportunities without requiring long viewing sessions. FAST content, including news, sports highlights, and catalog programming, adds another source of programmatic inventory where broadcasters control usable library rights.

By Device Type: Mobile Dominates, Smart TVs Reshape Ad Yield
Smartphones and tablets accounted for 38.81% of the Asia-Pacific advertising video-on-demand market size in 2025. This position reflects widespread mobile ownership and the role of low-cost Android devices as primary screens in India and Southeast Asia. Mobile plans that include streaming access reduce the steps required for consumers to begin viewing. The device category gives platforms high reach and frequent daily touchpoints. It also provides a practical environment for short-form programming, vertical video, and commerce-linked advertising. Laptops and desktops remain relevant for professional, educational, and longer-form viewing, especially in Japan, South Korea, and Australia.
Smart TVs are projected to expand at an 11.91% CAGR through 2031. The shift toward connected television changes the revenue profile of the Asia-Pacific advertising video-on-demand market because big-screen placements can command stronger prices than standard mobile inventory. Connected television is particularly useful for brand advertising, live events, and long-form programming where viewers are more likely to watch with others. Smart TV viewing does not replace mobile use, since mobile remains important for reach and everyday access. Instead, the devices serve different needs, with mobile supporting scale and smart TVs supporting premium inventory. Platforms that offer consistent ad formats, measurement, and content experiences across both screens can better manage this split.
By End-User: Media and Entertainment Anchors Spend, Education Surges
Media and entertainment held 36.81% of the Asia-Pacific advertising video-on-demand market share in 2025. Studios, broadcasters, and streaming services use video advertising to promote releases, increase app installs, and maintain brand visibility. This creates a reinforcing demand pattern because many buyers of advertising are also participants in the video ecosystem. Live sports, entertainment launches, and major programming events can make video placements more valuable for these buyers. Retail and e-commerce advertisers are also using video to bring consumers toward marketplaces and direct checkout journeys. Financial services advertisers value longer viewing settings where product messages can be explained in more detail.
Education is projected to expand at a 12.06% CAGR through 2031, making it the fastest-growing listed end-user category. Edtech advertisers in India, Indonesia, and Vietnam can use video to reach learners by topic interest and likely intent, where consent-based targeting is available. Education campaigns can also use longer video formats to explain courses, test preparation, and digital learning products. Information technology and telecommunications advertisers concentrate investment around major events and sports programming that support premium mid-roll placements. Healthcare remains smaller but can expand as digital advertising rules for health-related content become clearer. The Asia-Pacific advertising video-on-demand industry therefore serves end users with different objectives, from broad awareness to app acquisition and qualified response.
By Ad Format: Pre-Roll Commands Scale, Mid-Roll Builds Strategic Importance
Pre-roll held 44.73% of the Asia-Pacific advertising video-on-demand market in 2025. The format appears before content begins, when viewers are preparing to watch, and the likelihood of exposure is high. It is also supported by mature programmatic buying systems that have long been configured for pre-roll inventory. As video libraries expand, the number of available pre-roll positions does not rise at the same rate as content hours. This can support stronger pricing for high-quality placements on major platforms. Pre-roll is therefore likely to remain an important entry format for advertisers moving budgets into streaming.
Mid-roll is projected to expand at a 12.11% CAGR through 2031. Longer streaming sessions give platforms more opportunities to place mid-episode advertising in ways that resemble broadcast breaks. Dynamic ad insertion can help select ads based on the program, the viewer profile, and a permitted purchase signal. JioStar integrated Swiggy food-delivery commerce during IPL 2026 live streaming, and reported that half of the resulting orders came from Tier-II Indian cities. This example shows how a mid-session placement can be designed as a transaction prompt rather than a standard interruption. Post-roll continues to provide a useful direct-response placement for viewers who complete content and show sustained engagement.
Geography Analysis
China held 37.11% of the Asia-Pacific advertising video-on-demand market share in 2025. The country’s scale is supported by a large domestic platform ecosystem that includes Tencent Video, iQIYI, Douyin, Youku, and Bilibili. Tencent reported FY2025 marketing services revenue of RMB 145.0 billion, or USD 20.1 billion, up 19% year over year, supported by improved advertising technology and greater time spent on Video Accounts. iQIYI’s July 2026 content update also indicated stronger activity in micro-dramas and animation. China’s data rules can limit cross-border audience data flows, increasing the importance of local compliance and advertising infrastructure.
India is projected to expand at a 12.34% CAGR through 2031, the fastest rate among the listed geographies. JioHotstar averaged 530 million monthly active users in Q1 FY2027, while IPL 2026 drew 1.2 billion combined viewers and 700 million digital viewers. Amazon Prime Video also confirmed its integration of MX Player with Prime Video India as part of its regional strategy. Japan and South Korea are more mature markets where premium content, sports, and connected television support revenue per user. South Korea is also using AI-dubbed K-content to reach international viewers through the K-FAST program. Australia has an established advertising-supported streaming environment built around services such as 7plus, 9Now, and 10Play.
Indonesia and other Southeast Asian markets provide a large opportunity for mobile-first and short-form video services. FlexTV and Telkomsel launched a bundled vertical short-drama package in Indonesia in January 2025, combining content and mobile data for IDR 77,000, or USD 4.80, for 30 days. Thailand is testing dedicated mini-series formats and has strong short-drama spending, according to reported platform activity. Vietnam, the Philippines, Malaysia, and smaller markets are developing their FAST and advertising technology infrastructure. These countries have different language, payment, rights, and regulatory environments, so expansion plans need local design. The Asia-Pacific advertising video-on-demand market benefits when platforms pair local content with telecom distribution and appropriate consent practices.
Competitive Landscape
The Asia-Pacific advertising video-on-demand market has a two-level competitive structure. Global platforms compete for advertising budgets and technology leadership, while national leaders defend audiences through local content, language, sports rights, and distribution relationships. The top 15 online video platforms captured 58% of total online video revenue in 2025. YouTube, ByteDance platforms, Netflix, Tencent Video, iQIYI, and Douyin are important at the regional or global level. JioHotstar, U-Next, TVING, and Viu have stronger national or subregional roles. This structure makes local operating knowledge as important as global scale.
Advertising yield is becoming a primary point of competition in the Asia-Pacific advertising video-on-demand market. Tencent reported that Q1 2026 marketing services revenue rose 20% year over year to RMB 38.2 billion, or USD 5.3 billion, supported by its upgraded AI advertising recommendation model. Larger platforms can use first-party data, established sales teams, and technology investment to improve pricing and reduce reliance on high ad loads. Google introduced Commerce Media Suite in Southeast Asia in 2025 with Shopee, linking advertising activity with marketplace commerce journeys. iQIYI also stated in its Q1 2026 results that it was using AI to reduce production costs and accelerate production cycles. These strategies can improve economics, but they require sustained investment that smaller operators may struggle to fund.
Viu and iQIYI International announced a streaming bundle for Indonesia, Thailand, the Philippines, and Malaysia in June 2026. The agreement indicates that content sharing and bundled access can be more efficient than duplicating catalog costs in each Southeast Asian market. Smaller operators also face higher pressure from privacy compliance, content rights fragmentation, and measurement gaps. Invalid traffic is a related concern because advertisers need confidence that paid impressions are genuine. DoubleVerify reported in May 2026 that connected television fraud schemes had risen 140% globally in the prior 12 months. Independent verification and cross-platform measurement can therefore become important sources of differentiation. The Asia-Pacific advertising video-on-demand industry remains competitive, with scale leaders holding an advantage but local platforms retaining meaningful defenses.
Asia-Pacific Advertising Video-on-Demand Industry Leaders
-
Alphabet Inc.
-
Tencent Holdings Limited
-
JioStar India Private Limited
-
ByteDance Ltd.
-
iQIYI, Inc.
- *Disclaimer: Major Players sorted in no particular order
Recent Industry Developments
- July 2026: iQIYI released H1 2026 content results showing its micro-drama library surpassed 50,000 titles, with original Chinese animation viewing duration rising 98% year over year and playback volume growing 63% year over year, reinforcing iQIYI’s position in long-form and short-form advertising-supported video in China.
- July 2026: JioStar reported Q1 FY2027 revenue of INR 10,946 crore, or USD 1.14 billion, up 14% year over year, with JioHotstar averaging 530 million monthly active users during the quarter. IPL 2026 reached 1.2 billion combined viewers, including 700 million digital viewers. JioStar also launched India’s first AI-generated micro-drama, “Game on: 4,000 crore Empire,” and integrated Swiggy food-delivery commerce during live IPL streaming.
- June 2026: Viu and iQIYI International announced a combined streaming subscription bundle at APOS 2026 in Bali, with rollout planned across Indonesia, Thailand, the Philippines, and Malaysia in H2 2026. The deal was iQIYI International’s first cross-regional streaming alliance in Southeast Asia.
- June 2026: Amazon Prime Video outlined its Asia-Pacific strategy at APOS 2026 in Bali. The company confirmed full advertising-supported and subscription video integration of MX Player into Prime Video India and committed to continued content investment in Japan.
Asia-Pacific Advertising Video-on-Demand Market Report Scope
Asia Pacific Advertising Video-on-Demand (AVOD) Market refers to streaming services in the Asia-Pacific region that offer on‑demand video content funded primarily by advertising rather than full-price subscriptions. These platforms provide free or low-cost access to movies, series, and other programming in exchange for pre‑roll, mid‑roll, or post‑roll video ads.
The Asia Pacific Advertising Video-on-Demand Market Report is Segmented by Content Type (Movies and Films, TV Shows and Episodic Content, and Documentaries), Device Type (Smartphones and Tablets, Smart TVs, and Laptops and Desktops), End-User (Media and Entertainment, Retail and E-Commerce, BFSI, Education, IT and Telecommunications, and Healthcare), Ad Format (Pre-Roll, Mid-Roll, and Post-Roll), and Geography (China, India, Japan, South Korea, Australia, and Indonesia). The Market Forecasts are Provided in Terms of Value (USD).
| Movies and Films |
| TV Shows and Episodic Content |
| Documentaries |
| Other Content Types |
| Smartphones and Tablets |
| Smart TVs |
| Laptops and Desktops |
| Other Device Types |
| Media and Entertainment |
| Retail and E-Commerce |
| Banking, Financial Services and Insurance |
| Education |
| Information Technology and Telecommunications |
| Healthcare |
| Other End-User Industries |
| Pre-Roll |
| Mid-Roll |
| Post-Roll |
| China |
| India |
| Japan |
| South Korea |
| Australia |
| Indonesia |
| Rest of Asia-Pacific |
| By Content Type | Movies and Films |
| TV Shows and Episodic Content | |
| Documentaries | |
| Other Content Types | |
| By Device Type | Smartphones and Tablets |
| Smart TVs | |
| Laptops and Desktops | |
| Other Device Types | |
| By End-User | Media and Entertainment |
| Retail and E-Commerce | |
| Banking, Financial Services and Insurance | |
| Education | |
| Information Technology and Telecommunications | |
| Healthcare | |
| Other End-User Industries | |
| By Ad Format | Pre-Roll |
| Mid-Roll | |
| Post-Roll | |
| By Geography | China |
| India | |
| Japan | |
| South Korea | |
| Australia | |
| Indonesia | |
| Rest of Asia-Pacific |
Key Questions Answered in the Report
What is the size of the Asia-Pacific advertising video-on-demand market?
The Asia-Pacific advertising video-on-demand market size is USD 24.80 billion in 2026 and is forecast to reach USD 42.96 billion by 2031.
What is driving advertising-supported video growth in Asia-Pacific?
Audience movement from linear television, mobile streaming access, connected television adoption, local content, and telecom bundles support demand.
Which content type leads advertising-supported video revenue in Asia-Pacific?
TV shows and episodic content led with 36.38% share in 2025, while documentaries are projected to record the fastest growth at 12.18% CAGR through 2031.
Which device is most important for advertising-supported video viewing?
Smartphones and tablets led with 38.81% share in 2025, while smart TVs are projected to expand at an 11.91% CAGR through 2031.
Which Asia-Pacific country is growing fastest for advertising-supported video?
India is projected to record the fastest growth among the listed geographies, with a 12.34% CAGR through 2031.
What are the main risks for advertising-supported video platforms?
Repetitive ad exposure, privacy rules, invalid traffic, fragmented measurement, and local content rights can reduce advertising effectiveness and raise operating costs.