
Asia-Pacific 3D Construction Market Size and Share
Market Overview
| Study Period | 2020 - 2031 |
|---|---|
| Forecast Data Period | 2026 - 2031 |
| Base Year Market Size (2025) | USD 1.45 Billion |
| Market Size (2026) | USD 1.9 Billion |
| Market Size (2031) | USD 9.78 Billion |
| Growth Rate (2026 - 2031) | 38.80 % |
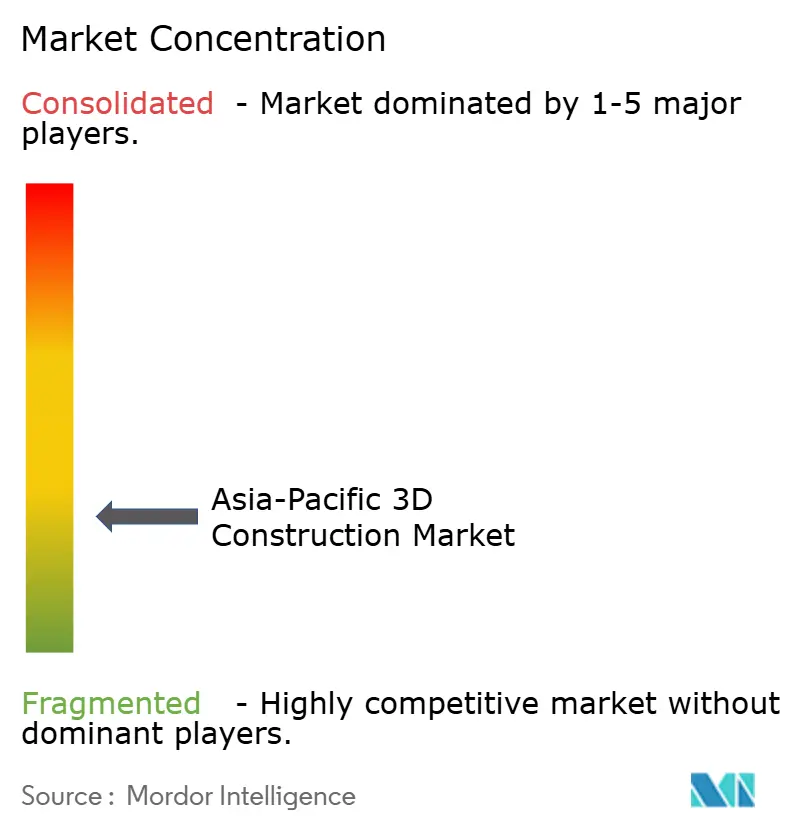
| Market Concentration | Low |
Major Players *Disclaimer: Major Players sorted in no particular order Image © Mordor Intelligence. Reuse requires attribution under CC BY 4.0. | |
Asia-Pacific 3D Construction Market Analysis by Mordor Intelligence
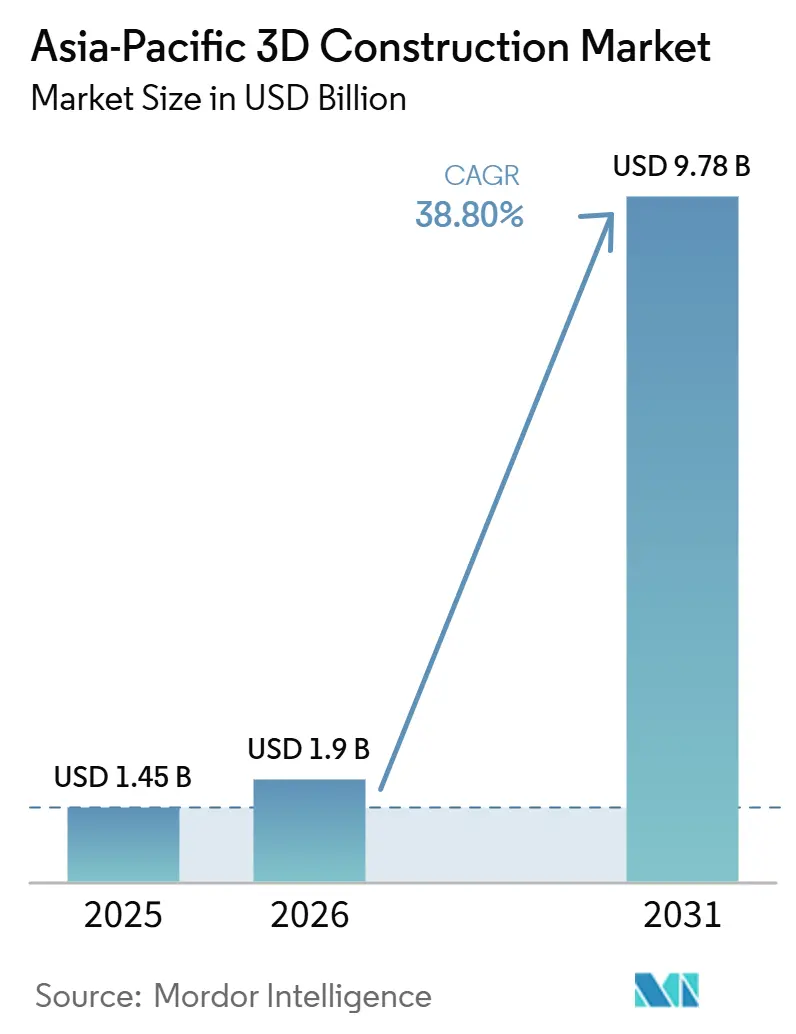
The Asia-Pacific 3D Construction Market size is projected to be USD 1.45 billion in 2025, USD 1.9 billion in 2026, and reach USD 9.78 billion by 2031, growing at a CAGR of 38.80% from 2026 to 2031. The 2026 step-up reflects faster commercial use of large-format concrete extrusion systems across China, India, and Southeast Asia, where housing gaps and smart-city programs are creating a more dependable project pipeline than simple pilot activity. The Asia-Pacific 3D construction market is also being shaped by public procurement rules that are tying additive construction to housing, transport, and civic infrastructure programs, which gives suppliers stronger visibility on demand and helps unlock investment in feedstock production, printer deployment, and technical support. This regional pattern is different from many other markets because adoption is moving through state-backed implementation routes rather than staying limited to showcase builds, and that lowers early commercial uncertainty for both local firms and outside partners. Competitive conditions remain fragmented, but material suppliers such as Holcim, Heidelberg Materials, and Sika hold an outsized position because structural approval depends heavily on mix design quality, consistency, and test documentation rather than printer hardware alone. The largest near-term constraint is still uneven regulation across Southeast Asia, because several countries have not yet put in place clear code pathways for printed concrete structures, which slows financing and project approval even when the underlying technology is already ready for use.
Key Report Takeaways
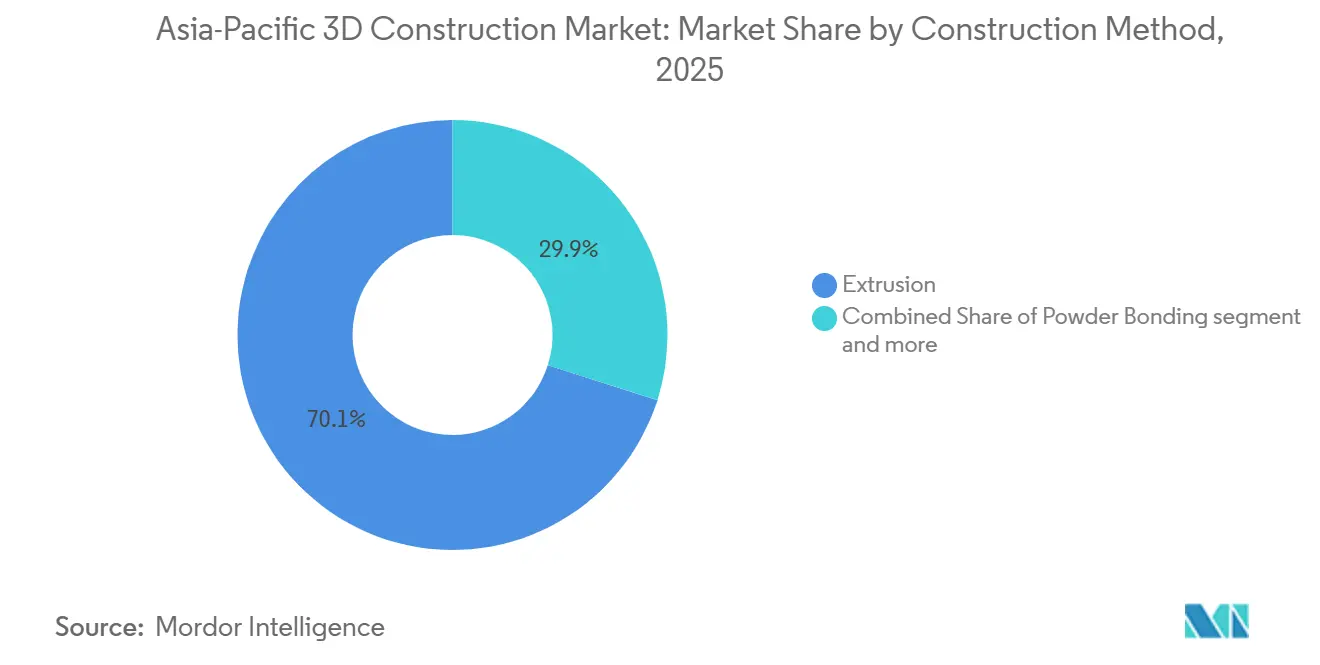
- By construction method, extrusion accounted for 70.1% of the Asia-Pacific 3D construction market size in 2025, while powder bonding is projected to expand at 45.8% CAGR through 2031.
- By material type, concrete held 56.9% of the Asia-Pacific 3D construction market size in 2025, while metal is forecast to grow at 57.4% CAGR through 2031.
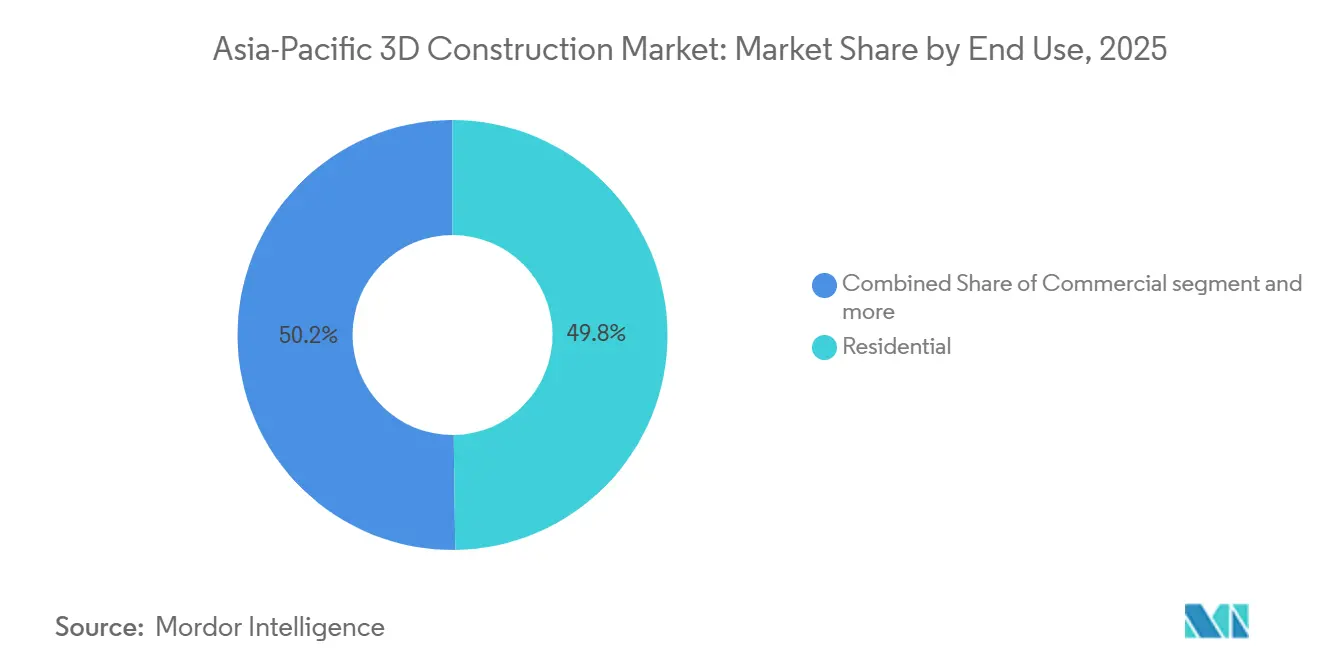
- By end use, residential captured 49.8% of the Asia-Pacific 3D construction market size in 2025, while infrastructure is projected to advance at 45.3% CAGR through 2031.
- By construction setting, on-site printing represented 69.4% of the Asia-Pacific 3D construction market size in 2025, while off-site printing is set to rise at 42.1% CAGR through 2031.
- By country, China held 38.6% of the Asia-Pacific 3D construction market share in 2025, while India is forecast to expand at 52.2% CAGR through 2031.
Note: Market size and forecast figures in this report are generated using Mordor Intelligence’s proprietary estimation framework, updated with the latest available data and insights as of January 2026.
Asia-Pacific 3D Construction Market Trends and Insights
Drivers Impact Analysis*
| Drivers | (~) % Impact on CAGR Forecast | Geographic Relevance |
|---|---|---|
| Government-Led Smart City and Housing Mandates | 7.50% | APAC-wide, with strongest concentration in China, India, Singapore, and South Korea |
| Rapid Urbanization and Rural Housing Deficit | 6.20% | South and Southeast Asia, especially India, Indonesia, the Philippines, and Vietnam |
| Shorter Build Cycles and Lower Labor Intensity | 5.80% | APAC-wide, with stronger pull in Japan and Australia |
| Mix Design Advances Improving Structural Reliability | 4.80% | China, Singapore, Japan, and South Korea |
| Disaster-Resilient Infrastructure Demand In Seismic and Flood Zones | 3.50% | Japan, Indonesia, coastal India, and the Philippines |
| Carbon-Lowering Binder Systems and Waste Reduction | 3.20% | APAC-wide, especially Australia, China, and Singapore |
| Source: Mordor Intelligence | ||
Government-Led Smart City and Prefabricated Housing Mandates
State purchasing has moved beyond isolated pilot grants and into formal program structures, which has reduced early commercial risk for the Asia-Pacific 3D construction market and made project demand more visible to suppliers and contractors. In China, the 14th Five-Year Plan supported the development of a structural performance-driven 3D printing program that led to the country’s first 3D printed tunnel lining project, and that project passed formal acceptance testing in April 2026 on the Guangzhou-Zhanjiang High-speed Railway cross-passage. That milestone matters because it shows that public backing is no longer confined to low-rise housing, and is extending into technically demanding underground transport applications where proof of reliability carries more weight than novelty. India is moving in a similar direction through national technology and housing efforts, and the policy setting described by NITI Aayog shows why faster-build systems are being considered for a much larger construction base than what is visible in pilot projects alone. Once public agencies create a steady minimum order flow, feedstock suppliers, printer operators, and project developers can justify permanent capacity instead of temporary deployment, which gives the Asia-Pacific 3D construction market a stronger commercial base than one-off demonstrations ever could.
Rapid Urbanization and Rural Housing Deficit Across Emerging APAC Economies
The demand pull behind the Asia-Pacific 3D construction market is tied closely to the pace of urban expansion and the size of unfinished housing needs across several large developing economies. NITI Aayog stated in 2025 that nearly 70% of the buildings India will need by 2030 are still to be built, underscoring the importance of construction methods that can compress schedules without relying heavily on large crews. The same source described the Kelvin 6K Pro as India’s first on-site 3D construction printer, using a fly ash-based geopolymer to deliver homes in under 30 days with 30% lower cost and 60% faster completion than standard methods. Indonesia shows a similar demand story, but a 2025 study by Inovasi found that the key bottlenecks are technology compatibility and contractor capability, rather than a lack of need, suggesting the adoption problem is more operational than structural. That distinction matters because supply-side gaps can be addressed through training, financing, and local integration work, which gives the Asia-Pacific 3D construction market a path to faster scale once project execution systems catch up with housing demand. The wider result is that urbanization is not only adding volume pressure, it is also favoring methods that can shorten delivery windows in cities where construction delays already carry a high public and political cost.
Shorter Build Cycles and Lower Labor Intensity
Time savings and lower crew needs are becoming direct commercial reasons for adoption in the Asia-Pacific 3D construction market, especially where labor supply is tight or aging. In Singapore, the National University of Singapore, working with Woh Hup and supported by BCA and NAMIC, completed the country’s first on-site 3D concrete printing of load-bearing structural elements in August 2025, cutting manhours by 50% and material use by 30% compared with conventional methods. A second on-site validation exercise began in January 2026, which matters because repeat work under operating conditions is more useful to contractors than a single successful test. Japan adds a labor-demographic angle, because Kizuki completed the country’s first government-approved two-story 3D-printed reinforced concrete house in November 2025 with a 4-person crew, showing how the method can reduce dependence on larger site teams. That smaller crew profile is important for island construction, remote sites, and disaster response work where labor access can be a harder limit than wage cost. Across the Asia-Pacific 3D construction market, the value case is now tied not just to printing speed, but to the ability to complete structurally credible work with fewer workers, less rehandling, and tighter site coordination.
Mix Design Advances Improving Structural Reliability
Material development is narrowing one of the longest-standing concerns in the Asia-Pacific 3D construction market, which is whether printed mixes can meet structural requirements consistently at scale. NUS researchers reported in January 2026 that a printable concrete mix using 60% recycled waste glass powder in place of ordinary Portland cement delivered compressive strength above 50MPa, while lowering embodied energy by 44% and carbon emissions by 52% against conventional printable concrete. Those results matter because the performance was strong enough to satisfy structural verification needs, and that gives project owners a clearer path from sustainability claims to actual code acceptance. Heidelberg Materials has also moved this issue forward through evoBuild, a 3D printing material with a carbon footprint more than 50% lower than conventional Portland cement, while still retaining recyclability in structural use. As green building systems become more relevant to public and institutional construction, suppliers that can pair low-carbon claims with documented performance are likely to gain an advantage that printer manufacturers cannot easily copy. The result is that the Asia-Pacific 3D construction market is being strengthened not only by better machines, but also by better materials that reduce uncertainty during certification, procurement, and long-term asset management.
Restraints Impact Analysis*
| Restraints | (~) % Impact on CAGR Forecast | Geographic Relevance | Impact Timeline |
|---|---|---|---|
| High Upfront Capex for Large-Format Printers | -5.5% | APAC-wide, most acute among small and mid-sized developers in South and Southeast Asia | Short term (≤ 2 years) |
| Fragmented Regulatory Environment and Inconsistent Approval Cycles | -4.8% | Southeast Asia and South Asia, especially Indonesia, the Philippines, and Vietnam | Medium term (2-4 years) |
| Insurance and Warranty Acceptance Gaps | -3.2% | APAC-wide, with particular relevance in Australia and India | Medium term (2-4 years) |
| Limited Local Printer OEM Ecosystem and Feedstock Constraints | -2.8% | Southeast Asia, South Asia, and Pacific island markets | Short term (≤ 2 years) |
| Source: Mordor Intelligence | |||
High Upfront Capex for Large-Format Printers
Printer cost is still one of the clearest obstacles in the Asia-Pacific 3D construction market, because commercial-scale systems can exceed USD 500,000 before installation, calibration, and material integration are added to the total. That spending profile does not align easily with the financial structure of the small and medium-sized contractors that carry out much of the region’s residential and mid-scale project work. The problem is made worse by the lack of active second-hand equipment markets, and by the limited spread of financing products designed specifically for additive construction assets. In many countries, that means a contractor must absorb the technology risk, the utilization risk, and the repayment burden at the same time, which slows purchase decisions even when client interest is present. Service-based deployment models and leasing structures can reduce part of that pressure, but they still need scale, local service depth, and reliable project flow before they become a mainstream answer. For the Asia-Pacific 3D construction market, capex is therefore shifting from a hard stop to a timing issue, but it remains a real constraint on the speed at which regional adoption can broaden beyond early movers and large public projects.
Fragmented Regulatory Environment and Inconsistent Approval Cycles Across APAC Nations
Regulation remains uneven across the Asia-Pacific 3D construction market, and that keeps project timelines less predictable than the technology itself. Singapore shows that a clearer outcome-based pathway can shorten approvals, but several other markets still require project-by-project interpretation because printed concrete does not yet sit cleanly inside recognized building code categories. This matters commercially because a mix design or printer setup that works in one country often needs fresh testing and documentation in the next, which prevents easy standardization for developers with regional plans. That repeated certification burden raises cost, delays procurement, and slows the learning curve that should otherwise come from reusing successful systems across multiple projects. It also divides the region into a smaller group of high-certainty corridors, such as China, Singapore, and Japan, and a much larger group of markets where adoption remains close to pilot stage. For the Asia-Pacific 3D construction market, that fragmentation does not block demand, but it does delay the point at which demand can convert into repeatable, financeable, and scalable project activity.
*Our forecasts treat driver/restraint impacts as directional, not additive. The impact forecasts reflect baseline growth, mix effects, and variable interactions.
Segment Analysis
By Construction Method: Extrusion Holds the Market, Powder Bonding Redefines Material Flexibility
Extrusion led this segment with a 70.1% revenue share in 2025, and that position reflects the fact that extrusion systems are the most commercially mature tools now operating across the Asia-Pacific 3D construction market. The installed base is strongest in China and India, where contractors, public agencies, and feedstock suppliers have already built a practical operating ecosystem around gantry systems, operator training, and material support. Extrusion also benefits from broad compatibility with both standard cement-based mixes and newer geopolymer blends, which lowers the switching burden for firms that want to adopt 3D printing without rebuilding their entire materials workflow. That depth of use creates its own reinforcement effect, because suppliers are more willing to open technical support hubs when they can serve a larger installed base with repeat material demand. Within the Asia-Pacific 3D construction industry, this makes extrusion not only the leading method by revenue, but also the most operationally familiar route for new users entering the field.
Powder bonding is smaller today, but its 45.8% forecast CAGR through 2031 shows that it is expanding from a lower base into applications where material flexibility matters more than installed hardware familiarity. The method stands out because it can work with industrial byproducts such as fly ash, slag, and ceramic powder, which helps lower exposure to Portland cement price swings and supports localized material strategies in cost-sensitive markets. A 2025 study in Progress in Additive Manufacturing supported this direction by showing that geopolymer binders made from low-grade metakaolin and bottom ash can achieve the printability and compressive strength needed for construction use[2] S. Banihashemi et al., “3D Printing in Construction: Sustainable Technology for Building,” Progress in Additive Manufacturing, link.springer.com. The “others” group, including shotcrete-based approaches, is also drawing more attention after China’s tunnel lining validation in 2026, which suggests that the Asia-Pacific 3D construction market will keep broadening beyond the standard above-ground wall printing model as underground and specialized use cases grow.



By Material Type: Concrete Anchors Revenue as Metal Opens New Structural Frontiers
Concrete accounted for 56.9% of segment revenue in 2025, and it remains the primary material base for the Asia-Pacific 3D construction market because it combines lower cost, familiar testing methods, and strong alignment with existing contractor practices. The category is no longer limited to ordinary Portland cement mixes because it now includes geopolymer systems, recycled glass powder blends, and lower-carbon commercial binders that widen the performance and sustainability range available to project teams. NUS showed in early 2026 that high replacement levels of waste glass powder can still deliver compressive strengths above 50 MPa, which helps explain why concrete remains the most adaptable route for both structural credibility and emissions reduction[1]NUS College of Design and Engineering, “CDE Advances Sustainable 3D Concrete Printing for the Construction Industry,” National University of Singapore, cde.nus.edu.sg. Heidelberg Materials has reinforced the same point by bringing evoBuild into serial residential use, with a carbon footprint more than 50% lower than conventional Portland cement, giving the segment stronger support as public and institutional buyers now screen for carbon performance. In the Asia-Pacific 3D construction industry, concrete therefore maintains its lead because it can meet both structural and environmental demands without forcing project owners to navigate unfamiliar approval routes.
Metal is forecast to grow at 57.4% CAGR through 2031, which makes it the fastest-rising material category even though it still starts from a much smaller installed base than concrete. The appeal comes from its potential use in structural steel components, bridges, utility frameworks, and modular industrial applications where printed metal parts can address geometry, weight, and fabrication complexity in ways standard casting or cutting cannot. The move also shows that the Asia-Pacific 3D construction market is widening beyond cementitious housing structures and into a broader built-environment toolset that includes hybrid structural systems. Composite and other materials remain niche today, but they are gaining attention in coastal and seismic settings where variable density or multi-material design may help distribute loads more effectively than a single homogeneous mix. That does not displace concrete in the near term, but it does expand the technical ceiling of what regional suppliers may eventually print for infrastructure and engineered public assets.
By End Use: Residential Leads Volume, Infrastructure Commands Growth Premium
Residential construction accounted for 49.8% of end-use revenue in 2025, and that lead came from the close fit between the region’s housing shortages and the core advantages of printed construction, which are speed, lower labor intensity, and design repeatability. The strongest demand base sits in China and India, where affordable housing, public housing, and social housing programs continue to create a practical route for scaling printed wall systems and low-rise structural forms. Residential demand is also supported by the fact that secondary cities often need faster delivery but do not always have access to large skilled workforces, which makes automated construction methods more attractive than they might be in fully saturated urban cores. In this part of the Asia-Pacific 3D construction market, the value case is less about architectural novelty and more about compressing construction cycles while controlling labor and material inputs. That is why residential remains the segment with the broadest current volume base, even though some of the region’s most visible technology milestones are appearing elsewhere.
Commercial construction holds a more moderate position and is still heavily shaped by demonstration projects, specialized design-led builds, and projects where customization delivers clear client value. Infrastructure is the fastest-growing end-use segment at 45.3% CAGR through 2031, because public agencies in countries such as China, Japan, Indonesia, and India are increasingly interested in methods that can perform in constrained sites, shorten repair schedules, and support resilience-oriented design. The tunnel lining milestone in China and the seismic certification work in Japan both point toward a wider role for printed construction in infrastructure settings where speed must sit alongside structural confidence. This growth premium also reflects the fact that infrastructure does not yet have a deeply entrenched printed-construction supply chain, so earlier entrants can still shape technical standards, delivery models, and procurement expectations more easily than in mature residential workflows.
By Construction Setting: On-site Scale Persists as Off-site Factories Build Competitive Logic
On-site printing accounted for 69.4% of segment revenue in 2025, indicating that on-site deployment remains the center of current activity in the Asia-Pacific 3D construction market. The model remains attractive for large-footprint structures, public housing layouts, and projects where transport of oversized printed elements would be inefficient or difficult. It is also the format that has seen the most visible regional proof points, including Singapore’s on-site printing of structural elements and childcare center components, where the exterior work was completed in 2 days with a 170-man-hour process. On-site printing suits markets where authorities permit equipment presence across the build cycle and where contractors want to avoid the added logistics of factory dispatch, storage, and final positioning. That helps explain why it continues to dominate current revenue, even as the operational constraints of weather, humidity, and on-site coordination remain evident.
Off-site printing is forecast to grow at a 42.1% CAGR through 2031, and its appeal lies in tighter production control rather than scale alone. Factory settings reduce exposure to temperature and humidity swings, which is especially relevant in tropical parts of the region where interlayer bonding reliability can weaken under open-air conditions. The off-site route also supports a different labor model, because printed panels or modules can arrive substantially finished and turn the site into an assembly-focused operation rather than a full manufacturing environment. This matters in the Asia-Pacific 3D construction market because many contractors want productivity gains without having to place large specialized equipment on every project site for the full duration of the job. As digital design records, traceability requirements, and BIM-linked procurement practices spread through public construction, factory-based printing is likely to gain ground wherever quality control and document consistency matter as much as raw build speed.
Geography Analysis
China represented 38.6% of the Asia-Pacific 3D construction market share in 2025, and that lead came from a policy framework that links additive construction to state-backed project delivery, research funding, and a large installed base of concrete extrusion systems. The country’s first 3D printed tunnel lining, verified in April 2026 on the Guangzhou-Zhanjiang High-speed Railway cross-passage, showed that Chinese deployment has moved well past basic housing demonstrations and into underground transport applications with stricter operating demands. That shift matters because heavy infrastructure expands the addressable opportunity for printers, materials, and technical services much more than stand-alone showcase buildings do. India follows with the strongest growth trajectory, posting a 52.2% CAGR through 2031, and its position is tied directly to a large urban housing shortfall and a policy environment that now treats additive manufacturing as a practical construction enabler rather than a niche experiment. NITI Aayog’s 2025 note that 70% of India’s required 2030 buildings are yet to be constructed helps explain why faster-build systems are gaining policy attention in the first place[3]NITI Aayog Frontier Technology, “Robots That Build: 3D Printing Homes at Record Speed,” Frontier Tech, frontiertech.niti.gov.in.
Japan held an important mid-tier position in 2025, and its importance rests on compliance strength rather than absolute volume. The November 2025 completion of Japan’s first government-approved, seismically certified two-story printed reinforced concrete house created a practical benchmark for other earthquake-prone markets across Asia. Australia remains part of the regional growth set through its domestic technology activity and broader interest in digitally managed construction, while South Korea continues to matter through its code framework and manufacturing presence that supports the wider region. These countries do not yet set the pace of overall volume, but they add important engineering depth and future deployment breadth to the Asia-Pacific 3D construction market.
Indonesia and the rest of the region form the widest option pool for future expansion, because demand conditions are present even where deployment capability is still early. A 2025 study in Inovasi found that Indonesia’s main barriers are contractor behavior and hardware-software integration rather than weak demand, which suggests that adoption can move faster once local execution capacity improves. Thailand also showed that application scope is widening when SCG 3D Printing deployed printed concrete reef structures for marine ecosystem restoration in July 2026, extending the use case beyond buildings into environmental infrastructure. This broader application mix matters because it shows the Asia-Pacific 3D construction market is not growing through housing alone, but also through resilience, restoration, and public works use cases that can support demand in countries still building their first formal code pathways.
Competitive Landscape
The Asia-Pacific 3D construction market remains moderately fragmented, and competition is spread across three broad groups, domestic printer makers and local construction specialists, global platform suppliers that provide hardware and training, and multinational material companies whose mix designs often shape structural approval outcomes. No single company has enough regional reach to control pricing, material terms, or project standards across the full market, which keeps the field open to local partnerships and country-specific execution models. Material suppliers have a stronger role than many early observers expected, because structural certification depends as much on documented mix consistency and performance testing as it does on printer accuracy or print speed. Competition is sharpest in China and India, where public contracts bring in both local specialists and global participants, and where volume is large enough to justify dedicated support and supply infrastructure. This means the Asia-Pacific 3D construction market is being contested not only through machine capability, but also through materials validation, government relationships, and the ability to move from pilot work to repeat contracts.
A clear strategic move came from Heidelberg Materials, which embedded 3D printing materials into its Strategy 2030 roadmap and also began serial supply of evoBuild for a residential 3D printing project, signaling long-term commitment rather than a temporary trial. Another came from Kizuki, ONOCOM, and COBOD, whose government-approved two-story printed house in Japan turned a technology milestone into a compliance benchmark that can influence procurement and design confidence across the region. SCG 3D Printing added a different example in 2026 by using printed concrete reef structures for marine restoration, which broadened the visible application base and showed that competitive positioning can also come from public sustainability projects rather than buildings alone. WinSun also signaled outward ambition through its 2024 partnership to expand into Canada, showing how APAC-developed construction printing platforms are already being positioned for overseas licensing and commercial use.
A meaningful gap still exists in off-site prefabrication with multi-country structural acceptance, because no single regional player has yet built a widely recognized printed panel operation that is certified across several APAC jurisdictions. That gap favors companies that can combine material science, code engagement, and local project delivery rather than relying on equipment sales alone. Regulatory fragmentation also raises execution risk, because firms cannot easily reuse one certified mix or machine setup across multiple countries without new testing, and that slows regional scaling. For the Asia-Pacific 3D construction market, the competitive edge will likely belong to participants that can convert technical capability into country-specific approval pathways and then back that up with local material support, contractor training, and reliable delivery records.
Asia-Pacific 3D Construction Industry Leaders
Yingchuang Building Technique (Shanghai) Co., Ltd. (WinSun)
COBOD International A/S
ICON Technology, Inc.
Apis Cor Inc.
CyBe Construction B.V.
- *Disclaimer: Major Players sorted in no particular order

Recent Industry Developments
- April 2026: China's first 3D printed tunnel integrated lining demonstration project on the Guangzhou-Zhanjiang High-speed Railway passed formal site verification, executed under the 14th Five-Year Plan National Key R&D Program with China Railway Seventh Group and China Railway Engineering Equipment Group as primary implementers. The system used intelligent spraying equipment to print sprayed high-strength fiber concrete, overcoming design, material, equipment, and installation challenges for underground additive construction, a technology milestone with direct applicability to APAC's expanding metro and high-speed rail infrastructure programs.
- January 2026: NUS College of Design and Engineering and Woh Hup began a second on-site 3D concrete printing exercise in Singapore, validated by the Building and Construction Authority, following the success of Singapore's first on-site 3DCP structural element verification in August 2025 that achieved a 50% manhour reduction and 30% lower material consumption.
- November 2025: Kizuki Co., Ltd., in collaboration with ONOCOM and using a COBOD BOD2 printer, completed Japan's first government-approved 2-story 3D printed reinforced concrete house with full national building standard seismic certification. The project, a 50m² cave-inspired structure with 3D-printed arches, floor slabs, and roof elements, was operated by a 4-person crew, establishing a minimum labor profile directly applicable to Japan's aging construction workforce.


Asia-Pacific 3D Construction Market Report Scope
| Extrusion |
| Powder Bonding |
| Others |
| Concrete |
| Metal |
| Composite |
| Other Material Types |
| Residential |
| Commercial |
| Infrastructure |
| On-site (In-situ) Printing |
| Off-site (Factory / Precast) Printing |
| China |
| India |
| Japan |
| South Korea |
| Australia |
| Indonesia |
| Rest of Asia-Pacific |
| By Construction Method | Extrusion |
| Powder Bonding | |
| Others | |
| By Material Type | Concrete |
| Metal | |
| Composite | |
| Other Material Types | |
| By End Use | Residential |
| Commercial | |
| Infrastructure | |
| By Construction Setting | On-site (In-situ) Printing |
| Off-site (Factory / Precast) Printing | |
| By Country | China |
| India | |
| Japan | |
| South Korea | |
| Australia | |
| Indonesia | |
| Rest of Asia-Pacific |


Key Questions Answered in the Report
What is the forecast growth rate for 3D construction in Asia-Pacific?
The Asia-Pacific 3D construction market is forecast to grow at 38.8% CAGR from 2026 to 2031, rising from USD 1.90 billion in 2026 to USD 9.78 billion by 2031.
Which country leads regional revenue today?
China led regional revenue in 2025 with a 38.6% share, supported by state-backed deployment, research funding, and a deeper installed base of construction printing systems.
Which country is expanding the fastest through 2031?
India is the fastest-growing country segment, with a projected 52.2% CAGR through 2031, backed by a large housing shortage and a supportive additive manufacturing policy setting.
Which construction method is most widely used right now?
Extrusion is the dominant method, holding 70.1% share in 2025 because it is the most mature approach and fits well with concrete and geopolymer workflows already used in the region.
Which end-use area offers the strongest growth opportunity?
Infrastructure is the fastest-growing end-use at 45.3% CAGR through 2031, helped by interest in tunnels, resilient public works, and projects in difficult site conditions.
Page last updated on:





