Tamaño y Participación del Mercado de Aeronaves con Motor de Pistón
Visión General del Mercado
| Período de Estudio | 2019 - 2031 |
|---|---|
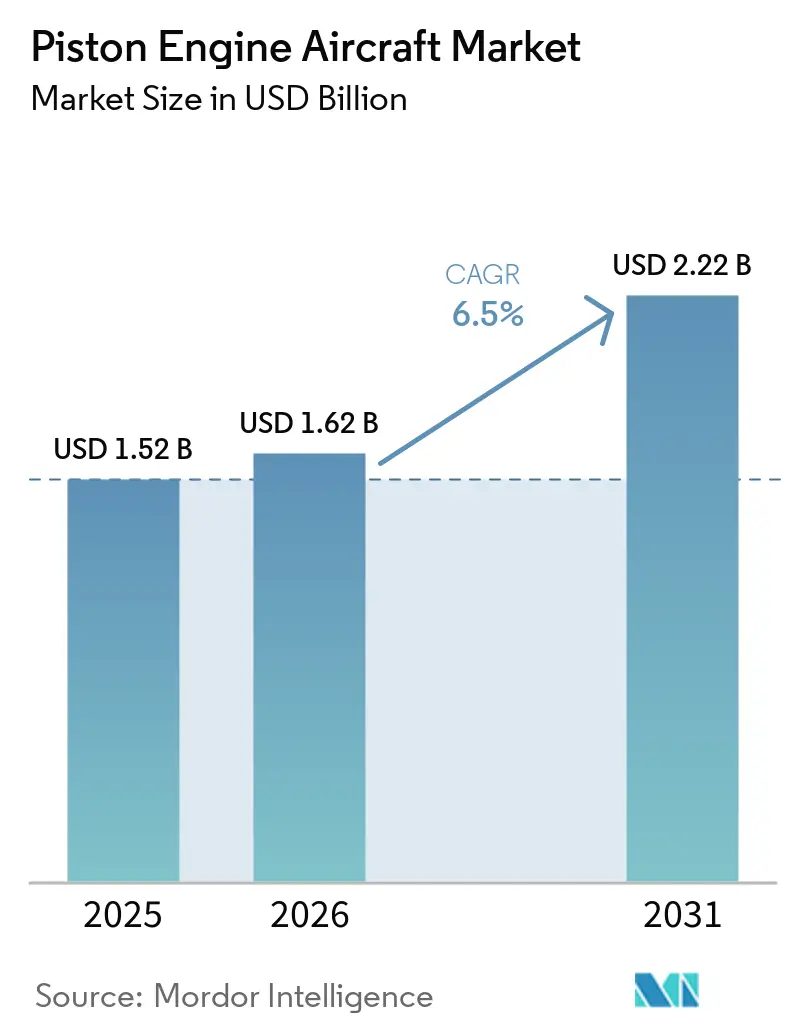
| Tamaño del Mercado (2026) | 1.62 Mil millones de dólares |
| Tamaño del Mercado (2031) | 2.22 Mil millones de dólares |
| Tasa de crecimiento (2026 - 2031) | 6.50% CAGR |
| Mercado de Crecimiento Más Rápido | Asia Pacífico |
| Mercado Más Grande | América del Norte |
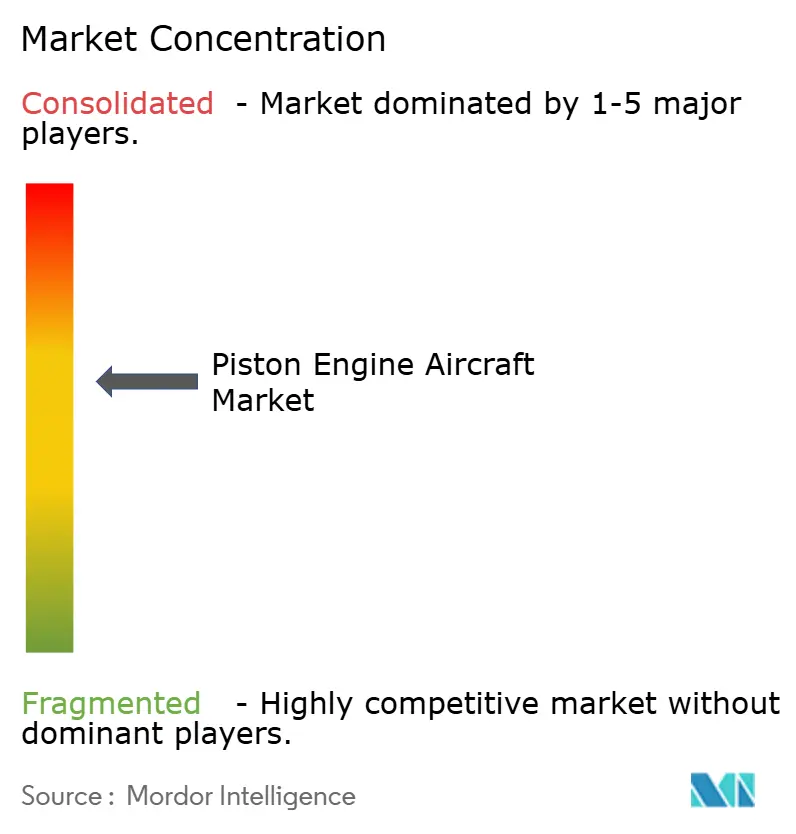
| Concentración del Mercado | Medio |
Jugadores principales *Nota aclaratoria: los principales jugadores no se ordenaron de un modo en especial Imagen © Mordor Intelligence. El uso requiere atribución según CC BY 4.0. | |
Análisis del Mercado de Aeronaves con Motor de Pistón por Mordor Intelligence
Se espera que el tamaño del mercado de aeronaves con motor de pistón crezca de USD 1,52 mil millones en 2025 a USD 1,62 mil millones en 2026, y se prevé que alcance USD 2,22 mil millones en 2031 a una CAGR del 6,50% durante 2026-2031. Las perspectivas a corto plazo están respaldadas por las jubilaciones de pilotos que reducen la capacidad de formación, los avances constantes derivados de la adopción del pistón diésel que reducen el consumo de combustible, y la aceleración de China en la aprobación de aeropuertos de aviación general que amplía la demanda potencial de plataformas de formación y utilitarias. El rendimiento de la formación aumenta a medida que las principales aerolíneas estadounidenses mantienen sus canales de contratación, lo que mantiene ocupadas las flotas de entrenadores primarios y multimotores en escuelas de vuelo universitarias e independientes. Los modelos propulsados por diésel, como el Seminole DX de Piper, señalan un giro hacia la compatibilidad con Jet A y menores costos por hora para las escuelas que operan en regiones donde el avgas es costoso o inconsistente. La autorización de China en 2024 de nuevos aeropuertos de aviación general multiplica las adiciones de flota a largo plazo en Asia-Pacífico y crea una demanda duradera de flotas de pistón multimisión. América del Norte sigue siendo el ancla para las entregas y la utilización de la flota, respaldada por la infraestructura de aviación general más densa y una alta participación en los envíos globales de pistón.
Conclusiones Clave del Informe
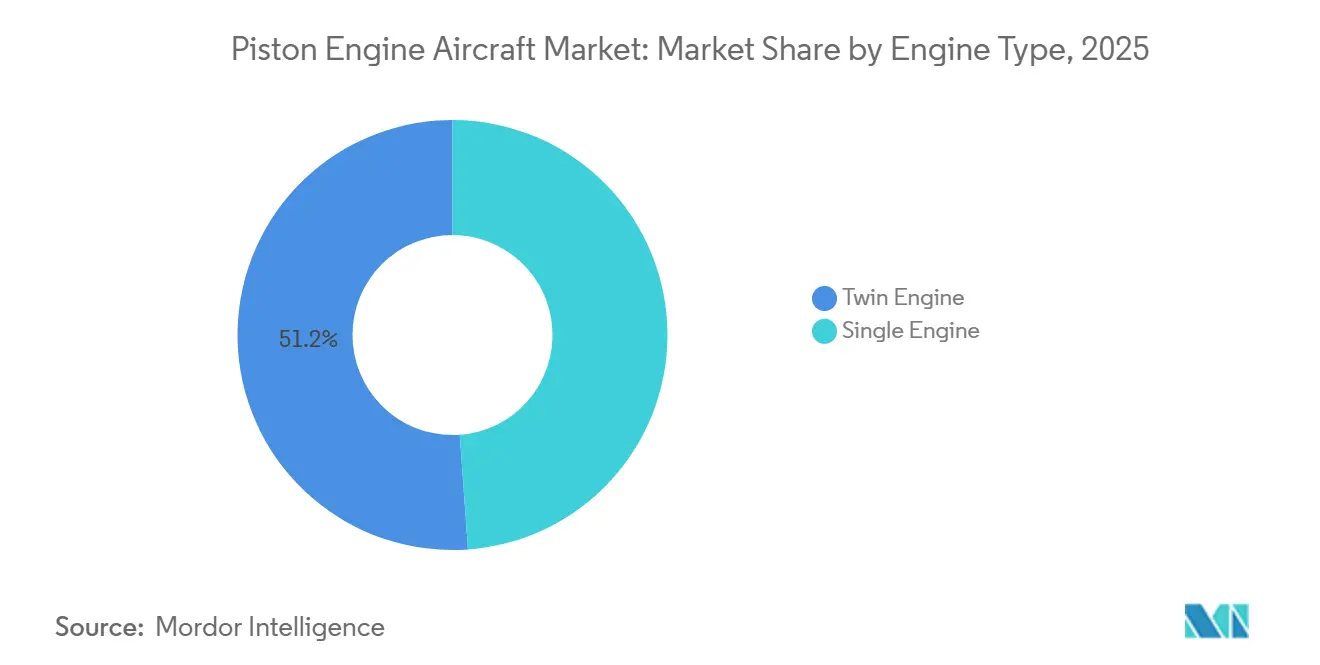
- Por tipo de motor, las variantes de doble motor lideraron con una participación en los ingresos del 51,15% en 2025; se prevé que las plataformas de motor único se expandan a una CAGR del 6,83% hasta 2031.
- Por usuario final, el gobierno y los militares representaron el 74,55% del consumo de 2025; se proyecta que los operadores civiles y comerciales crezcan a una CAGR del 6,74% hasta 2031.
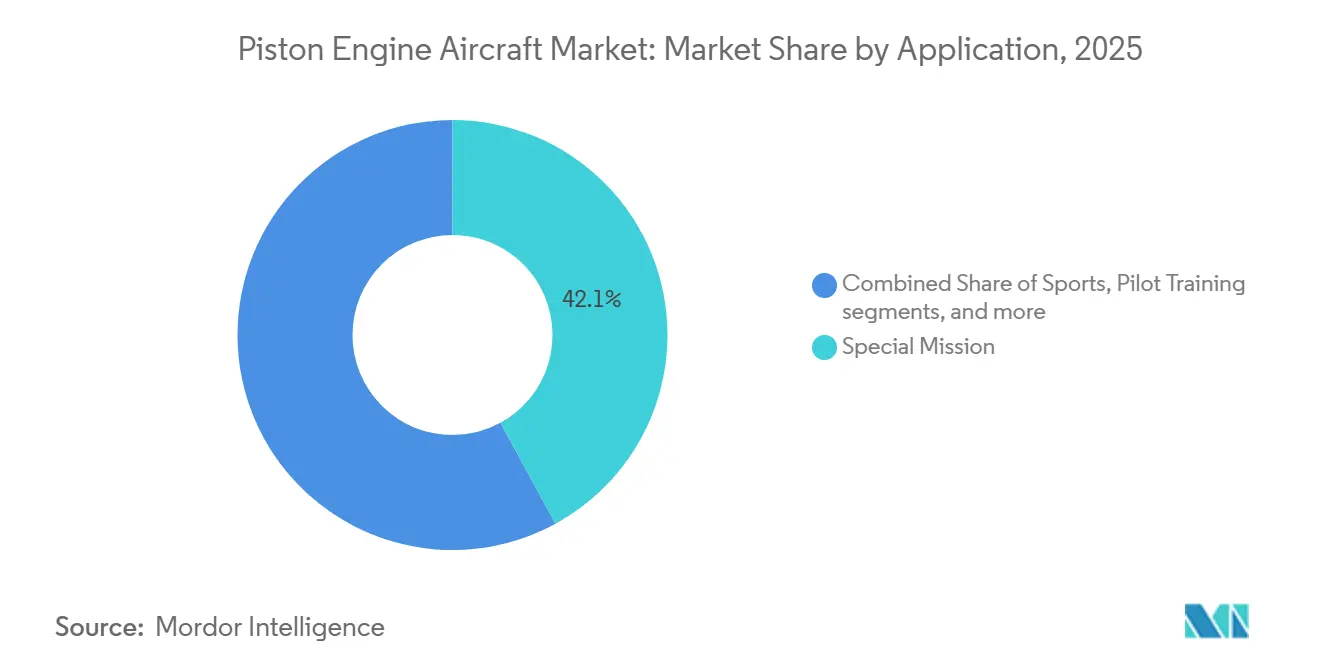
- Por aplicación, las plataformas de misión especial capturaron una participación del 42,05% del mercado de aeronaves con motor de pistón en 2025; se proyecta que los servicios de taxi aéreo y chárter crezcan a una CAGR del 8,88% hasta 2031.
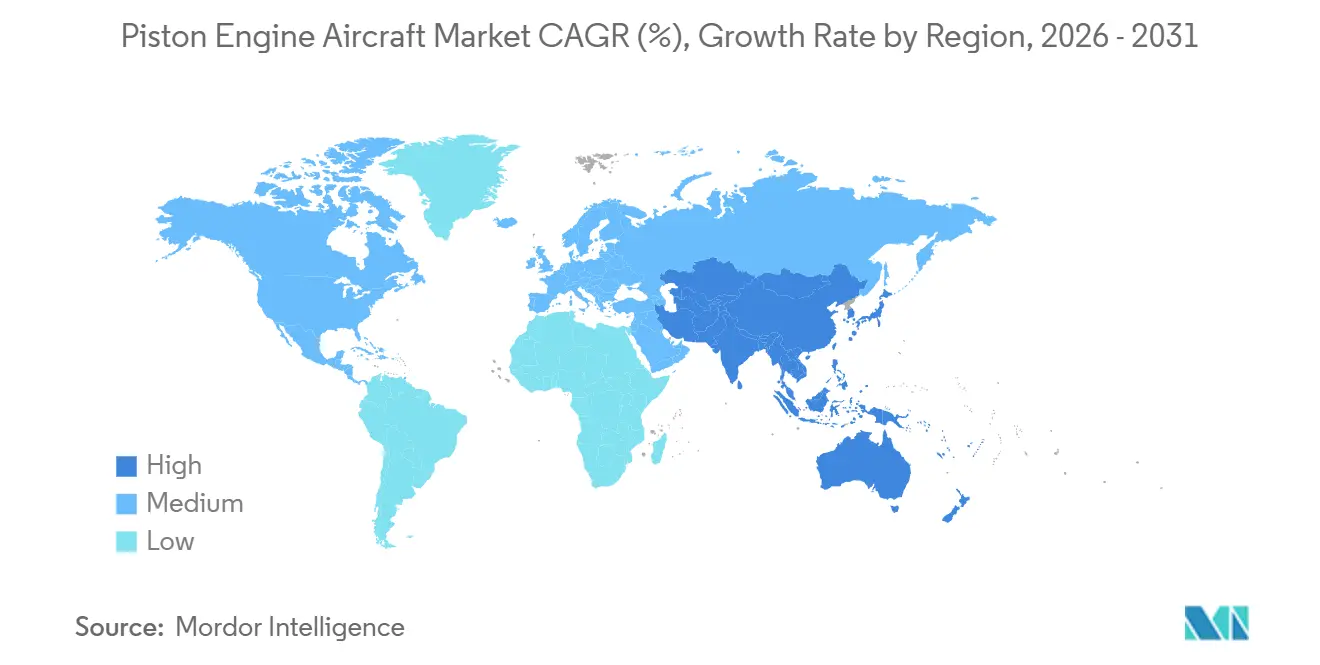
- Por geografía, América del Norte tuvo una participación del 39,1% en 2025, mientras que se proyecta que Asia-Pacífico registre una CAGR del 6,98% hasta 2031.
Nota: Las cifras de tamaño del mercado y previsión de este informe se generan utilizando el marco de estimación propietario de Mordor Intelligence, actualizado con los últimos datos e información disponibles a partir de 2026.
Tendencias e Información del Mercado Global de Aeronaves con Motor de Pistón
Análisis del Impacto de los Impulsores*
| Impulsor | (~) % de Impacto en el Pronóstico de CAGR | Relevancia Geográfica | Horizonte Temporal del Impacto |
|---|---|---|---|
| Creciente demanda de aeronaves de entrenamiento debido a la escasez de pilotos | +1.8% | Global, con ganancias tempranas en América del Norte y Asia-Pacífico | Mediano plazo (2-4 años) |
| Adopción creciente de motores de pistón diésel para mayor eficiencia de combustible | +1.2% | Europa y América del Norte como núcleo, con expansión hacia Asia-Pacífico | Largo plazo (≥ 4 años) |
| Expansión de la infraestructura de aviación general en mercados emergentes | +1.4% | Asia-Pacífico como núcleo, Oriente Medio, América Latina | Largo plazo (≥ 4 años) |
| Auge del vuelo recreativo entre individuos de alto patrimonio neto | +0.9% | América del Norte, Europa, Oriente Medio | Corto plazo (≤ 2 años) |
| Flexibilización regulatoria de aeronaves deportivas ligeras | +1.0% | Nacional en EE. UU., con ganancias tempranas en Europa | Mediano plazo (2-4 años) |
| Innovaciones en encendido electrónico y FADEC que reducen los costos de mantenimiento | +0.7% | Global | Mediano plazo (2-4 años) |
| Fuente: Mordor Intelligence | |||
Creciente Demanda de Aeronaves de Entrenamiento Debido a la Escasez de Pilotos
La demanda de aeronaves de entrenamiento sigue siendo sólida, ya que la demanda global de pilotos se mantiene elevada y las grandes aerolíneas estadounidenses continúan contratando a un ritmo sostenido en 2026. United Airlines tiene como objetivo contratar 2.500 pilotos en 2026, con American cerca de 1.500 y Delta cerca de 600 solo en el primer trimestre, lo que mantiene el flujo de estudiantes hacia los programas de formación primaria y multimotor que dependen de las flotas de pistón. Las escuelas de vuelo están ampliando su capacidad con pedidos de flota, incluida la adición de 50 unidades Archer TX de Embry-Riddle en 2024 y el acuerdo de la Universidad de Dakota del Norte para hasta 188 aeronaves Piper durante ocho años a partir de 2027, valorado en USD 155 millones. CAE proyecta una demanda de 300.000 nuevos pilotos durante 2025-2034, incluidos 101.000 en Asia-Pacífico y 79.000 en América del Norte, lo que ancla los planes de adquisición de entrenadores a varios años.[1]CAE, "Pronóstico de Talento en Aviación 2025–2034," CAE, cae.com En China, la Universidad de Vuelo de Aviación Civil opera una flota de entrenamiento de 400 aeronaves que registra 500.000 horas de vuelo anuales, y el plan del país contempla más licencias privadas y deportivas respaldadas por una base en expansión de escuelas certificadas. Estas dinámicas fortalecen el mercado de aeronaves con motor de pistón, ya que los entrenadores son las aeronaves fundamentales para los programas de habilitación ab initio y de competencia instrumental.
Adopción Creciente de Motores de Pistón Diésel para Mayor Eficiencia de Combustible
Los operadores están adoptando plataformas de pistón diésel que funcionan con Jet A, ampliamente disponible, lo que reduce los costos operativos y amplía el alcance para roles de formación y utilitarios. El Seminole DX de Piper con motor diésel y el motor DHK4A180 apunta a un 35% menos de consumo de combustible, una subida más rápida con un solo motor y un techo de un solo motor significativamente más alto, con la aprobación de la FAA prevista para el tercer trimestre de 2026 y las entregas comenzando en 2027. Los grupos motopropulsores diésel pueden reducir el consumo de combustible hasta en un 40% en comparación con los equivalentes de avgas, lo que ayuda a las escuelas y operadores de chárter a gestionar la volatilidad en la disponibilidad y el precio del avgas. El DA40 NG y el DA42 NG de Diamond, propulsados por motores de pistón de combustible de reacción Austro AE300 o AE330, superaron los 5 millones de horas de vuelo en 5.500 motores en 82 países en diciembre de 2025, un hito de escala que valida la fiabilidad de la flota y el soporte de servicio.[2]Diamond Aircraft Industries, "Austro Engine Supera los 5 Millones de Horas de Vuelo en la Flota Global de Diamond Aircraft," Diamond Aircraft Industries, diamonaircraft.com El marco medioambiental de la EASA refuerza el movimiento hacia soluciones de menores emisiones. Al mismo tiempo, la firma acústica de la propulsión eléctrica apunta hacia operaciones más silenciosas, posicionando los pistones diésel como un puente pragmático hacia futuros conceptos híbridos y eléctricos. A medida que las escuelas estandarizan en plataformas Jet A y controles habilitados por FADEC, las organizaciones de formación obtienen fiabilidad de despacho y gestión simplificada del motor en comparación con las arquitecturas de avgas heredadas.
Expansión de la Infraestructura de Aviación General en Mercados Emergentes
La inversión en infraestructura crea las condiciones para nuevas operaciones de formación y multimisión, especialmente en Asia-Pacífico y Oriente Medio. China autorizó 239 nuevos aeropuertos de aviación general en 2024 y planea ampliar la base de aeronaves de aviación general registradas y las capacidades de rescate de emergencia en más provincias para 2025, desbloqueando la demanda de entrenadores y pistones utilitarios para trabajo aéreo. Las perspectivas de flota a largo plazo del país hasta 2040 anticipan una gran flota de aviación general, con una alta proporción dedicada a la formación, lo que sostendrá un ciclo de adquisición para los modelos de pistón más populares de los fabricantes de equipos originales globales y locales. El pedido de finales de 2025 de Intercontinental Aviation Enterprise de 10 aeronaves Diamond en variantes DA40 NG y DA42-VI para formación en múltiples países demuestra aún más la colocación de flotas transfronterizas alineada con cohortes de estudiantes en crecimiento. El plan de inversión de Arabia Saudita para nuevos campos de aviación general apunta a una mayor actividad de chárter y formación. Al mismo tiempo, los esfuerzos de India para agilizar las licencias para operadores no regulares facilitan la expansión de las escuelas de vuelo y los proveedores de servicios. Estos movimientos amplían la huella geográfica de la demanda, apoyando una base instalada más amplia en el mercado de aeronaves con motor de pistón.
Flexibilización Regulatoria de Aeronaves Deportivas Ligeras
La norma MOSAIC de la FAA, vigente desde el 22 de octubre de 2025, amplía los parámetros de las aeronaves deportivas ligeras con velocidades de pérdida más altas, tren de aterrizaje retráctil, hélices de paso variable y hasta cuatro asientos para aviones, lo que amplía la flota que puede pilotarse bajo los privilegios de piloto deportivo. La norma permite a los pilotos operar entrenadores populares de cuatro asientos con un solo pasajero bajo los privilegios de piloto deportivo en determinadas condiciones, reduciendo las barreras de entrada y ayudando a las escuelas de vuelo a ampliar los canales para los futuros estudiantes.[3]Asociación de Propietarios y Pilotos de Aeronaves, "Las normas de aeronaves deportivas se amplían drásticamente," AOPA, aopa.org La AOPA señala que había 7.309 titulares de certificados de piloto deportivo a finales de 2024, lo que deja un margen significativo para el crecimiento bajo el entorno ampliado. La norma acredita el tiempo limitado en simulador y permite operaciones nocturnas con las habilitaciones y reconocimientos médicos adecuados, lo que mejora la flexibilidad de la formación y la utilización para las escuelas. El análisis de DLA Piper destaca que el proceso de Declaración de Conformidad de MOSAIC puede reducir las cargas de certificación para los modelos elegibles, atrayendo nuevo capital y participantes no tradicionales a la categoría. En conjunto, estos cambios aumentan la flota disponible y mejoran el canal de nuevos pilotos, beneficiando al mercado de aeronaves con motor de pistón a medida que se expande la formación.
Análisis del Impacto de las Restricciones*
| Restricción | (~) % de Impacto en el Pronóstico de CAGR | Relevancia Geográfica | Horizonte Temporal del Impacto |
|---|---|---|---|
| Estrictas regulaciones de emisiones sobre el avgas con plomo | -1.1% | Global, con picos tempranos en la UE y la costa este de EE. UU. | Mediano plazo (2-4 años) |
| Interrupciones en la cadena de suministro de componentes críticos del motor | -0.8% | Global, con efectos concentrados en América del Norte y Europa | Corto plazo (≤ 2 años) |
| Altas primas de seguro para operadores de aviación general | -0.6% | América del Norte como núcleo, con expansión hacia Europa | Corto plazo (≤ 2 años) |
| Competencia de opciones avanzadas de eVTOL y turbohélice | -0.4% | Global | Largo plazo (≥ 4 años) |
| Fuente: Mordor Intelligence | |||
Estrictas Regulaciones de Emisiones sobre el Avgas con Plomo
El impulso regulatorio contra las emisiones de plomo en la aviación está reformando la planificación de combustible y las rutas de actualización para la flota de pistón en servicio. La determinación de peligro de la EPA sienta las bases para nuevas normas de emisiones, que en última instancia requerirán que la FAA actúe para habilitar sustitutos sin plomo del 100LL y gestionar las vías de certificación para los motores y células afectados. Los registros del Registro Federal describen la escala de las emisiones de plomo de las operaciones de pistón y sus implicaciones para la salud pública, lo que impulsa acciones estatales, incluida la ley de Nueva York que restringe la venta de avgas con plomo después de enero de 2031, con exenciones limitadas. La iniciativa EAGLE de la FAA coordina el cambio de la industria con combustibles candidatos sin plomo de múltiples proveedores, equilibrando la seguridad, la durabilidad del motor y las consideraciones de distribución a medida que se acerca el horizonte de 2030.[4]Asociación Nacional de Transporte Aéreo, "Actualización EAGLE de julio de 2025," NATA, nata.aero A partir de abril de 2025, ninguna fórmula sin plomo contaba con autorización universal de la FAA para casi todos los motores afectados, lo que significa que los propietarios y los centros de mantenimiento, reparación y revisión deben planificar la compatibilidad, los márgenes de detonación y las posibles modificaciones a medida que avanzan las soluciones. Los modelos de pistón diésel que utilizan Jet A pueden evitar las restricciones de plomo, pero la mayor parte de la flota actual sigue dependiendo del avgas y enfrenta incertidumbre en la transición, lo que pesa sobre las decisiones de inversión a corto plazo en el mercado de aeronaves con motor de pistón.
Altas Primas de Seguro para Operadores de Aviación General
Los costos de seguro aumentaron como consecuencia de una mayor gravedad de los siniestros y de mayores riesgos generales, lo que reduce los márgenes de los proveedores de formación y los operadores de chárter. Los operadores también enfrentan mayores costos de reparación vinculados a materiales avanzados y la escasez de mecánicos calificados, lo que prolonga los tiempos de inactividad y eleva el costo de los incidentes menores. La orientación de la AOPA indica que los pilotos con una sólida vigencia, formación recurrente y aviónica moderna aún pueden obtener mejores condiciones, aunque las primas base siguen siendo elevadas para muchos operadores de pistón. En el mercado de aeronaves con motor de pistón, estas condiciones pueden frenar la expansión de la flota entre los propietarios privados y algunas escuelas, especialmente donde los márgenes de formación son reducidos y la financiación es sensible a los costos totales de propiedad. Con el tiempo, la adopción más amplia de tecnologías de seguridad como el aterrizaje automático y los diagnósticos conectados puede mejorar los perfiles de riesgo y reducir las primas. Sin embargo, los beneficios se irán incorporando a medida que entren en servicio nuevas flotas.
*Nuestras previsiones consideran los impactos de impulsores y restricciones como direccionales, no aditivos. Las previsiones de impacto reflejan el crecimiento base, los efectos de mezcla y las interacciones entre variables.
Análisis de Segmentos
Por Tipo de Motor: Las Plataformas de Motor Único Impulsan la Expansión de la Formación
Las variantes de doble motor capturaron el 51,15% de la participación del mercado de aeronaves con motor de pistón en 2025, mientras que se proyecta que las plataformas de motor único registren una CAGR del 6,83% hasta 2031, ya que las escuelas y los propietarios privados priorizan los costos de adquisición y la simplicidad operativa. El mercado de aeronaves con motor de pistón sigue anclado por los entrenadores de motor único que sirven como punto de entrada para las habilitaciones ab initio, instrumental y comercial bajo normas en evolución. Cirrus ha mantenido el liderazgo entre los monomotores de alto rendimiento al mejorar las características de seguridad, incluidos los sistemas de aterrizaje automático de emergencia para reducir la carga de trabajo del piloto. Textron ha mejorado el Cessna 172 Skyhawk introduciendo encendido electrónico dual, reduciendo las piezas móviles y habilitando intervalos de mantenimiento extendidos. Los bimotores y monomotores diésel están ganando terreno en regiones donde el Jet A es más económico que el avgas y donde las transiciones a combustible sin plomo están avanzando.
Los modelos de motor único continúan dominando el mercado a medida que MOSAIC amplía los privilegios de piloto deportivo y las escuelas adoptan aeronaves técnicamente avanzadas para las habilitaciones comerciales. Los monomotores modernos, equipados con cabinas de cristal y monitoreo digital del motor, emulan los flujos de trabajo al estilo de las aerolíneas, mejorando la seguridad y acortando las curvas de aprendizaje. Los monomotores diésel, como el DA40 NG, ofrecen mayor alcance y menores costos de combustible en Europa y partes de Asia. En contraste, los monomotores de gasolina siguen siendo populares en América del Norte debido a la disponibilidad del avgas. En el lado de los bimotores, modelos como el Seminole DX proporcionan ahorros significativos de combustible y métricas de rendimiento mejoradas, apoyando el crecimiento en ambas categorías de motor único y doble a medida que las escuelas hacen avanzar a los estudiantes por las distintas fases de formación.


Por Servicio al Usuario Final: Los Operadores Civiles/Comerciales Compiten por Contratos de Formación Financiados con Fondos Públicos
Los usuarios finales del gobierno y militares representaron el 74,55% de la participación del mercado de aeronaves con motor de pistón en 2025, respaldados por contratos de formación pública, misiones de búsqueda y rescate, y misiones de vigilancia. La financiación pública sustenta flotas de alta utilización como la Patrulla Aérea Civil de EE. UU., que ordenó 15 nuevas aeronaves de pistón Cessna en diciembre de 2025 para apoyar misiones que dependen de la economía del pistón y las capacidades de reconocimiento visual. La Universidad de Vuelo de Aviación Civil de China continúa operando una de las flotas de entrenamiento más grandes del mundo, lo que ayuda a sostener los volúmenes de los entrenadores de pistón más populares utilizados en las fases primaria, instrumental y multimotor. Los pedidos institucionales a gran escala, como el acuerdo plurianual de la Universidad de Dakota del Norte con Piper, mejoran la visibilidad de producción de los fabricantes de equipos originales al tiempo que agilizan la progresión de los estudiantes a través de flotas estandarizadas. Las configuraciones propulsadas por diésel ofrecen ventajas de alcance y costo de combustible para las academias públicas en mercados donde las cadenas de suministro de Jet A son más maduras que las redes de avgas.
Se proyecta que los operadores civiles y comerciales, incluidas las organizaciones de formación de vuelo, las empresas de taxi aéreo y las compañías de trabajo aéreo, crezcan a una CAGR del 6,74% hasta 2031, con MOSAIC reduciendo las barreras de entrada para los pilotos y habilitando operaciones de formación y trabajo aéreo más flexibles. Las estrategias de flota enfatizan la estandarización en un pequeño conjunto de modelos de motor único y doble para simplificar el mantenimiento y la formación, manteniendo al mismo tiempo altas tasas de despacho en el mercado de aeronaves con motor de pistón. Los ecosistemas de formación transfronterizos están escalando, como lo demuestra la estrategia de configuración multipaís de Intercontinental Aviation Enterprise para las entregas de DA40 NG y DA42-VI programadas para 2026. Los pedidos estructurados de Air India para entrenadores Archer DX reflejan canales vinculados a aerolíneas que utilizan socios de formación nacionales e internacionales para cumplir los objetivos de rendimiento. A medida que mejora la armonización regulatoria y los privilegios de BasicMed o piloto deportivo se extienden a más pilotos bajo condiciones específicas, la formación comercial y determinados roles de trabajo aéreo amplían la base de uso de las flotas de pistón.
Por Aplicación: Los Servicios de Taxi Aéreo y Chárter Superan a los Roles Tradicionales
Las plataformas de misión especial representaron el 42,05% del mercado de aeronaves con motor de pistón en 2025, ancladas por roles de observación, patrulla, fumigación agrícola y respuesta de emergencia que favorecen los perfiles de baja altitud y baja velocidad. Los organismos públicos aprovechan las aeronaves de pistón para búsqueda y rescate en el interior, estudios de fauna silvestre y evaluaciones de socorro en casos de desastre, donde la economía de combustible y la agudeza visual son esenciales. El plan de China para extender los servicios de rescate de emergencia aérea a más provincias crea requisitos constantes para las flotas de pistón utilitarias a medida que se amplían los aeropuertos y la capacidad de formación. Este segmento también se beneficia de los motores diésel que amplían la resistencia con Jet A y simplifican las operaciones mediante el control FADEC en el mercado de aeronaves con motor de pistón. A medida que madura la aviónica, las aeronaves de misión especial se benefician de pilotos automáticos integrados, visión sintética y monitoreo del motor que mejoran la seguridad y reducen la carga de trabajo del piloto durante las salidas prolongadas.
Se prevé que los servicios de taxi aéreo y chárter crezcan a una CAGR del 8,88% a medida que los operadores abordan la escasa conectividad regional en partes del Sudeste Asiático y América Latina, así como en geografías remotas que no pueden soportar aeronaves más grandes. El marco de MOSAIC puede ampliar las oportunidades de trabajo aéreo para las aeronaves deportivas ligeras e impulsar la afluencia de pilotos, apoyando indirectamente los segmentos de chárter y lanzadera que dependen de un flujo constante de pilotos calificados. Los socios de formación regional en Oriente Medio y Europa están expandiendo ecosistemas de múltiples ubicaciones, alineando la vigencia de los instructores y los inventarios de piezas para apoyar una mayor utilización en las flotas de pistón. Para necesidades de chárter de mayor alcance o premium, los turbohélices siguen dominando. Sin embargo, las aeronaves de pistón mono y bimotores llenan un nicho rentable para misiones de etapa corta con requisitos básicos de campo en el mercado de aeronaves con motor de pistón. Durante el período de pronóstico, el crecimiento del chárter, la formación de pilotos resiliente y la demanda persistente de misiones especiales apoyan la combinación de aplicaciones en el mercado de aeronaves con motor de pistón.
Análisis Geográfico
América del Norte retuvo el 39,1% del valor de 2025, representando el 72,6% de las entregas globales de pistón, una posición respaldada por la sólida infraestructura de aviación general de la región y una gran base instalada. Las previsiones de la FAA continúan rastreando la actividad por categoría de flota, y las escuelas de vuelo estadounidenses se benefician del entorno operativo más amplio de MOSAIC, que puede incorporar a más pilotos al proceso mientras cumple con requisitos médicos y de formación manejables.[5]Administración Federal de Aviación, "Pronóstico Aeroespacial de la FAA para los Años Fiscales 2025–2045," FAA, faa.gov La expansión de la flota de la Patrulla Aérea Civil en 2025 ilustra el papel de la financiación pública en el sostenimiento de las misiones de pistón para iniciativas de búsqueda y rescate y servicio comunitario. La adopción del diésel sigue siendo incremental en América del Norte debido a la disponibilidad del avgas y el soporte heredado. Sin embargo, el paso de Textron al encendido electrónico dual demuestra cómo la tecnología incremental ayuda a mejorar el tiempo de actividad y el costo total de propiedad para las flotas de formación. El mercado de aeronaves con motor de pistón en América del Norte sigue anclado por una combinación equilibrada de propietarios privados, escuelas de vuelo y organismos públicos que en conjunto sustentan una demanda constante hasta 2031.
Los operadores europeos continúan adoptando pistones diésel con Jet A, y los hitos del motor Austro de Diamond subrayan la adopción generalizada vinculada a menores costos de combustible y políticas medioambientales que apoyan operaciones sin plomo y de menores emisiones. La hoja de ruta medioambiental de la EASA influye en los estándares de diseño y las áreas de enfoque de certificación que favorecen la propulsión más silenciosa y de menores emisiones, manteniendo al mismo tiempo el rendimiento práctico necesario para los roles de formación y utilitarios. Los clubes de vuelo europeos, las organizaciones de formación aprobadas y las organizaciones de formación declaradas ofrecen un canal maduro para la formación privada y comercial, con eventos como AERO Friedrichshafen que muestran mejoras continuas en aviónica de pistón, sistemas de seguridad y paquetes de soporte para el mercado de aeronaves con motor de pistón. La adopción generalizada de aviónica de Garmin en los modelos de pistón más populares refuerza la estandarización en cabinas de vuelo digitales que se alinean con la formación al estilo de las aerolíneas en Europa. A medida que los operadores europeos implementan medidas de reducción de ruido y transición de combustible, los pistones diésel y los sistemas de encendido mejorados ayudan a gestionar los costos del ciclo de vida y garantizar el cumplimiento en una región con normas medioambientales más estrictas.
Se proyecta que Asia-Pacífico crezca a una CAGR del 6,98%, respaldada por el desarrollo de infraestructura de China, la creciente demanda de formación y las políticas de apoyo en mercados como India que agilizan las licencias y las operaciones no regulares. China autorizó 239 nuevos aeropuertos de aviación general en 2024 y planea registrar más aeronaves de aviación general y ampliar la cobertura de rescate de emergencia para 2025, demostrando un amplio apoyo a los entrenadores de pistón y las flotas utilitarias. La flota de 400 aeronaves de la Universidad de Vuelo de Aviación Civil y sus 500.000 horas de vuelo anuales son emblemáticas de la inversión sostenida en capacidad de formación que ancla la demanda de los tipos de pistón más populares. ITA proyecta una expansión a largo plazo de la flota de aviación general de China, con una porción significativa dedicada a la formación, apoyando la planificación de producción de los fabricantes de equipos originales y ampliando la red de posventa en la región. Los mercados del Sudeste Asiático y Australasia continúan desplegando aeronaves de pistón para lanzaderas regionales, trabajo aéreo y formación en entornos remotos que requieren plataformas robustas y económicas, fortaleciendo así la huella regional del mercado de aeronaves con motor de pistón.

Panorama Competitivo
La actividad del mercado destaca una innovación de producto constante y acuerdos estratégicos de flota adaptados a las necesidades de formación y operadores propietarios. Cirrus presentó la serie SR G7+ 2026 con el sistema de aterrizaje automático de emergencia Safe Return estándar y un ecosistema conectado para actualizaciones y mayor conciencia de pista, reforzando su liderazgo en el mercado de aeronaves con motor de pistón. El lanzamiento en 2025 de Textron del encendido electrónico dual en los nuevos Skyhawks mejora la fiabilidad y la eficiencia del mantenimiento, beneficiando a las organizaciones de formación con altos requisitos de despacho. Piper aseguró un importante pedido de la Universidad de Dakota del Norte valorado en casi USD 155 millones y realizó la transición al diésel en la formación multimotor con el Seminole DX, lo que resultó en ahorros de combustible y mejoras de rendimiento.
Diamond reintrodujo el DA20i Katana en la producción europea en su instalación austriaca y lo entregó a CAE, apoyando la formación ab initio y multimotor con el DA40 NG y el DA42-VI, ambos certificados para Jet A y equipados con controles FADEC. Las plataformas de formación transfronterizas se están expandiendo con registros en múltiples países para optimizar el uso de la flota y la colocación de estudiantes. La experiencia de BAE Systems en tecnología FADEC destaca el creciente papel de los controles digitales del motor para mejorar la fiabilidad, habilitar diagnósticos predictivos e integrarse con la aviónica moderna en las categorías de pistón y turbina.
Las tendencias del mercado enfatizan la seguridad, la integración digital y la flexibilidad de combustible en el sector de aeronaves con motor de pistón. La estandarización del aterrizaje automático de emergencia de Cirrus se alinea con un enfoque más amplio en la mitigación de riesgos, lo que potencialmente facilita las negociaciones de seguros. La estrategia de bimotores diésel de Piper apunta a la resiliencia del combustible y la escalabilidad en la formación internacional, mientras que la actualización del encendido de Textron simplifica las operaciones para las grandes flotas de formación. Los fabricantes de equipos originales también están mejorando el soporte al cliente y la disponibilidad de piezas, cruciales para las flotas estandarizadas que requieren rotaciones rápidas y mantenimiento predecible. Estas estrategias apoyan colectivamente un mercado competitivo centrado en el tiempo de actividad, la seguridad y el control de costos durante el período de pronóstico.
Líderes de la Industria de Aeronaves con Motor de Pistón
Textron Inc.
Piper Aircraft, Inc.
Diamond Aircraft Industries GmbH
Cirrus Design Corporation
Costruzioni Aeronautiche Tecnam S.p.A.
- *Nota aclaratoria: los principales jugadores no se ordenaron de un modo en especial

Desarrollos Recientes de la Industria
- Enero de 2026: Cirrus Aircraft presentó los modelos 2026 de la Serie SR G7+ con el aterrizaje automático de emergencia Safe Return estándar, actualizaciones automáticas de bases de datos a través de Cirrus IQ PRO Advanced, conciencia de ocupación de pista y calefacción inteligente del tubo de Pitot, además de conectividad ampliada para actualizaciones automáticas del tiempo a lo largo de la ruta.
- Octubre de 2025: Diamond Aircraft reintrodujo el DA20i Katana en la producción europea en su instalación austriaca, con AELO Swiss Academy realizando un pedido inicial de flota y las entregas programadas para 2027.
- Julio de 2025: Textron Aviation introdujo sistemas de encendido electrónico dual como estándar en todos los nuevos aviones Cessna Skyhawk, reemplazando los magnetos duales para mejorar los intervalos de mantenimiento, la eficiencia del combustible y la fiabilidad del despacho.


Alcance del Informe Global del Mercado de Aeronaves con Motor de Pistón
Las aeronaves con motor de pistón, también conocidas como aeronaves con motor alternativo, utilizan motores de combustión interna para propulsarse. Predominantemente, estas aeronaves sirven a la aviación general, atendiendo roles de formación, negocios y utilitarios ligeros. Típicamente, tienen entre 1 y 6 asientos, operan a altitudes por debajo de los 15.000 pies y a menudo utilizan motores de cilindros opuestos horizontalmente para un enfriamiento eficiente por aire.
El mercado de motores de pistón está segmentado por tipo de motor, servicio al usuario final, aplicación y geografía. Por tipo de motor, el mercado está segmentado en motor único y doble motor. Por servicio al usuario final, el mercado se clasifica en civil/comercial y gobierno y militar. Por aplicación, el mercado está segmentado en deportes, formación de pilotos, levantamiento aéreo, agricultura y silvicultura, taxi aéreo y chárter, y misión especial. El informe también cubre los tamaños de mercado y las previsiones para el mercado de aeronaves con motor de pistón en los principales países de las diferentes regiones. Para cada segmento, el tamaño del mercado se proporciona en términos de valor (USD).
| Motor Único |
| Doble Motor |
| Civil/Comercial |
| Gobierno y Militar |
| Deportes |
| Formación de Pilotos |
| Levantamiento Aéreo |
| Agricultura y Silvicultura |
| Taxi Aéreo y Chárter |
| Misión Especial |
| América del Norte | Estados Unidos | |
| Canadá | ||
| México | ||
| Europa | Reino Unido | |
| Francia | ||
| Alemania | ||
| Italia | ||
| España | ||
| Rusia | ||
| Resto de Europa | ||
| Asia-Pacífico | China | |
| India | ||
| Japón | ||
| Corea del Sur | ||
| Indonesia | ||
| Australia | ||
| Resto de Asia-Pacífico | ||
| América del Sur | Brasil | |
| Resto de América del Sur | ||
| Oriente Medio y África | Oriente Medio | Arabia Saudita |
| Emiratos Árabes Unidos | ||
| Catar | ||
| Resto de Oriente Medio | ||
| África | Sudáfrica | |
| Nigeria | ||
| Resto de África | ||
| Por Tipo de Motor | Motor Único | ||
| Doble Motor | |||
| Por Servicio al Usuario Final | Civil/Comercial | ||
| Gobierno y Militar | |||
| Por Aplicación | Deportes | ||
| Formación de Pilotos | |||
| Levantamiento Aéreo | |||
| Agricultura y Silvicultura | |||
| Taxi Aéreo y Chárter | |||
| Misión Especial | |||
| Por Geografía | América del Norte | Estados Unidos | |
| Canadá | |||
| México | |||
| Europa | Reino Unido | ||
| Francia | |||
| Alemania | |||
| Italia | |||
| España | |||
| Rusia | |||
| Resto de Europa | |||
| Asia-Pacífico | China | ||
| India | |||
| Japón | |||
| Corea del Sur | |||
| Indonesia | |||
| Australia | |||
| Resto de Asia-Pacífico | |||
| América del Sur | Brasil | ||
| Resto de América del Sur | |||
| Oriente Medio y África | Oriente Medio | Arabia Saudita | |
| Emiratos Árabes Unidos | |||
| Catar | |||
| Resto de Oriente Medio | |||
| África | Sudáfrica | ||
| Nigeria | |||
| Resto de África | |||


Definición de mercado
- Tipo de Aeronave - El segmento de aeronaves de ala fija de pistón está incluido bajo el tipo de aeronave de Aviación General.
- Subtipo de Aeronave - Todas las aeronaves de ala fija de pistón utilizadas por institutos de formación de pilotos, fines agrícolas, actividades deportivas y otras aplicaciones están incluidas bajo la categoría de aviación general de este estudio.
- Tipo de Fuselaje -
| Palabra clave | Definición |
|---|---|
| IATA | IATA son las siglas de la Asociación Internacional de Transporte Aéreo, una organización comercial compuesta por aerolíneas de todo el mundo que tiene influencia sobre los aspectos comerciales del vuelo. |
| ICAO | ICAO son las siglas de la Organización de Aviación Civil Internacional, un organismo especializado de las Naciones Unidas que apoya la aviación y la navegación en todo el mundo. |
| Certificado de Operador Aéreo (COA) | Un certificado otorgado por una Autoridad Nacional de Aviación que permite la realización de actividades de vuelo comercial. |
| Certificado de Aeronavegabilidad (CdA) | Un Certificado de Aeronavegabilidad es emitido para una aeronave por la autoridad de aviación civil del estado en el que está registrada la aeronave. |
| Producto Interior Bruto (PIB) | El producto interior bruto (PIB) es una medida monetaria del valor de mercado de todos los bienes y servicios finales producidos en un período de tiempo específico por los países. |
| RPK (Pasajeros-Kilómetro de Ingresos) | El RPK de una aerolínea es la suma de los productos obtenidos multiplicando el número de pasajeros de ingresos transportados en cada etapa de vuelo por la distancia de la etapa; es el número total de kilómetros recorridos por todos los pasajeros de ingresos. |
| Factor de Carga | El factor de carga es una métrica utilizada en la industria aérea que mide el porcentaje de la capacidad de asientos disponibles que ha sido ocupada por pasajeros. |
| Fabricante de Equipos Originales (OEM) | Un fabricante de equipos originales se define tradicionalmente como una empresa cuyos bienes se utilizan como componentes en los productos de otra empresa, que luego vende el artículo terminado a los usuarios. |
| Asociación Internacional de Seguridad del Transporte (ITSA) | La Asociación Internacional de Seguridad del Transporte es una red internacional de jefes de autoridades independientes de investigación de seguridad. |
| Asientos-Kilómetro Disponibles (AKD) | Esta métrica se calcula multiplicando los Asientos Disponibles en un vuelo, definidos anteriormente, por la distancia recorrida. |
| Peso Bruto | El peso totalmente cargado de una aeronave, también conocido como "peso de despegue", que incluye el peso combinado de pasajeros, carga y combustible. |
| Aeronavegabilidad | La capacidad de una aeronave, u otro equipo o sistema aerotransportado, para operar en vuelo y en tierra sin riesgo significativo para la tripulación de vuelo, el personal de tierra, los pasajeros u otras terceras partes. |
| Normas de Aeronavegabilidad | Criterios de diseño y seguridad detallados y exhaustivos aplicables a la categoría de producto aeronáutico (aeronave, motor o hélice). |
| Operador de Base Fija (FBO) | Una empresa u organización que opera en un aeropuerto. Un operador de base fija proporciona servicios de operación de aeronaves como mantenimiento, repostaje, formación de vuelo, servicios de chárter, hangaraje y estacionamiento. |
| Individuos de Alto Patrimonio Neto (HNWIs) | Los individuos de alto patrimonio neto son personas con más de USD 1 millón en activos financieros líquidos. |
| Individuos de Patrimonio Neto Ultra Elevado (UHNWIs) | Los individuos de patrimonio neto ultra elevado son personas con más de USD 30 millones en activos financieros líquidos. |
| Administración Federal de Aviación (FAA) | La división del Departamento de Transporte se ocupa de la aviación. Opera el Control del Tráfico Aéreo y regula todo, desde la fabricación de aeronaves hasta la formación de pilotos y las operaciones aeroportuarias en los Estados Unidos. |
| EASA (Agencia Europea de Seguridad Aérea) | La Agencia Europea de Seguridad Aérea es una agencia de la Unión Europea establecida en 2002 con la tarea de supervisar la seguridad y la regulación de la aviación civil. |
| Aeronave con Sistema de Alerta y Control Aerotransportado (AW&C) | Una aeronave con Sistema de Alerta y Control Aerotransportado está equipada con un potente radar y un centro de mando y control a bordo para dirigir las fuerzas armadas. |
| La Organización del Tratado del Atlántico Norte (OTAN) | La Organización del Tratado del Atlántico Norte, también llamada Alianza del Atlántico Norte, es una alianza militar intergubernamental entre 30 estados miembros: 28 europeos y dos norteamericanos. |
| Avión de Combate Conjunto (JSF) | El programa de desarrollo y adquisición del Avión de Combate Conjunto está destinado a reemplazar una amplia gama de aeronaves de combate, ataque y apoyo terrestre existentes para los Estados Unidos, el Reino Unido, Italia, Canadá, Australia, los Países Bajos, Dinamarca, Noruega y anteriormente Turquía. |
| Aeronave de Combate Ligero (LCA) | Una aeronave de combate ligero es una aeronave militar ligera multifunción de reacción/turbohélice, comúnmente derivada de diseños de entrenadores avanzados, diseñada para participar en combate ligero. |
| Instituto Internacional de Investigación para la Paz de Estocolmo (SIPRI) | El Instituto Internacional de Investigación para la Paz de Estocolmo es un instituto internacional que proporciona datos, análisis y recomendaciones sobre conflictos armados, gasto militar y comercio de armas, así como sobre desarme y control de armamentos. |
| Aeronave de Patrulla Marítima (MPA) | Una aeronave de patrulla marítima, también conocida como aeronave de reconocimiento marítimo, es una aeronave de ala fija diseñada para operar durante largos períodos sobre el agua en roles de patrulla marítima, en particular, guerra antisubmarina, guerra antisuperficie y búsqueda y rescate. |
| Número de Mach | El número de Mach se define como la relación entre la velocidad aerodinámica verdadera y la velocidad del sonido a la altitud de una aeronave determinada. |
| Aeronave Furtiva | La furtividad es un término común aplicado a la tecnología y doctrina de baja observabilidad, que hace que una aeronave sea casi invisible para la detección por radar, infrarrojo o visual. |


Metodología de Investigación
Mordor Intelligence sigue una metodología de cuatro pasos en todos nuestros informes.
- Paso 1: Identificar las Variables Clave: Con el fin de construir una metodología de pronóstico sólida, las variables y factores identificados en el Paso 1 se contrastan con los datos históricos de mercado disponibles. Mediante un proceso iterativo, se establecen las variables necesarias para el pronóstico del mercado y el modelo se construye sobre la base de estas variables.
- Paso 2: Construir un Modelo de Mercado: Las estimaciones del tamaño del mercado para los años históricos y de pronóstico se han proporcionado en términos de ingresos y volumen. Para la conversión de ventas a volumen, el precio de venta promedio se mantiene constante durante todo el período de pronóstico para cada país, y la inflación no forma parte de la fijación de precios.
- Paso 3: Validar y Finalizar: En este importante paso, todos los datos del mercado, las variables y las valoraciones de los analistas se validan a través de una extensa red de expertos en investigación primaria del mercado estudiado. Los encuestados se seleccionan en todos los niveles y funciones para generar una imagen holística del mercado estudiado.
- Paso 4: Resultados de la Investigación: Informes Sindicados, Asignaciones de Consultoría Personalizada, Bases de Datos y Plataformas de Suscripción


