
Market Overview
| Study Period | 2021 - 2031 |
|---|---|
| Forecast Data Period | 2026 - 2031 |
| Base Year Market Size (2025) | USD 432.38 Billion |
| Market Size (2026) | USD 453.27 Billion |
| Market Size (2031) | USD 573.83 Billion |
| Growth Rate (2026 - 2031) | 4.83 % |
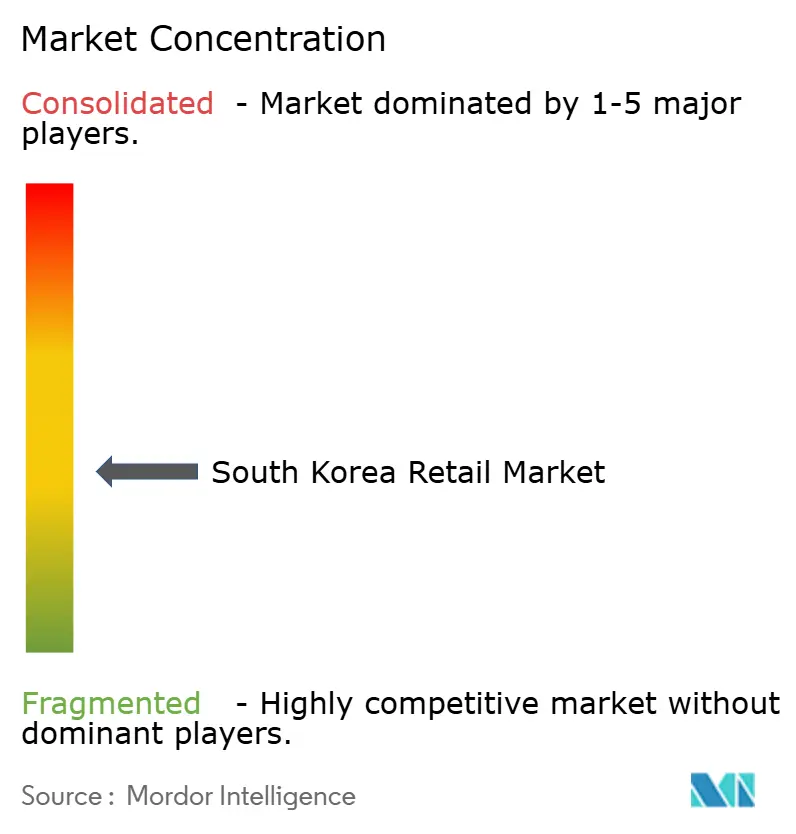
| Market Concentration | Medium |
Major Players *Disclaimer: Major Players sorted in no particular order Image © Mordor Intelligence. Reuse requires attribution under CC BY 4.0. | |
South Korea Retail Market Analysis by Mordor Intelligence
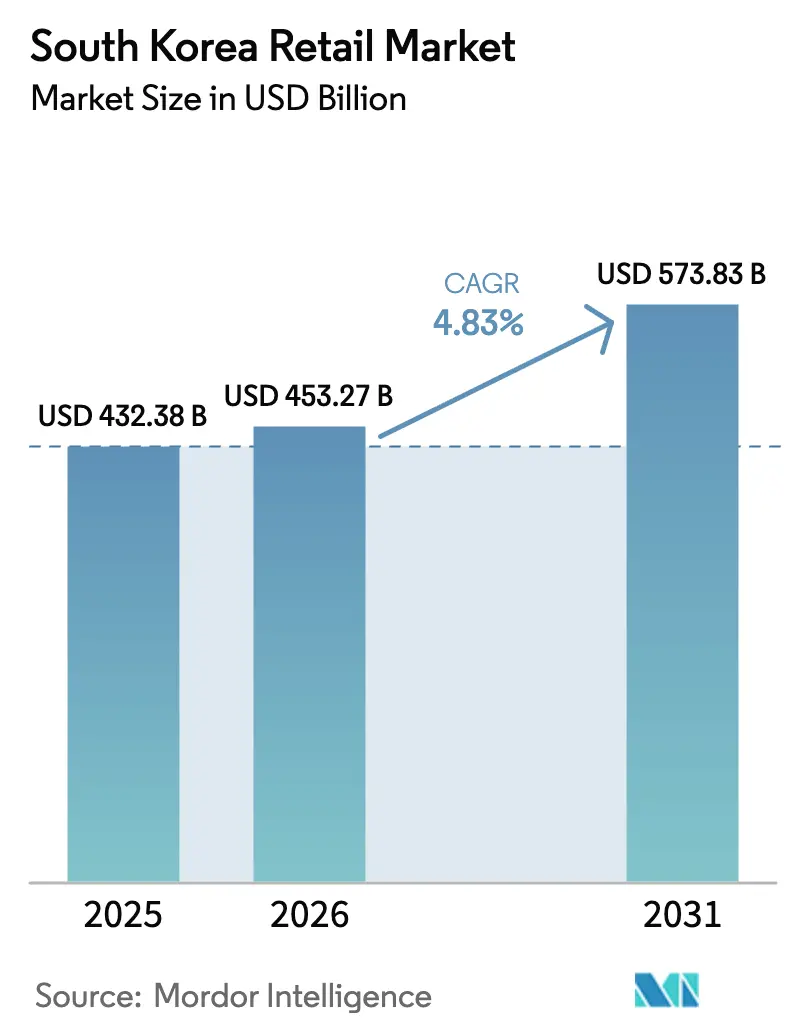
The South Korea retail market size is expected to grow from USD 432.38 billion in 2025 to USD 453.27 billion in 2026 and is forecast to reach USD 573.83 billion by 2031 at a 4.83% CAGR over 2026-2031. Growth reflects a shift from pandemic volatility toward modernization as ultra-fast logistics and mobile-first commerce reshape competition and margins. E-commerce depth is a structural feature, yet resilient offline formats in convenience and department stores continue to serve urban proximity and luxury demand. Omni-channel grocery emerges as the fastest-growing retail channel, as chains use physical footprints to enable same-day delivery and real-time inventory visibility. Regulatory reforms are tightening payment risk controls while supporting innovation in digital finance and data protection, which stabilizes trust in the South Korea retail market.
Key Report Takeaways
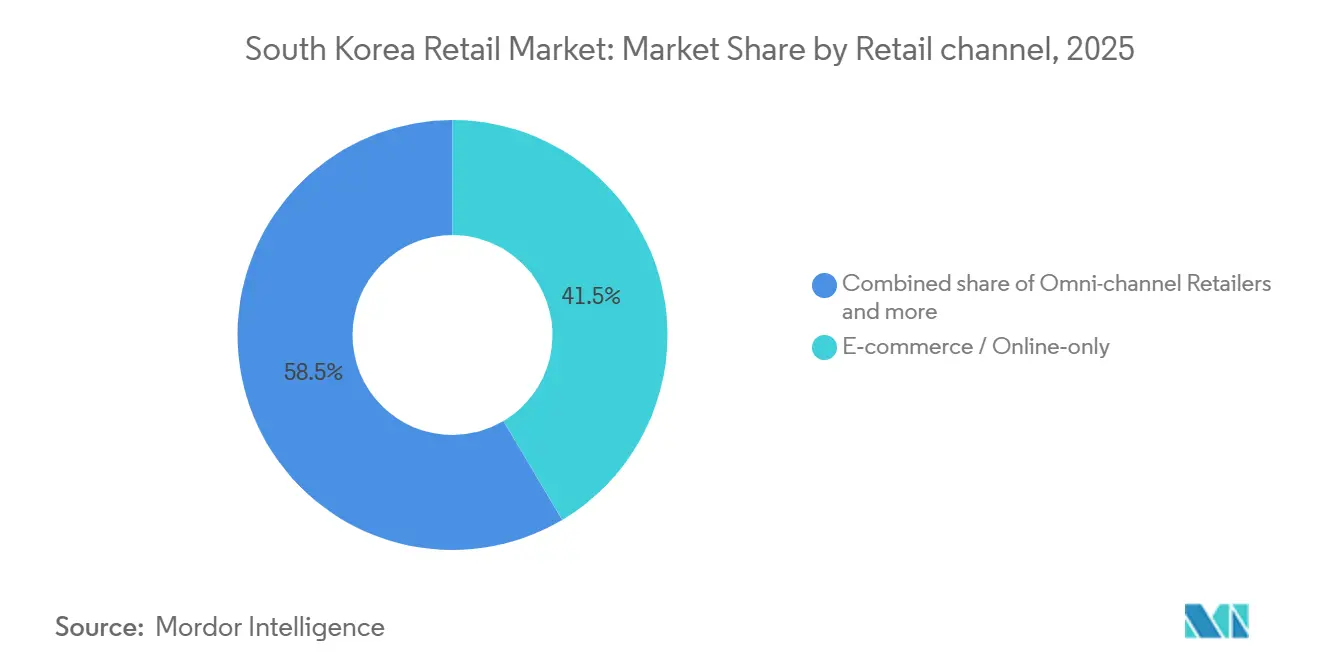
- By retail channel, e-commerce and online-only held 41.48% revenue share in 2025, while omni-channel grocery is forecast to expand at a 6.48% CAGR through 2031.
- By product category, grocery and food led with a 31.47% revenue share in 2025, while beauty and personal care are projected to grow at a 5.82% CAGR through 2031.
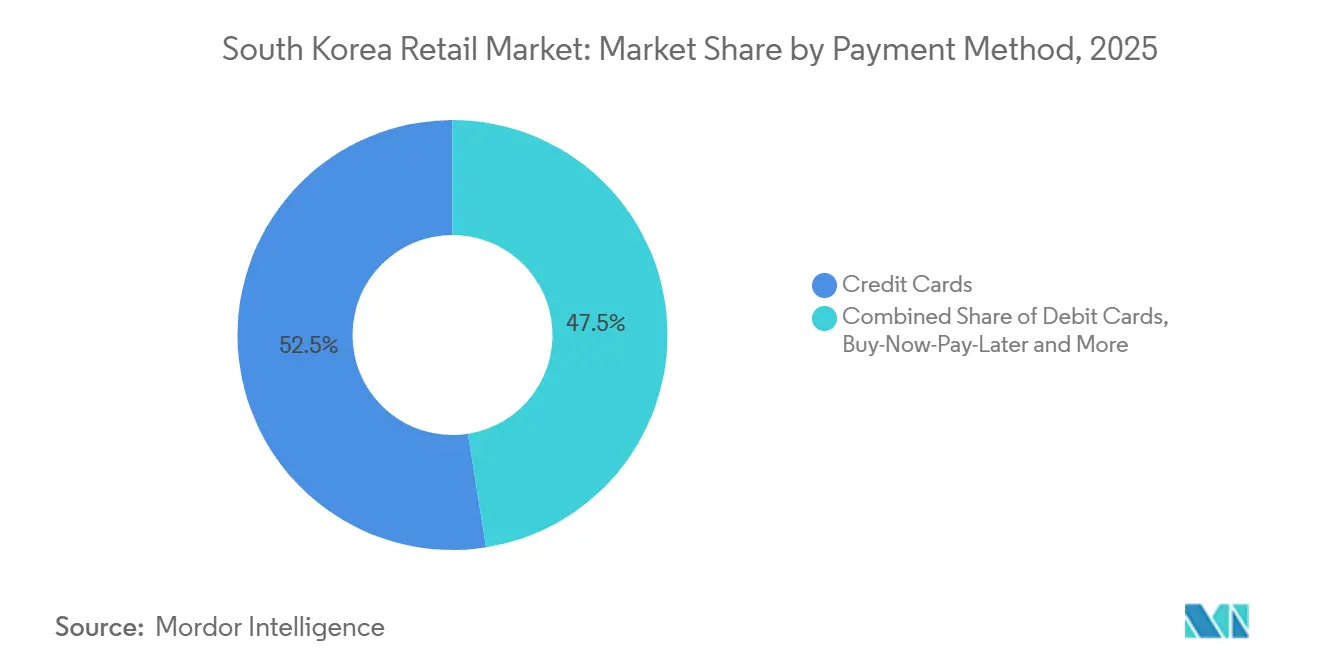
- By payment method, credit cards accounted for a 52.49% share in 2025, and buy-now-pay-later is expected to grow at a 7.29% CAGR through 2031.
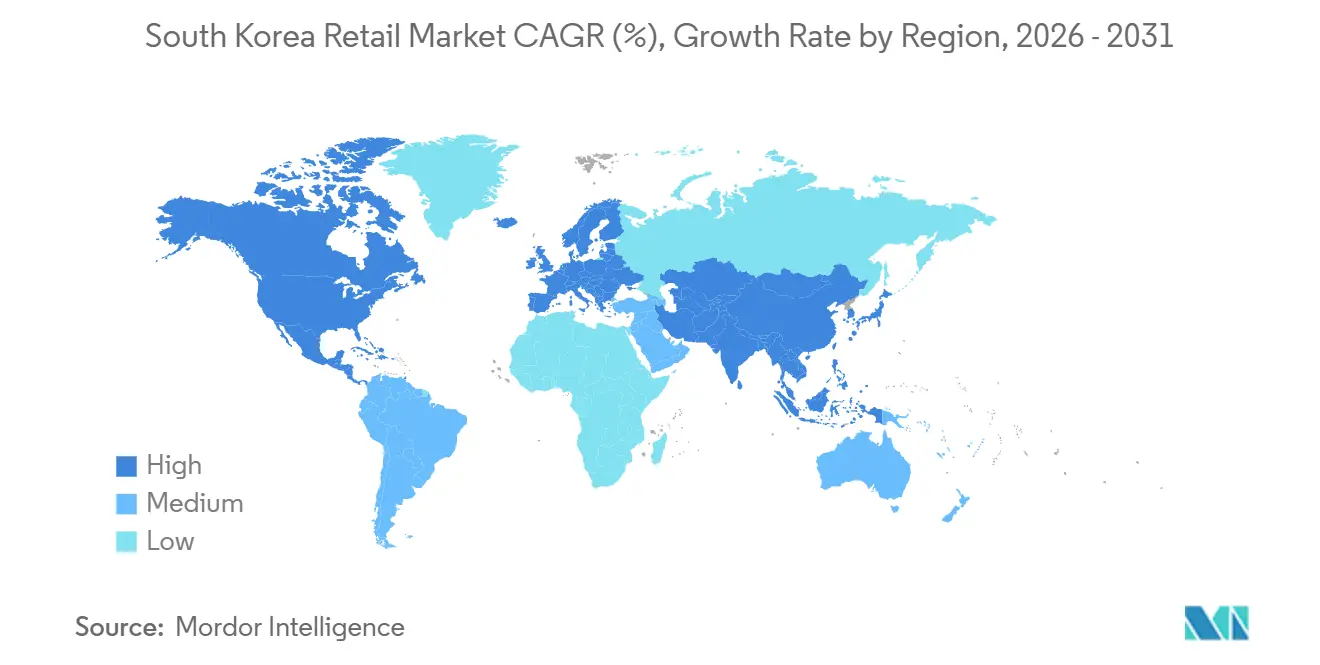
- By region, the Seoul Capital Area commanded a 47.25% share in 2025, while Jeju is projected to post a 6.74% CAGR through 2031.
Note: Market size and forecast figures in this report are generated using Mordor Intelligence’s proprietary estimation framework, updated with the latest available data and insights as of January 2026.
South Korea Retail Market Trends and Insights
Drivers Impact Analysis*
| Driver | (~) % Impact on CAGR Forecast | Geographic Relevance | Impact Timeline |
|---|---|---|---|
| Rapid growth of mobile & e-commerce channels | +1.2% | Global, peak in Seoul Capital Area and Incheon | Medium term (2-4 years) |
| High penetration of digital payments & super-apps | +0.9% | National, urban centers with smartphone penetration | Short term (≤ 2 years) |
| Expansion of convenience formats for single-person households | +0.7% | National, with early gains in Seoul, Busan, and university districts | Medium term (2-4 years) |
| Government support for cold-chain logistics & smart retail | +0.5% | Busan Port logistics hub and rural areas for fresh delivery | Long term (≥ 4 years) |
| Retail-media networks unlocking new revenue streams | +0.4% | Platform-centric, Coupang and Naver ecosystems | Medium term (2-4 years) |
| AI-driven hyper-personalisation in super-apps | +0.3% | National, led by Naver, Kakao, and vertical platforms | Long term (≥ 4 years) |
| Source: Mordor Intelligence | |||
Rapid Growth Of Mobile & E-Commerce Channels
Mobile transactions accounted for 77.7% of online shopping value in October 2025, up from 75.9% in September, underscoring a smartphone-first shift in buyer behavior in South Korea. Ultra-fast fulfillment continues to set expectations as fresh grocery reach within 24 hours scales to 98% of the population, compressing inventory cycles across the South Korea retail market. Coupang reported October 2025 daily average product commerce revenue of USD 323 per active customer, up 7% year over year on a constant currency basis, which signals platform stickiness despite price competition from Chinese entrants. Online shopping grew 15.8% year over year in the first half of 2025 as offline retail stagnated near zero growth, pointing to structural channel migration. That outperformance is moderating since online transaction value growth slowed to 4.5% in 2025 versus 8.5% in 2024, implying saturation effects that will test growth strategies in the South Korea retail market.
High Penetration Of Digital Payments & Super-Apps
Cash usage declined to 14.6% of transactions by 2021, and mobile wallets captured 32.9% of e-commerce payments in 2023, reflecting a long-running policy push toward cashless activity. Simple payment services with biometric authentication processed a daily average of USD 0.72 billion in the first half of 2025, while prepaid electronic payments reached USD 0.89 billion per day. Card payments accessed via mobile devices represented 53.8% of total card transaction value in the first half of 2025 as physical card usage contracted. The Electronic Financial Transactions Act, revised in December 2025, requires payment gateways to externally manage 100% of unsettled funds by December 2026, phased to 60% in year one, 80% in year two, and full compliance in year three. In parallel, the Bank of Korea’s retail CBDC pilot “Project Han River” enrolled 51,766 digital wallets and processed 29,591 transactions in April 2025, testing retail use with convenience stores and home shopping channels[1].
Expansion Of Convenience Formats For Single-Person Households
Single-person households reached 8.05 million in 2024, or 36.1% of all households, increasing structural demand for small-basket, 24-hour formats. Nationwide convenience store count totaled 54,780, with the top three chains operating 48,315 stores as of May 2025, although the format saw a net decline of 667 units over six months to November 2025. BGF Retail, operator of CU with 18,458 stores, reported 2024 consolidated sales of USD 6.03 billion and operating income of USD 0.17 billion amid higher automation and franchise support costs[2]. GS Retail’s convenience business posted Q2 2025 revenue of USD 1.54 billion with an operating profit of USD 0.04 billion as transformation spending weighed on margins. Meal-replacement sales grew faster than the segment average, which aligns with rising time pressure among urban consumers in the South Korea retail market.
Government Support For Cold-Chain Logistics & Smart Retail
Fiscal incentives during promotional events in late 2025 lifted home appliance sales, signaling that policy can nudge higher-ticket retail and adjacent logistics upgrades. Lotte planned USD 0.52 billion in smart logistics at the Busan Port Authority and introduced 30-minute delivery for 10,000 items to speed cross-border e-commerce flows. Coupang invested USD 0.14 billion to expand Rocket Fresh Everywhere cold-chain coverage to 98% of the population by the end of 2024, using micro-fulfillment in underserved areas. BGF Retail approved USD 0.13 billion for a new Busan logistics center, to be completed in 2026, to strengthen cold-chain capacity for fresh and ready-to-eat assortments. The Korea Customs Service deployed AI-based risk screening for express e-commerce, cutting high-risk analysis time and yielding estimated annual savings of USD 0.08 billion.
Restraints Impact Analysis*
| Restraints | (~) % Impact on CAGR Forecast | Geographic Relevance | Impact Timeline |
|---|---|---|---|
| Saturation & cannibalisation among convenience stores | -0.6% | National, acute in Seoul metro dense areas | Short term (≤ 2 years) |
| Escalating labour and real-estate costs | -0.5% | Seoul Capital Area, key commercial districts | Medium term (2-4 years) |
| Low NFC terminal penetration is hindering Apple Pay uptake | -0.2% | National, legacy MST infrastructure | Medium term (2-4 years) |
| Gen-Alpha shift to recommerce platforms | -0.2% | Urban youth markets and university towns | Long term (≥ 4 years) |
| Regulatory compliance burdens on gateways and data flows | -0.2% | National across payment gateways and data | Medium term (2-4 years) |
| Source: Mordor Intelligence | |||
Saturation And Cannibalisation Among Convenience Stores
Store density is high in metro cores, which results in formats competing within short distances and eroding unit economics. A net decline of 667 stores over six months to November 2025 marks the first sustained contraction since 1988, even as single-person household demand grows. BGF Retail posted USD 6.04 billion in 2024 sales and USD 0.17 billion in operating income, while margin compression reflected automation depreciation and higher franchise support. GS Retail’s convenience segment reported USD 1.55 billion in Q2 2025 revenue and USD 0.04 billion in operating profit, showing similar cost headwinds. The USDA Foreign Agricultural Service estimated convenience stores at a 23% grocery retail share in 2024, exceeding supermarkets and hypermarkets, which underscores format importance despite saturation[3].
Escalating Labour And Real-Estate Costs
Costs are concentrated in the Seoul Capital Area, where commercial rents and wages remain elevated, which weighs on unit profitability in dense trade areas. Operating trends at major chains show higher SG&A from digital and store technology investments, suggesting limited room to absorb fixed cost inflation without pricing or mix shifts. Convenience and hypermarket operators continue to rationalize footprints and seek a higher-margin mix, which is consistent with the slower growth reported in 2025. Department stores have leaned into luxury and tourist spending to offset cost pressure, which aligns with the premium segment’s recent outperformance. These cost dynamics create uneven pressure across formats and amplify the role of logistics, data, and media monetization in the South Korea retail market.
*Our forecasts treat driver/restraint impacts as directional, not additive. The impact forecasts reflect baseline growth, mix effects, and variable interactions.
Segment Analysis
By Retail Channel: Platform Duopoly Drives Digital, Omni-Channel Bridges the Gap
E-commerce and online-only platforms accounted for 41.48% of South Korea's retail market share in 2025, placing the country among the most digitally penetrated retail economies globally. The market combines rapid digital adoption with offline resilience, as convenience and department store formats meet demand driven by proximity and luxury. Omni-channel grocery, integrating dense store networks with short delivery times, is shaping the market. Hypermarkets experienced negative growth during several months, while proximity-focused Super Supermarkets (SSMs) showed growth, reflecting differing offline grocery dynamics. Department stores recorded a 2.8% year-over-year increase in August, supported by luxury and tourism spending.
Omni-channel grocery is the fastest-growing segment, with its market size expected to grow at a 6.48% CAGR from 2026 to 2031. Retailers leverage app-based inventory, three-hour delivery, and curbside pickup. Platform-scale logistics drive growth, as seen in Coupang’s Q3 2025 product commerce momentum and fulfillment solutions for third-party sellers. Naver’s commerce advertising expansion and NAVER Pay’s Q1 2025 TPV of USD 13.60 billion enhance digital retail conversion. Platform concentration is significant, with CR2 above 46% of e-commerce GMV and CR10 near 68% in 2024, balancing platform economics with neighborhood accessibility for speed, selection, and service.

By Product Category: Beauty Outpaces Grocery As Experience Trumps Commodity
Grocery and food commanded a 31.47% share of the South Korea retail market in 2025, supported by steady online demand for food and beverage categories. Online food and beverage sales rose 16.3% year over year in August 2025, and fresh food categories posted double-digit gains during mid-2025 as buying shifted from bulk trips to app-based replenishment. The South Korean retail market has also seen beauty and personal care emerge as the fastest growing category on the K-beauty strength and specialty chain scale. Consumer electronics posted uneven trends tied to device launch cycles, which limit sustained uplift outside marquee release windows. Home and living grew during H1 2025, aided by incentives that lifted appliance purchases during key events.
Beauty and personal care are projected to grow at a 5.82% CAGR through 2031, with CJ Olive Young’s 71.3% share in health-and-beauty retail and fiscal 2024 revenue of USD 3.32 billion, reinforcing category momentum. CJ Olive Young recorded an operating profit of USD 0.32 billion and 9.42 million foreign transactions in FY2024, highlighting inbound tourism exposure and margin advantage. Fashion shows a split picture, as offline clothing sales fell in 2024, while online clothing transaction value reached USD 15.26 billion in 2024, with cross-border purchases from China at USD 1.70 billion. The South Korea retail market also includes specialty retail and niche warehouse formats that use price or curation to defend share amid platform scale. Data show food products at 13.8% and food services at 15.6% of online shopping value in June 2025, with e-coupons declining due to the wind-down of stimulus effects.
By Payment Method: Credit Cards Dominate, BNPL Surges Among Youth
Credit cards held a 52.49% share of retail payments in 2025 and continued to outperform debit as consumers favored installment flexibility. Prepaid and debit modes showed mixed trends as classification changes affected reporting and as simple payments absorbed incremental growth. Mobile device-accessed card payments reached 53.8% of total card transaction value in H1 2025, while physical card usage contracted at a modest rate. Samsung Pay’s USD 50.79 billion 2023 transaction volume established an infrastructure that enables QR and MST acceptance across legacy terminals. KakaoPay reported Q3 2025 TPV of USD 32.61 billion with robust offline growth from wider acceptance and public coupon integration.
Buy-now-pay-later is the fastest-growing payment method, with South Korea retail market size for BNPL projected to expand at a 7.29% CAGR from 2026 to 2031 as fintechs embed installment options at checkout. The Bank of Korea’s survey pointed to a strong preference for mobile among younger cohorts, with credit cards leading for middle-aged users, and cash still used among older demographics. The FSC’s December 2025 revision mandates 100% external management of unsettled funds by December 2026, phased 60%, 80%, then 100% and raises capital requirements for gateways above USD 0.02 billion quarterly volume from USD 0.69 million to USD 1.38 million. Account transfers via the small value payment network averaged USD 69.94 billion per day in H1 2025, while Open Banking growth slowed as simple payment services gained. These developments anchor confidence in digital transactions across the South Korea retail market as payment rails evolve.
Geography Analysis
The Seoul Capital Area held a 47.25% share of the South Korea retail market in 2025, supported by its dense population, high incomes, and logistics hubs. Retail sales declined 2.7% year over year in Q3 2025 due to saturation in duty-free, supermarket, and convenience store formats in urban districts. Incheon’s retail sales rose 5.5% year over year in Q3 2025, driven by gateway and mobility-related spending in automotive-adjacent categories. Major retailers are expanding into regional cities, with Hyundai Department Store planning large-format projects in Busan and Gwangju, while Shinsegae’s Starfield expansion reflects confidence in regional consumption corridors.
Sejong led the Chungcheong Region with 8.8% year-over-year retail sales growth in Q3 2025, while Chungbuk and Chungnam saw modest gains. The Connect Hyundai Cheongju opening in June 2025 introduced new brand assortments and omnichannel formats. Consumer sentiment reached 101.8 in May 2025, aiding recovery in discretionary categories and highlighting second-tier cities’ potential to adopt modern retail concepts. Persistent housing and cost pressures in the capital are likely to shift focus to regional markets.
In the Gyeongsang Region, Busan’s retail sales grew 1.9% year over year in Q3 2025, Gyeongnam rose 2.3%, while Gyeongbuk saw a slight decline. South Gyeongsang’s GRDP was USD 104.92 billion in 2024, with strong shipbuilding and defense activities, though retail trade lagged. Jeolla showed subdued growth, Gangwon declined 0.6% in Q3 2025, and Jeju, despite a projected 6.74% CAGR to 2031, saw sales dip in 2025 due to reduced tourism and increased service spending.
Regulatory Landscape
South Korea retail operates under a mix of competition, retail-operation, and digital-finance rules. The Korea Fair Trade Commission (KFTC) enforces the Act on Fairness in Large Retail Business to curb unfair practices in retailer-supplier dealings, including promotional cost shifting, returns, and payment delays. Payment and gateway compliance is also tightening under the Electronic Financial Transactions Act revision passed in December 2025, which requires external management of unsettled customer funds, phased to full compliance by December 2026.
A major policy debate affecting omnichannel operations centers on the Distribution Industry Development Act. In February 2026, the government and ruling party moved to abolish restrictions linked to overnight online deliveries by large offline retailers, addressing perceived regulatory imbalance versus online-only platforms. Separately, the Special Act on the Promotion of Traditional Markets and Shopping Districts was amended with an effective date of January 2, 2026, continuing policy support for traditional channels while modern formats scale delivery and data-driven retailing.
Value Chain Analysis
The South Korea retail value chain is anchored by brand owners and manufacturers (including food and consumer goods), importers, and wholesalers that feed national retail groups and platforms. Distribution then runs through a dense mix of e-commerce fulfillment networks, convenience stores, hypermarkets/SSMs, and department stores. Ultra-fast delivery capability supports logistics as a primary value driver, including cold chain, micro-fulfillment, and last-mile routing. Incumbents build proprietary networks, such as Rocket Fresh coverage reaching 98% of the population by end-2024, and invest in regional nodes like BGF Retails planned Busan logistics center (completion in 2026).
Key friction points show up in distribution capacity and labor reliability. Retailers have been adjusting sourcing and settlement practices to manage exchange-rate volatility and oil-linked distribution costs, including diversifying import origins and using non-USD settlement where feasible. Operational resilience also came into focus after fresh-food logistics disruptions at CU in April 2026 tied to labor action, which intensified the industry debate around outsourcing versus direct logistics management and contingency capacity planning. On the data layer, the Ministry of Trade, Industry and Energy launched a retail-AI alliance in April 2025, with projects focused on scaling standardized product information and supporting more automated merchandising, forecasting, and fulfillment decisions across channels.
Competitive Landscape
The South Korea retail market shows high platform concentration, with Coupang and Naver Shopping controlling over 46% of e-commerce GMV. Offline retail remains fragmented across convenience stores, hypermarkets, and department stores. Hypermarkets focus on price and speed, while department stores rely on luxury and tourist demand for growth. Specialty platforms monetize community and curation to maintain defensible take rates. E-commerce growth is supported by retail-media monetization and seller services, enhancing network effects.
In recent years, strategic initiatives have emphasized last-mile logistics, AI adoption, and partnerships. Coupang’s USD 0.13 billion cold-chain expansion and credit facilities bolster logistics and fulfillment. Naver scales commerce advertising and NAVER Pay while using AI to improve engagement and conversion. Kakao integrates AI agents into commerce and expands offline payment acceptance to boost TPV. E-Mart’s joint venture with AliExpress International and Gmarket enhances cross-border sourcing and logistics[4].
Technology remains a key differentiator as retailers deploy AI for pricing, recommendations, and operations. BGF Retail’s USD 0.13 billion Busan logistics center supports chilled and ready-to-eat product growth. CJ Olive Young uses AI for content integrity and campaign speed while scaling global sales through physical and digital channels. Regulatory oversight on MFN clauses, search rankings, and payment risk management is reshaping platform conduct and merchant economics in the South Korean retail market.
South Korea Retail Industry Leaders
-
Coupang Corp.
-
Naver Corp. (Naver Shopping)
-
SSG.COM
-
E-Mart Inc.
-
Lotte Shopping Co., Ltd.
- *Disclaimer: Major Players sorted in no particular order
Market Opportunities and Future Outlook
Omnichannel retailers and large offline groups have an opportunity to compete on last-mile time windows if Distribution Industry Development Act constraints on overnight online delivery are relaxed, a policy direction discussed publicly in February 2026. That would create operational whitespace for store-based grocers, SSMs, and hybrid operators to use local inventory for earlier cutoffs, denser delivery waves, and better utilization of existing footprints, narrowing the speed gap versus online-only players.
AI-enabled retail operations are also moving from pilots to deployments, which opens a practical runway across in-store service, merchandising, and demand planning. CJ Olive Youngs July 2026 rollout of AI-powered kiosks to support foreign shoppers with multi-language assistance and recommendations illustrates how physical retail can improve conversion and tourist-ready experiences without a proportional increase in labor. BGF Retails move in July 2026 to apply AI synthetic consumer modeling for CU product planning also signals a focus on back-end productivity gains. Separately, international expansion provides an additional growth lane for major retailers leveraging K-culture demand and established sourcing, evidenced by Lotte Marts July 2026 store opening in Tay Ninh, Vietnam and Shinsegae Department Stores July 2026 trial opening of an overseas Factory Store in Vientiane, Laos, which aligns off-price and grocery-specialty formats with value-conscious spending patterns.
Recent Industry Developments
- June 2026: E-Mart and Shinsegae moved to buy out the remaining 30% financial-investor stake in SSG.COM for KRW 1.27 trillion, lifting E-Marts ownership to 65.1%. The step consolidates governance around a core online subsidiary, supporting faster alignment on assortment, fulfillment investment, and omnichannel integration.
- May 2026: Naver invested an additional KRW 33 billion to raise its stake in Kurly to 6.2%, strengthening its position in online grocery. The deal deepens ties between a major traffic and payments platform and a specialized fresh-delivery operator, sharpening competitiveness in high-frequency food purchases.
- April 2026: Coupang disclosed USD 84 million invested in global AI technology startups since 2023, including Korea-based AI robotics company CMES and the SBVA Korea Sovereign AI Fund. The portfolio approach supports upstream capability building in automation and intelligent operations that can be applied across fulfillment, delivery, and customer experience.
Research Methodology Framework and Report Scope
Market Definition and Coverage
This market is defined as the value of consumer retail sales of goods in South Korea, captured across store-based outlets, online retail platforms, and omnichannel models where products reach households.
Scope exclusions: We exclude institutional wholesale trade, duty-free sales to in-transit travelers, and pure service categories such as food service.
Segmentation Overview
- By Retail Channel
- E-commerce / Online-only
- Omni-channel Retailers
- Hypermarkets & Supermarkets
- Department Stores
- Convenience Stores
- Discount & Variety Stores
- Traditional Markets
- Specialty Stores
- By Product Category
- Grocery & Food
- Fashion & Apparel
- Consumer Electronics
- Beauty & Personal Care
- Home & Living
- Health & Wellness
- Sports & Leisure Equipment
- By Payment Method
- Credit Cards
- Debit Cards
- Digital Wallets / Mobile Payments
- Buy-Now-Pay-Later
- Cash
- By Region
- Seoul Capital Area
- Chungcheong Region
- Gyeongsang Region
- Jeolla Region
- Gangwon Region
- Jeju Region
Data Sources, Market Sizing, and Validation
Desk Research
Desk work starts with building a clean fact base on how much retail is happening and where it is happening, and then we use that to set realistic guardrails for the model. Public sources, such as Statistics Korea (KOSTAT), the Bank of Korea, Korea Customs Service trade statistics, and OECD indicators, help confirm the direction of consumer spending, the effect of inflation, and import dependence for key categories. We also review guidance and publications from bodies such as the Korea Fair Trade Commission and relevant industry associations, since changes in retail regulation and payments can move value between channels.
After the public baseline is set, we add structured company information, such as annual reports, investor presentations, and other reputable business coverage, to understand format mix and pricing shifts. Where helpful, we also use paid subscriptions for company financials and intelligence, news and financials, and shipment-level trade views to cross-check large assumptions without relying on any single dataset. These desk research sources are illustrative only, and many other documents and data points were also used for data collection, clarification, and validation.
Primary Interviews and Surveys
Primary interviews and surveys are used to convert the desk findings into realistic market ratios, especially for channel split, category-level growth, and price movement that is not fully visible in public tables. We spoke with a mix of retailers, distributors, brand-side teams, and logistics and payments stakeholders across South Korea, and then we re-checked the same assumptions with different respondent roles so one view did not dominate the final model.
Distribution of primary research fieldwork respondents
| Company type | Respondent position |
|---|---|
| Top tier: 33% | CXOs: 18% |
| Mid tier: 49% | Functional/Unit leaders: 30% |
| Smaller Players: 18% | Managers: 52% |
Market-Sizing & Forecasting
For sizing, the model is built using both top-down and bottom-up checks, with the main structure coming from a top-down reconstruction of South Korea retail value using national retail sales and household consumption signals, which are then translated into channel-level totals. Once the full value pool is established, we corroborate it with selective bottom-up approximations, such as retailer format roll-ups, sampled sales per store where available, and volume and price checks for high-velocity categories, and then we adjust totals when the two views do not reconcile.
Key inputs in the model include consumer spending direction, retail sales growth by format, online share progression, inflation and exchange-rate timing for USD conversion, returns behavior for online-heavy categories, and format expansion signals (store count trends and space productivity ranges). When information gaps appear, they are handled through bounded assumptions that are anchored to primary feedback, followed by sensitivity checks so extreme outcomes are not carried into the final totals.
For forecasting, we use scenario analysis supported by a light multivariate view, where drivers like real consumption growth, price levels, and online penetration are projected and then applied to the channel mix. Forecast assumptions are aligned with what industry participants expect for promotions, pricing discipline, and fulfillment costs, which helps keep the trajectory realistic instead of purely trend-driven.
Data Validation & Update Cycle
Validation is done in steps, starting with internal consistency checks so channel totals, category shares, and growth rates do not contradict each other. We then compare outputs with independent signals, such as consumption indicators, major-format growth patterns, and trade and price movements, and any large variance triggers a deeper review of the underlying inputs. When a mismatch remains, respondents are re-contacted to confirm whether the change is real or driven by a temporary reporting effect.
Before sign-off, the model and narrative go through multi-step analyst review, with special attention on year-over-year jumps, currency conversion timing, and whether market drivers are aligned with the final numbers. Reports are refreshed annually, and interim updates are made when material events occur, followed by a fresh pre-delivery pass so clients receive the latest updated view.
Mordor Intelligence's South Korea Retail Market Size Compared Against Other Published Estimates
Different published numbers for South Korea retail can look confusing at first because each publisher tends to use a different definition of what retail includes, which year they anchor on, and how they treat online value and taxes. Currency conversion timing and whether returns are netted out can also change the final USD value even when the same local trend is being described.
Duty-free purchases by in-transit travelers sit outside Mordor Intelligence's scope, and some other estimates appear to blend this spending with domestic retail, which pushes their totals upward. The gap can also come from whether sales taxes are included, whether product returns are removed from online GMV, and whether the model is anchored to household consumption signals versus a looser roll-up of mixed retail and service spending, followed by different growth-case choices for online penetration.
Benchmark comparison
| Source | Market Size | Gaps in Research Methodology |
|---|---|---|
| Mordor Intelligence | USD 432.38 B (2025) | |
| Industry Marketplace A | USD 501.12 B (2024) | Uses an earlier base year and may apply a broader retail basket, with less clarity on whether duty-free, returns netting, and tax treatment are handled consistently across channels. |
| Global Consultancy B | USD 423.60 B (2024) | Anchors the value to a retail sector definition that can mix goods with some service-led retail activity, and the jump to forecast years is stated with a different start year which can shift implied growth. |
Taken together, the spread is mostly explained by scope alignment, year anchoring, and whether online value is treated as gross or net of returns, followed by tax and currency timing. By keeping the model tied to clear household-facing retail transactions and by checking the totals against independent demand signals, the sizing becomes easier to replicate and defend in planning discussions.
Key Questions Answered in the Report
What is the current size and growth outlook for the South Korea retail market?
The South Korea retail market size is USD 453.27 billion in 2026 and is projected to reach USD 573.83 billion by 2031 at a 4.83% CAGR.
Which retail channels are leading and growing fastest in South Korea?
E-commerce and online-only hold a 41.48% share in 2025, while omni-channel grocery is the fastest-growing with a 6.48% CAGR forecast to 2031.
Which categories are outperforming in the South Korea retail market?
Grocery and food led with 31.47% share in 2025, and beauty and personal care are the fastest-growing at a 5.82% CAGR through 2031.
How are payments shifting across South Korea retail?
Credit cards held a 52.49% share in 2025, mobile device-accessed card payments made up 53.8% of total card transaction value in H1 2025, and BNPL is the fastest-growing with a 7.29% CAGR from 2026 to 2031.
Which regions are most important for South Korea retail growth?
The Seoul Capital Area holds a 47.25% share in 2025, while Jeju is projected to grow fastest at a 6.74% CAGR to 2031.
How concentrated is competition in the South Korea retail market?
Platform concentration is high with the top two controlling over 46% of e-commerce GMV, but offline fragmentation keeps overall retail moderately concentrated.