
Market Overview
| Study Period | 2020 - 2031 |
|---|---|
| Market Size (2026) | USD 140.16 Billion |
| Market Size (2031) | USD 161.61 Billion |
| Growth Rate (2026 - 2031) | 2.89 % |
| Fastest Growing Market | Asia Pacific |
| Largest Market | Asia Pacific |
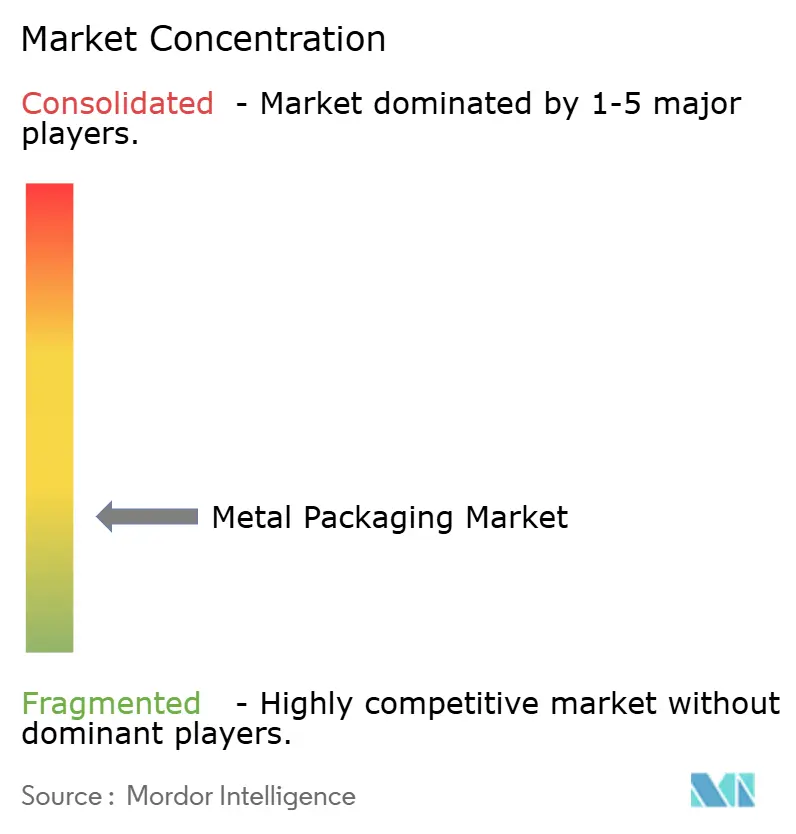
| Market Concentration | Low |
Major Players *Disclaimer: Major Players sorted in no particular order Image © Mordor Intelligence. Reuse requires attribution under CC BY 4.0. | |
Metal Packaging Market Analysis by Mordor Intelligence
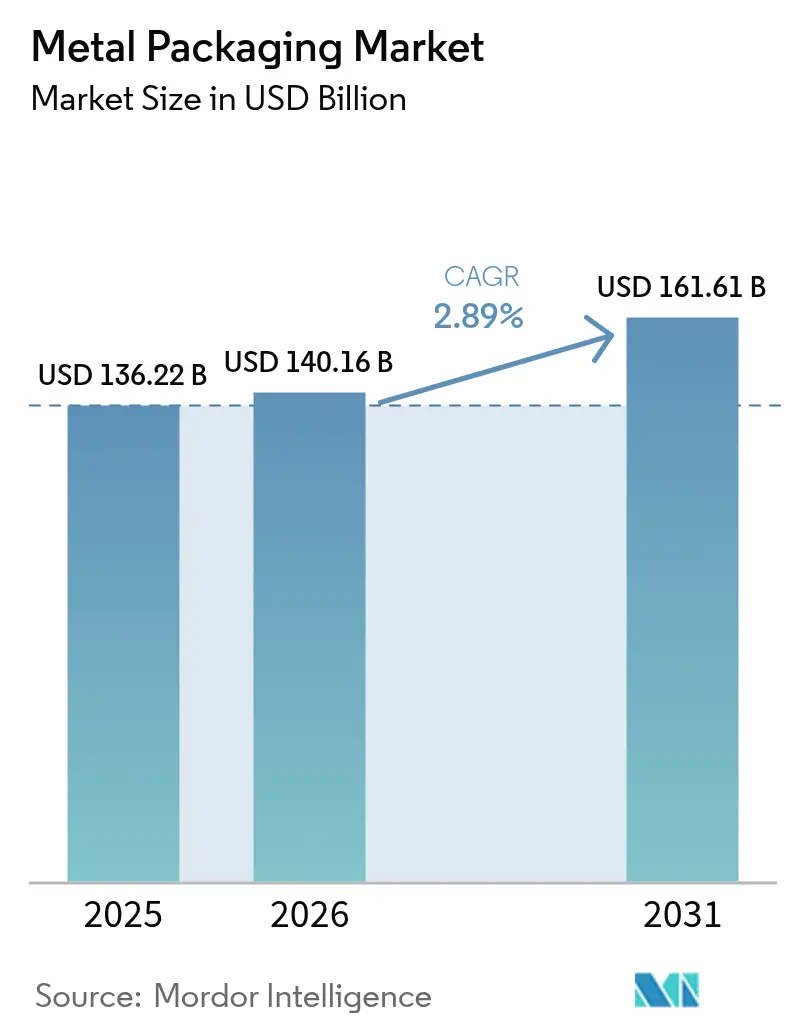
The metal packaging market size is expected to grow from USD 136.22 billion in 2025 to USD 140.16 billion in 2026 and is forecast to reach USD 161.61 billion by 2031 at 2.89% CAGR over 2026-2031. Steady growth stems from circular-economy legislation, premiumisation of ready-to-drink beverages, and retailers’ plastic-to-metal substitution pledges. Aluminium’s superior recycling economics, combined with material-lightweighting advances and brand-owner scope-3 reduction targets, reinforce the metal packaging market as the default option for carbonated and functional beverages. Producers continue to hedge aluminium and steel price swings through long-term contracts and scrap-based supply strategies, while coating suppliers accelerate the shift to BPA-free chemistries that underpin consumer safety narratives. Competitive intensity remains moderate as the leading canmakers deepen vertical integration across coating, recycling, and digital printing capabilities to defend share in a mature yet opportunity-rich landscape.
Key Report Takeaways
- By material type, aluminium led with 42.80% revenue share in 2025, and the segment is projected to expand at a 3.57% CAGR through 2031.
- By product type, cans captured 41.12% of the metal packaging market share in 2025 and are forecast to grow at a 6.08% CAGR to 2031.
- By end-user industry, beverages commanded a 34.86% share in 2025, while food applications are advancing at a 7.06% CAGR through 2031.
- By coating/lining type, BPA-based epoxy held 48.05% share in 2025; BPA-NI epoxy is the fastest-growing category at a 5.11% CAGR to 2031.
- By container capacity, 251-500 ml formats accounted for 58.12% share of the metal packaging market size in 2025 and led segment growth at a 6.14% CAGR through 2031.
- By geography, Asia-Pacific dominated with a 38.21% share in 2025 and is expanding at a 5.89% CAGR to 2031.
Note: Market size and forecast figures in this report are generated using Mordor Intelligence’s proprietary estimation framework, updated with the latest available data and insights as of 2026.
Market Trends and Insights
Drivers Impact Analysis of Metal Packaging Market*
| Driver | (~) % Impact on CAGR Forecast | Geographic Relevance | Impact Timeline |
|---|---|---|---|
| Circular-economy mandates boost can-to-can recycling loops | +0.8% | Global, with EU leadership and APAC adoption | Medium term (2-4 years) |
| Premiumisation of RTD beverages in emerging Asia | +0.6% | APAC core, spill-over to MEA | Short term (≤ 2 years) |
| Retailers' plastic-to-metal substitution pledges | +0.4% | North America & EU | Medium term (2-4 years) |
| High scrap recovery rates lower true cost vs. PET | +0.3% | Global | Long term (≥ 4 years) |
| In-can QR/NFC tech unlocking consumer-data monetisation | +0.2% | North America & EU, early adoption in APAC | Long term (≥ 4 years) |
| Expansion of e-commerce and DTC beverage retailing | +0.4% | Global, with APAC and Latin America strong adoption | Medium term (2-4 years) |
| Source: Mordor Intelligence | |||
Circular-Economy Mandates Boost Can-to-Can Recycling Loops
Tighter legislation is reshaping value-chain economics by mandating minimum recycled-content thresholds that aluminium cans already exceed, giving the metal packaging market a compliance edge. The EU’s PPWR requires 30% recycled material in beverage containers by 2030, yet aluminium cans average 71% recycled content.[1] Deposit-return schemes are driving collection rates toward 90% by 2029, supporting predictable scrap flows and reducing virgin-metal dependency. Global producers such as Ball target 85% recycled content, reinforcing closed-loop efficiencies that temper raw-material cost risk. Australia mirrors EU rules with an 80% post-consumer threshold for food-grade cans by 2040.[2]Sustained regulatory momentum cements aluminium’s moat over PET, particularly in beverages where procurement now factors circularity scores into supplier bids.
Premiumization of RTD Beverages in Emerging Asia
Surging demand for premium canned drinks is accelerating the metal packaging market growth in Asia-Pacific. Japan’s canned chuhai segment tripled in the United States between 2018 and 2023 as consumers seek low-calorie, low-alcohol options. Brands like Asahi’s Nama Jokki can demonstrate how packaging innovations replicate on-premise experiences in at-home settings. Rising disposable incomes in China and India push premium RTD coffee, kombucha, and functional meal-replacement beverages into mainstream retail, all of which rely on cans for flavor protection and thermal performance. The premiumisation wave enables manufacturers to pass higher material costs through to consumers, sustaining margins despite aluminium volatility.
Retailers’ Plastic-to-Metal Substitution Pledges
Large European and North American retailers are phasing out hard-to-recycle plastics in favor of infinitely recyclable metal formats to meet Extended Producer Responsibility rules. Metal’s 95% recyclability rate and established curbside collection systems align with retailer scorecards and unlock shelf-life advantages for canned food, soups, and pet nutrition products. Lightweight can designs and reclosable ends respond to convenience expectations while minimizing material intensity. These substitution programs create durable demand signals that guide canmakers’ capacity-planning decisions and bolster the overall metal packaging market outlook.
High Scrap Recovery Rates Lower True Cost vs. PET
Aluminium’s 96.7% closed-loop recyclability eclipses PET’s multi-cycle degradation, lowering true life-cycle costs for brands. In the United States, used beverage cans represent USD 1.6 billion in recoverable scrap value each year. Steel enjoys magnetic separation advantages, ensuring high collection effectiveness even in mixed-waste streams. The OECD estimates scrap steel will supply nearly half of global steel production by 2050, buffering price risk and improving sustainability metrics. These economics reinforce procurement preference for metal formats, particularly where end-of-life costs form part of total-cost-of-ownership calculations.
Restraints Impact Analysis of Metal Packaging Market*
| Restraint | (~) % Impact on CAGR Forecast | Geographic Relevance | Impact Timeline |
|---|---|---|---|
| Price volatility of LME aluminium and steel | -0.5% | Global | Short term (≤ 2 years) |
| Brand-owner push-back on scope-3 CO₂ footprint | -0.3% | North America & EU | Medium term (2-4 years) |
| Rise of mono-material paper bottles | -0.2% | EU and North America | Long term (≥ 4 years) |
| High production and operational costs of metal packaging | -0.2% | Global | Medium term (2-4 years) |
| Source: Mordor Intelligence | |||
Price Volatility of LME Aluminium and Steel
Energy-driven price swings strain margins because the metal packaging market still relies on contracts with pass-through clauses that lag spot fluctuations. North American tariffs add complexity, forcing producers to blend hedging tools with regional sourcing to protect competitiveness.[3]European smelters face persistent energy-cost pressure, contributing to global price turbulence. While large players offset volatility through scrap-based feedstocks and multi-year agreements, smaller converters remain exposed, which can slow capital investment cycles.
Brand-Owner Push-Back on Scope-3 CO₂ Footprint
Food and beverage multinationals increasingly scrutinize embedded carbon in packaging, prompting comparison against paper or bio-based alternatives. Metal’s high energy intensity during primary production inflates scope-3 tallies, challenging adoption unless recycling credits are fully recognized. Amcor’s decarbonization roadmap illustrates sector-wide commitments to renewable energy and recycled content, yet premium food products still record packaging-related emissions, accounting for more than 60% of total CO₂ in some life-cycle assessments.[4]Canmakers can answer through greener electricity sourcing and lightweighting, but ongoing brand-owner audits could redirect certain niche formats toward mono-material paper solutions.
*Our forecasts treat driver/restraint impacts as directional, not additive. The impact forecasts reflect baseline growth, mix effects, and variable interactions.
Metal Packaging Market Segment Analysis
By Material Type:
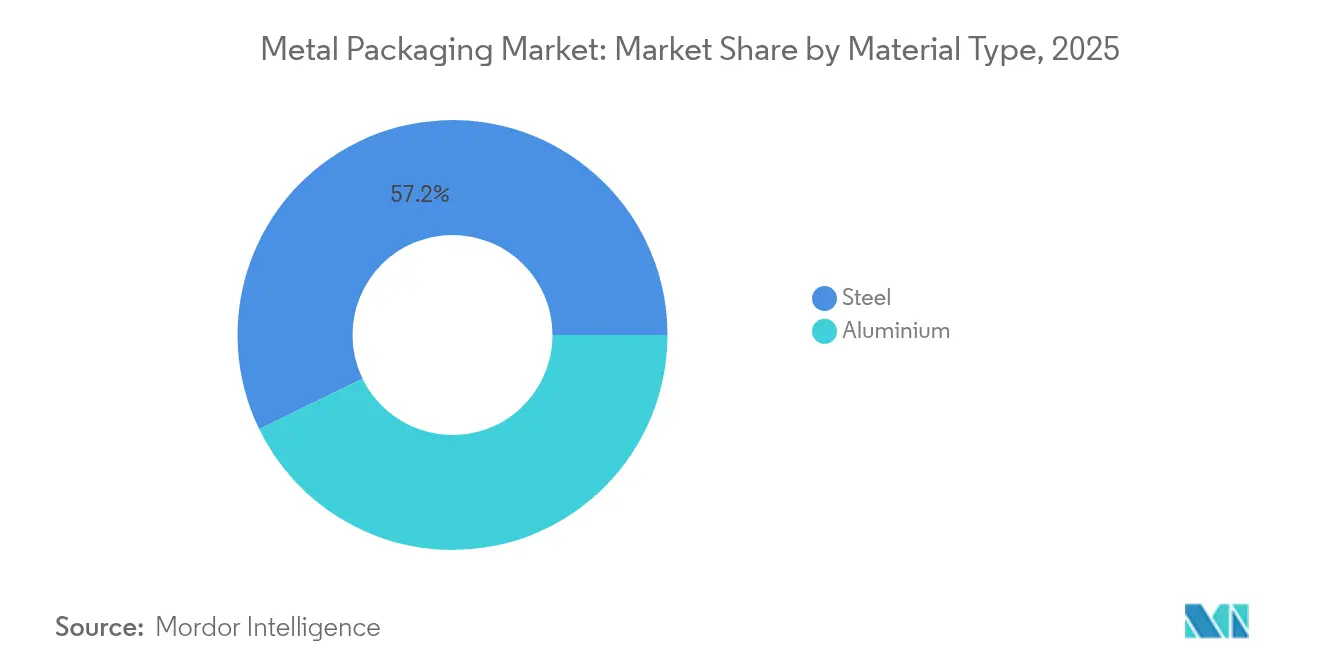
Aluminium Dominance Driven by Recycling EconomicsAluminium generated 42.80% of the metal packaging market share in 2025 and is projected to grow at a 3.57% CAGR through 2031, benefiting from closed-loop recycling systems that meet PPWR mandates. Steel maintains relevance in large-format food and industrial drums but grows more slowly due to weight and energy considerations. Novelis’s USD 90 million UK expansion to double can-recycling capacity underscores the material’s strategic importance. Aluminium’s light weight reduces logistics emissions, aligning with ESG scorecards and deepening customer loyalty among beverage brands. Market participants continue to invest in remelt technology, enabling the metal packaging market size associated with secondary aluminium to expand steadily.
Secondary aluminium pricing advantages help brands manage raw-material costs relative to virgin metal, mitigating procurement risk. Hindalco’s USD 10 billion capacity plan illustrates how integrated smelting and recycling hubs shorten supply chains and support aggressive recycled-content targets. Steel’s magnetic recoverability remains a plus in mixed-waste streams, yet higher container weight raises transport costs as carbon taxes spread. Altogether, aluminium’s cost, circularity, and weight advantages cement its leadership position, even as steel serves resilient niches that prioritize mechanical strength and puncture resistance.

By Product Type:
Cans Leverage Innovation and Convenience TrendsCans represented 41.12% of the metal packaging market in 2025 and are set to grow at a 6.08% CAGR, propelled by the premiumisation of RTD coffee, hard seltzer, and functional beverages across global convenience channels. Ball’s Dynamark Advanced Pro variable-graphics system personalizes cans at scale, allowing marketers to boost engagement and shelf appeal. Food cans hold a stable base, supplying high-barrier protection that underwrites global trade in tomato paste, soups, and pet food. Aerosol cans tap personal-care growth as pent-up post-pandemic demand lifts hair styling, deodorant, and household-cleaning categories in emerging markets.
Light-weighting initiatives reduce aluminium per unit without compromising integrity, helping contain costs and shrink scope-3 footprints. Caps, closures, and lug lids maintain niche relevance by providing tamper evidence and convenience. Bulk drums and intermediate steel containers retain popularity for agrochemicals and edible oils, where reusability and UN transport certifications are critical. Collectively, these dynamics guarantee that cans remain the metal packaging market’s flagship product while ancillary segments evolve through material science and design innovation.
By End-User Industry:
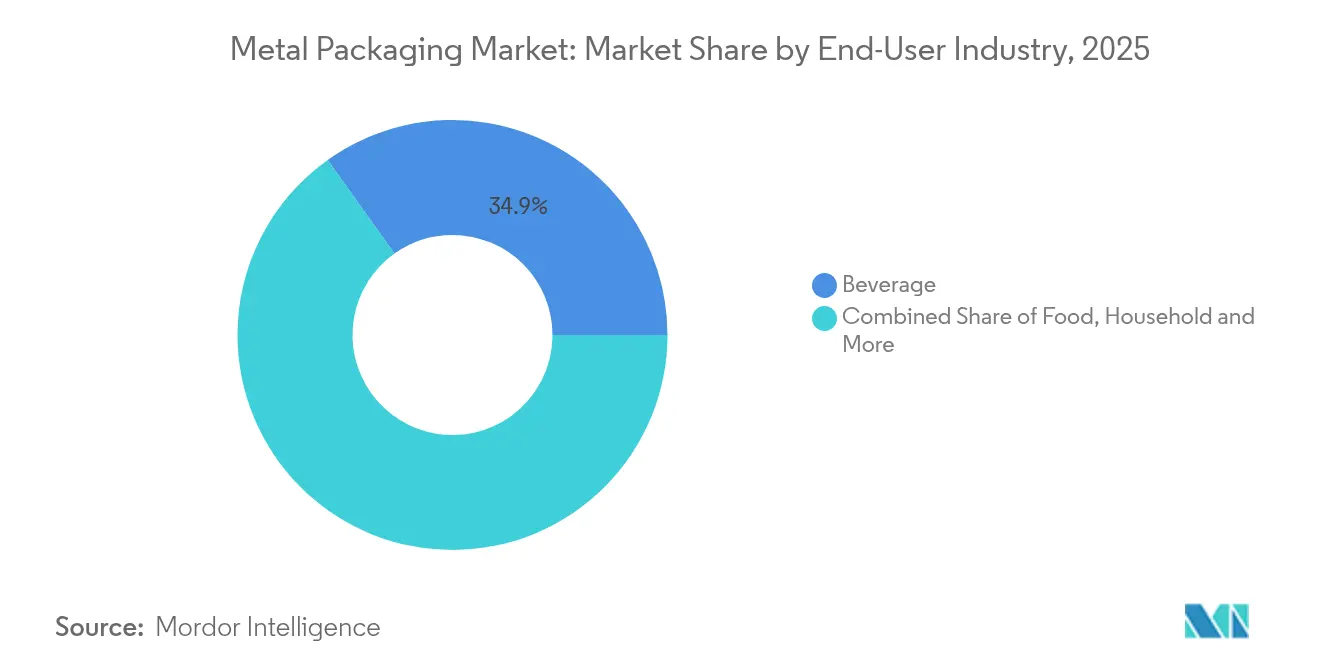
Food Growth Outpaces Beverage LeadershipBeverages accounted for 34.86% of the metal packaging market in 2025, underpinned by high-volume soft-drink and beer contracts that favor thin-gauge aluminium for carbonation strength. Yet the food category is expanding faster at a 7.06% CAGR on the back of shelf-stable ready meals, infant formula, and premium pet nutrition. Enhanced retort coatings extend flavor life without BPA, opening doors to organic and natural brands sensitive to additive profiles. Aerosol-based household cleaners and insecticides sustain steady volume growth in regions with rising hygiene awareness.
Functional drinks marketed as meal replacements stimulate additional demand for slim cans with nitrogen dosing to protect protein content, reinforcing cross-industry collaboration between fillers, canmakers, and coating suppliers. In cosmetics, metal tins and aerosol formats satisfy luxury positioning through tactile weight and superior recyclability. Despite the beverage segment’s size, the accelerating food-industry uptake signals diversification that broadens revenue streams and cushions category-specific volatility within the wider metal packaging market.
By Coating/Lining Type:
BPA-Free Transition Accelerates InnovationBPA-based epoxy still covers 48.05% of can interiors in 2025; however, BPA-NI alternatives post the highest growth at 5.11% CAGR as regulators tighten bisphenol limits. PPG’s Innovel series leads adoption, already protecting more than half of all US beverage cans. AkzoNobel’s Accelshield 300, free of bisphenols, PFAS, and formaldehyde, demonstrates how chemistries are decoupling from legacy toxicities while sustaining corrosion performance. Polyester, PET, and oleoresin variants broaden supplier choice and foster supply-chain resilience.
The transition spurs capital upgrades in coil-coating lines, with canmakers standardizing curing technologies that accommodate multiple resin families. Early adopters enjoy marketing leverage by touting chemical-safety credentials, offsetting the marginally higher coating cost through premium shelf pricing. Research into bio-based polymer blends aims to embed renewable content without compromising flavor integrity or retort resistance. As consumer watchdogs heighten scrutiny, progress toward universal BPA-free standards seems inevitable, reinforcing coating innovation as a competitive battleground within the metal packaging industry.
By Container Capacity:
Mid-Size Formats Capture Consumer PreferencesThe 251-500 ml band commanded 58.12% share of the metal packaging market size in 2025 and is expected to grow at 6.14% CAGR as health-conscious shoppers gravitate toward portion control. Slim 330 ml energy-drink cans and 355 ml hard seltzers epitomize the sweet spot between refreshment and calorie moderation. Less than 250 ml formats serve premium spirits, espresso-style coffees, and clinical-nutrition shots, winning shelf space through convenience and indulgent positioning. Larger 501-1000 ml sizes cater to craft beer sharers and family-size soft drinks that seek fridge efficiency.
Format decisions interlink with deposit fees and recycling habits; mid-size cans strike a balance between high perceived value and affordable return-scheme deposits. Lightweighting advances allow canmakers to approach 10 g can bodies without sacrificing stack strength, trimming emissions embedded in transport. Although 1 L steel food cans persist for tomatoes and beans, growth concentrates in moderate volumes ideal for e-commerce parcel dimensions. Capacity segmentation thus maps neatly onto demographic shifts and evolving beverage routines that sustain broader metal packaging market expansion.
Geography Analysis
APAC Metal Packaging Market
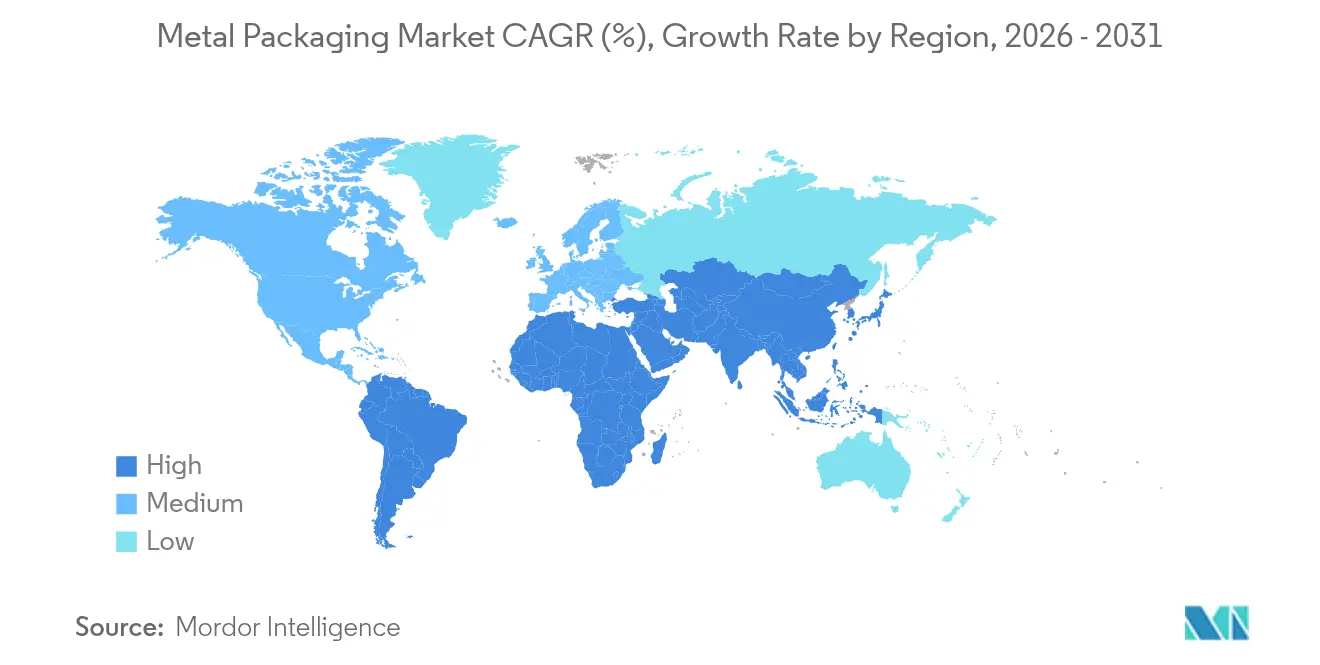
Asia-Pacific held 38.21% of the metal packaging market in 2025 and is tracking a 5.89% CAGR through 2031, anchored by China’s burgeoning RTD sector and India’s rising middle class. Localised can-sheet supply, combined with Hindalco’s multi-billion-dollar smelter-plus-recycling build-out, underpins cost leadership and circular credentials that appeal to global brand owners. Japan contributes design leadership, exporting high-quality chuhai formats that influence regional adoption patterns, while Southeast Asian nations leverage tourism-driven beverage demand and emerging deposit-return pilots.
North America Metal Packaging Market
North America represents a mature arena where domestic can lines run near full utilisation, cushioned by long-term supply contracts with major beer and soft-drink fillers. Tariff regimes compel canmakers to source metal domestically, spurring investment in scrap-based billet facilities and warehouse automation to drive down per-unit costs. Widespread state-level bottle bills keep aluminium recovery rates above 60%, bolstering feedstock security for secondary production.
Europe and South America Metal Packaging Market
Europe combines rigorous PPWR requirements with sophisticated recycling networks, making it a crucible for coating innovations and digital watermark pilots. Crown’s scalable plants in Spain and Italy recently added high-speed lines to serve craft-beer exporters, evidencing sustained opportunity even within a saturated market. South America, spearheaded by Brazil, exhibits strong volume growth as beer brand owners convert to cans for premium positioning and logistics efficiency.
MEA Metal Packaging Market
The Middle East and Africa trail on infrastructure, yet population expansion and rising incomes provide greenfield prospects for aerosol deodorant and canned-food penetration, ensuring region-wide growth contributions to the global metal packaging market.
Regulatory Landscape
Regulation in metal packaging is tightening around recyclability, packaging minimization, and food-contact safety, with the EU setting the pace on circular-economy compliance. The Packaging and Packaging Waste Regulation, Regulation (EU) 2025/40, entered into force on 11 February 2025 and generally applies from 12 August 2026. It introduces enforceable requirements on packaging design, weight minimization, and recyclability performance, with manufacturing and source-reduction referenced to harmonized standard EN 13428:2004. These rules strengthen the compliance advantage of established can-to-can recycling systems and lift the bar for lightweighting and design-for-recycling across beverage and food cans.
In the United States, the regulatory focus remains centered on food-contact authorization and ongoing administrative controls over substances used in metal packaging. FDA requirements mean food contact substances, including can coatings and related chemistries, must be authorized as food additives or via the Food Contact Notification (FCN) pathway prior to market use. FDA also updates the inventory of effective FCNs, including a 6 January 2025 Federal Register action with a 30 June 2025 compliance date for certain substances determined no longer effective. Manufacturing inputs used on metallic food-contact articles are further governed by specific provisions such as 21 CFR 178.3910, which sets residual limits for surface lubricants used in producing metallic articles that contact food.
Competitive Landscape
The top three canmakers, Crown Holdings, Ball Corporation, and Ardagh Metal Packaging, operate global networks that secure multiyear beverage contracts and technology leadership. Crown Holding’s Q1 2025 segment income rose 29% to USD 398 million, buoyed by robust beer-can demand in Brazil and Europe. Vertical integration into coating R&D, recycled-aluminium sourcing, and laser-etched QR coding helps incumbents defend margins and deepen customer lock-in across the metal packaging market.
Innovation is the prime competitive lever. Ball’s Dynamark platform shortens design-to-shelf cycles, empowering beverage marketers to run limited editions without inventory risk. Ardagh broadens sustainable offerings through high-recycled-content steel food cans, while Silgan invests in specialty dispensing closures after acquiring Weener Plastics to complement aerosol and lug-lid lines. Mid-tier challengers emphasise agility, focusing on specialty formats such as nitrogen-dosable coffee cans or decorative tins for cosmetics.
Mauser Packaging’s acquisition of Consolidated Container and Sonoco’s purchase of Eviosys widen geographic reach and product breadth. Continuous investment in capacity, digital traceability, and green power procurement will define future outperformance. Although scope-3 scrutiny elevates risk for high-emission producers, leading players’ commitments to 100% renewable electricity and higher recycled-content ratios fortify their long-term licence to operate in the evolving metal packaging industry.
Metal Packaging Industry Leaders
-
Ardagh Metal Packaging SA (Ardagh Group SA)
-
Ball Corporation
-
Crown Holdings, Inc.
-
Can-Pack S.A.
-
Silgan Holdings Inc.
- *Disclaimer: Major Players sorted in no particular order
Metal Packaging Market Companies Covered in this Report
- Ardagh Metal Packaging S.A.
- Ball Corporation
- Crown Holdings Inc.
- CANPACK S.A.
- Silgan Holdings Inc.
- Greif Inc.
- TUBEX Packaging GmbH
- Mauser Packaging Solutions
- Nampak Limited
- Colep Packaging
- CPMC Holdings Ltd.
- Toyo Seikan Group Holdings
- Amcor plc (Metal division)
- AptarGroup Inc.
- Alcoa Corporation
- Sherwin-Williams (Can Coatings)
- Novelis Inc.
- Hindalco Industries Ltd.
- RPC Group plc
- BWAY Corporation
- Berlin Packaging
Market Opportunities and Future Outlook
The most visible opportunity set is linked to compliance-driven format shifts and capacity build-outs in fast-growing beverage markets, particularly where premium RTD demand and recycling economics favor cans. In India, capacity announcements point to whitespace for modern high-speed can lines. Crown Holdings announced plans for a two-line aluminum beverage can facility in Northern India (2.2 billion cans annual capacity, targeted operational in the second half of 2027), while AGI Greenpac commenced construction of an aluminum beverage can plant in Hathras, Uttar Pradesh (targeting 1.6 billion cans annually by the first half of 2027). These investments reflect active localization of can supply to reduce freight, improve service levels for fillers, and secure regional can-sheet and end supply chains.
A second opportunity cluster centers on decarbonization and chemistry transitions in steel and aluminum packaging inputs, which support demand for upgraded substrates and coatings that help brand owners manage scope-3 scrutiny while meeting tighter chemical expectations. In Europe, Henkel transitioned tinplate cans for adhesive products to bluemint steel, citing a 62% CO2 reduction versus conventional tinplate, and Tata Steel Nederland commissioned a packaging steel line using Trivalent Chromium Coating Technology (TCCT), positioning a pathway away from legacy surface treatments while simplifying downstream canmaking. On circularity, Novelis extended a long-term partnership with Infinitum to supply post-consumer aluminum beverage cans from Norway to its Latchford, UK recycling plant, reinforcing cross-border scrap and recycled-metal flows that support the EU PPWR application from 12 August 2026. Industry bodies such as Metal Packaging Europe have also pushed for harmonized EPR requirements and eco-modulation under evolving EU circular-economy policy, indicating continued policy-linked differentiation between materials and a greater need to document recyclability performance and recycled-content strategies.
Recent Industry Developments in Metal Packaging Market
- June 2026: Crown Holdings published its 2025 Sustainability Report, Delivering Sustainability, outlining progress toward its 2030 goals. The disclosure reinforces the role of verified sustainability programs in winning long-term beverage and food can supply contracts where customers increasingly request recycled-content and emissions reporting.
- December 2025: Ball Corporation announced definitive agreements to acquire an 80% majority stake in Benepack, adding beverage can manufacturing facilities in Belgium and Hungary. The deal expands Ball’s European footprint and strengthens proximity-to-filler supply in a region shaped by packaging waste and recyclability requirements.
- July 2024: Silgan reached an agreement to acquire Weener Plastics for EUR 838 million (USD 912 million), expanding its dispensing and specialty-closures capabilities alongside its metal container franchise. The move supports broader packaging system offerings for household and personal care customers that use metal formats such as aerosols and tins.
Metal Packaging Market Report Scope and Research Methodology
Market Definition and Coverage
For this methodology, the metal packaging market is counted as the value of metal-based packs sold into end users, covering steel and aluminum formats used to contain, protect, and transport products across consumer and industrial uses.
Scope exclusions: We exclude non-metal primary packaging made only from plastic, paperboard, or glass, and we also exclude the value of the packaged product inside the container.
Segments Covered in This Report
- By Material Type
- Aluminium
- Steel
- By Product Type
- Cans
- Food Cans
- Beverage Cans
- Aerosol Cans
- Bulk Containers
- Shipping Barrels and Drums
- Caps and Closures
- Cans
- By End-user Industry
- Beverage
- Food
- Cosmetics and Personal Care
- Household
- Other End-user Industry
- By Coating / Lining Type
- BPA-Based Epoxy
- BPA-NI Epoxy
- Polyester / PET
- Other Coating / Lining Type
- By Container Capacity
- Less than 250 ml
- 251 – 500 ml
- 501 – 1000 ml
- More than 1000 ml
- By Geography
- North America
- United States
- Canada
- Mexico
- Europe
- Germany
- United Kingdom
- France
- Italy
- Spain
- Russia
- Rest of Europe
- Asia-Pacific
- China
- India
- Japan
- South Korea
- Australia and New Zealand
- Rest of Asia-Pacific
- Middle East and Africa
- Middle East
- United Arab Emirates
- Saudi Arabia
- Turkey
- Rest of Middle East
- Africa
- South Africa
- Nigeria
- Egypt
- Rest of Africa
- Middle East
- South America
- Brazil
- Argentina
- Rest of South America
- North America
Data Sources, Market Sizing, and Validation
Desk Research
Desk research was used to set the basic shape of the market and to build a fact base that could be checked in interviews. We leaned on public sources such as the United States Geological Survey (USGS), the United Nations Comtrade database, the World Steel Association, the International Aluminium Institute, and the US EPA for recycling and waste indicators, which help anchor metal availability, trade flows, and end-of-life recovery.
We also reviewed company annual reports and filings, investor presentations, packaging association websites, and credible business press for capacity additions, utilization commentary, and pricing direction. Where needed, we referred to paid subscriptions for company financials and intelligence, patent databases, and shipment-level import and export records to clarify supplier footprints and trade-linked demand signals. The desk sources mentioned here are illustrative only, and additional public and paid references were used for data collection, validation, and research clarification.
Primary Interviews and Surveys
Primary work focused on validating what drives value in metal packaging, especially how volumes shift by end use and how average selling prices move with metal input costs, lightweighting, and mix changes across cans, closures, and bulk packs. We spoke with packaging producers, raw material and coating participants, converters, and large buyers across APAC, EMEA, and the Americas, so gaps from desk findings could be closed and assumptions could be confirmed using plain-language explanations tied back to their operating experience.
Distribution of primary research fieldwork respondents
| Company type | Respondent position | Region |
|---|---|---|
| Top tier: 26% | CXOs: 13% | APAC: 51% |
| Mid tier: 53% | Functional/Unit leaders: 43% | EMEA: 30% |
| Smaller Players: 21% | Managers: 44% | Americas: 19% |
Market-Sizing & Forecasting
Sizing started with a top-down build where metal packaging demand was reconstructed from end-use output signals and packaging intensity, and then converted into value using observed price and mix patterns. In practice, the model is sensitive to a few repeatable inputs such as beverage can fill volumes, food canning and processed food output, aerosol usage trends, industrial pail and drum demand tied to chemicals and coatings activity, and recycling and can-sheet supply signals that influence availability.
Those totals were then checked with selective bottom-up approximations, including sampled supplier revenue splits, region-level capacity context, and channel discussions on typical pricing moves. We adjusted the model when the inputs did not reconcile to the expected value outcome. For forecasting, scenario analysis was used around metal price pass-through and end-use growth, then smoothed with time-series techniques so year-to-year steps stayed realistic. When bottom-up datapoints were missing for smaller formats or smaller countries, we used ratio-based proxies linked to end-use output and trade exposure, and then re-tested those proxies in interviews.
Data Validation & Update Cycle
Validation is done in layers so the final values do not depend on any single assumption. Model outputs are compared against independent signals such as regional can and steel or aluminum packaging production trends, trade movements for relevant product groups, and recycling rates, and then any outliers are reviewed by another analyst before sign-off.
If a large variance shows up, respondents are re-contacted and the assumption is rewritten in a way that can be traced back to a clear driver, not just an average. Reports are refreshed annually, and interim updates are made when material events occur, such as sharp metal price shifts, major capacity expansions, or regulatory changes affecting coatings and recycling. Before delivery, a final pass is completed so clients receive a current view consistent with the latest available data.
Mordor Intelligence's Metal Packaging Market Estimate Compared With Other Published Estimates
It is normal to see different market sizes for metal packaging because studies do not always use the same year, the same currency timing, or the same pricing logic to translate metal packs from volume into value. The spread can also widen when one estimate includes adjacent packaging categories or uses different rules for coatings, closures, and bulk containers.
A refresh-led difference is common in this market because metal input costs can move quickly and price pass-through is rarely uniform across food cans, beverage cans, and industrial packs, which changes average selling price assumptions more than many users expect. When exchange rates are taken at different points in the year, and when price updates are applied with different lags, the value total can land higher or lower. That is why contract-linked ASP steps and re-contacts with buyers and converters are used before finalizing totals, including by Mordor Intelligence.
Benchmark comparison
| Source | Market Size | Gaps in Research Methodology |
|---|---|---|
| Mordor Intelligence | USD 140.16 B (2026) | |
| Global Consultancy A | USD 148.13 B (2024) | Uses a different base year and may apply earlier-year metal price and currency averages, which can lift value when price pass-through timing is assumed to be faster across major pack formats. |
| Industry Publisher B | USD 136.00 B (2026) | Often uses more conservative pass-through and mix assumptions for closures and industrial packs, and this can lower implied average selling prices even when volumes are similar. |
Overall, the gap across publishers is mainly explained by timing choices for currency and pricing, and by how quickly pass-through is assumed to show up in packaging ASPs across end uses. By keeping the scope tied to metal packs and by pressure-testing pricing with practical checks, the final number stays traceable to clear inputs and repeatable steps.
Key Questions Answered in the Report
What is the projected value of the metal packaging market in 2031?
The sector is forecast to reach USD 161.61 billion by 2031, up from USD 140.16 billion in 2026.
Which region is expanding fastest in the metal packaging market?
Asia-Pacific leads with a 5.89% CAGR through 2031, driven by rising RTD beverage consumption and premiumisation trends.
Why is aluminium preferred over PET in beverage cans?
Aluminium offers 96.7% closed-loop recyclability, strong barrier performance, and lower true life-cycle cost once scrap value is considered.
How are coating technologies changing inside metal cans?
Manufacturers are moving from BPA-based epoxies to BPA-NI and polyester systems like PPG’s Innovel and AkzoNobel’s Accelshield 300 to meet safety and regulatory demands.
What is the main risk factor for canmakers’ profitability?
Volatility in LME aluminium and steel prices can squeeze margins, prompting hedging strategies and long-term supply agreements.
Which product type dominates the metal packaging market?
Beverage cans hold 41.12% share and continue to grow on the back of convenience, sustainability credentials, and advanced printing innovations.