
Market Overview
| Study Period | 2021 - 2031 |
|---|---|
| Market Volume (2026) | 2.78 Million tons |
| Market Volume (2031) | 6.18 Million tons |
| Growth Rate (2026 - 2031) | 17.33% CAGR |
| Fastest Growing Market | Asia Pacific |
| Largest Market | Asia Pacific |
| Market Concentration | Medium |
Major Players *Disclaimer: Major Players sorted in no particular order Image © Mordor Intelligence. Reuse requires attribution under CC BY 4.0. | |
Bioplastics Market Analysis by Mordor Intelligence
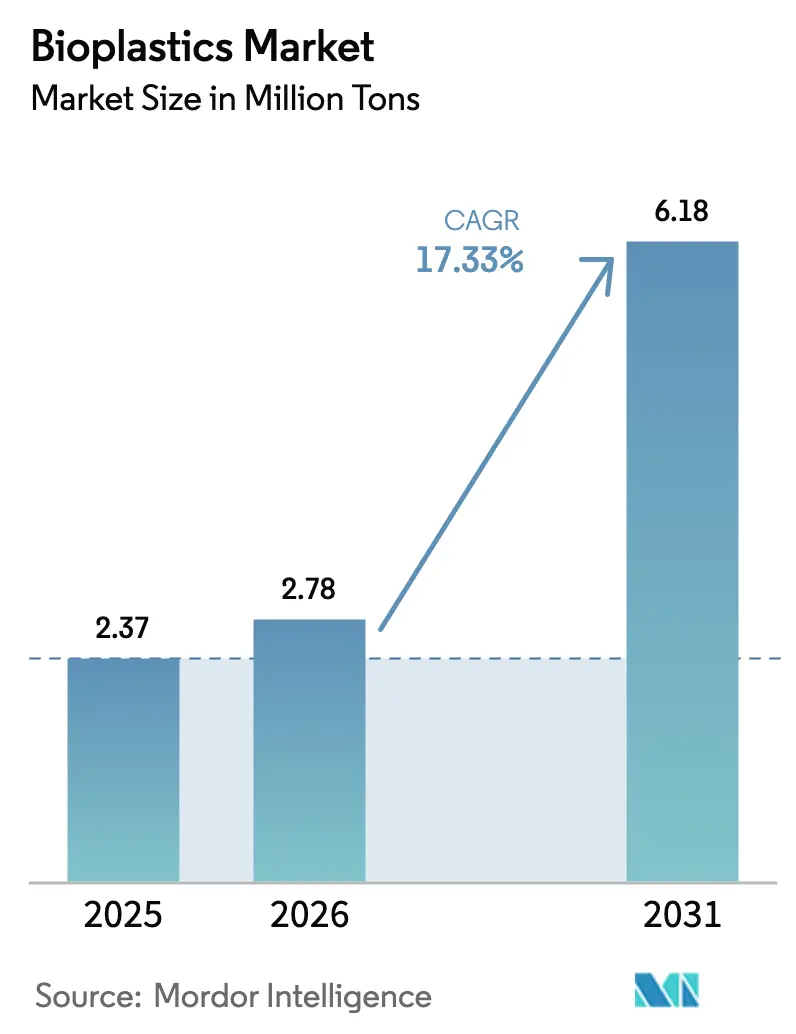
The Bioplastics Market size is expected to increase from 2.37 Million tons in 2025 to 2.78 Million tons in 2026 and reach 6.18 Million tons by 2031, growing at a CAGR of 17.33% over 2026-2031. This growth stems from single-use-plastic bans in Europe and Asia, corporate net-zero targets that filter through supplier scorecards, and the rapid alignment of renewable-feedstock supply chains in Brazil, India, and Thailand. Capital spending is migrating toward Asia-Pacific, where tax holidays and land-lease incentives compress payback periods for new PLA and PHA lines. At the same time, North American and European innovators continue to file patents around heat-resistant PLA alloys and enzymatic recycling catalysts that promise to lower total lifecycle emissions versus drop-in bio-PET. Price volatility remains the central risk because bioplastic resins command a 20%–40% premium over fossil LDPE when Brent crude trades below USD 80 per barrel, a level seen intermittently in 2024 and early 2025. These structural forces combine to accelerate capacity additions while exposing margin to crude oil downside.
Key Report Takeaways
- By polymer class, bio-based non-biodegradables captured 56.64% of the bioplastics market share in 2025, whereas bio-based biodegradables led growth at a 23.46% CAGR.
- By feedstock, sugarcane and sugar-beet inputs supplied 42.28% of global resin volumes in 2025; cellulosic and wood-waste streams are expanding at a 24.59% CAGR.
- By processing technology, extrusion held 46.94% of 2025 volumes, while 3D printing represents the fastest-growing route with a 22.88% CAGR to 2031.
- By application, flexible packaging commanded 26.65% of 2025 demand and is scaling at a 24.69% CAGR through 2031.
- By region, Asia-Pacific accounted for 47.75% of 2025 volumes and is projected to grow at a 22.51% CAGR, outpacing all other geographies.
Note: Market size and forecast figures in this report are generated using Mordor Intelligence’s proprietary estimation framework, updated with the latest available data and insights as of January 2026.
Global Bioplastics Market Trends and Insights
Drivers Impact Analysis*
| Drivers | (~) % Impact on CAGR Forecast | Geographic Relevance | Impact Timeline |
|---|---|---|---|
| Single-use-plastic bans in Europe and Asia | +3.8% | Europe, India, Southeast Asia | Short term (≤ 2 years) |
| Demand for sustainable packaging | +4.2% | Global, concentrated in North America and EU | Medium term (2-4 years) |
| Corporate net-zero polymer procurement | +3.5% | Global, led by multinational CPG brands | Medium term (2-4 years) |
| Recycling-compatibility incentives | +2.1% | Europe, Japan, South Korea | Long term (≥ 4 years) |
| Availability of renewable feedstock | +2.9% | Brazil, India, Thailand, United States | Medium term (2-4 years) |
| Source: Mordor Intelligence | |||
Mandate for Single-Use-Plastic Bans in Europe and Asia
Regulatory prohibitions on polystyrene foam, Oxo-degradable bags, and polyethylene straws have removed roughly 1.2 million tons of petro-plastic demand since 2021, creating an immediate pull for certified-compostable alternatives. European Commission guidance issued in July 2024 further tightened definitions by linking exemptions to EN 13432, which sidelined oxo-additive packaging and accelerated PLA penetration into food-service ware. In India, the Central Pollution Control Board used spot audits throughout 2024 to seize non-compliant inventory valued at INR 500 million, prompting converters to lock in multi-year PLA and starch-blend contracts[1]Central Pollution Control Board, “Annual Compliance Report 2024,” cpcb.nic.in. Thailand’s January 2025 roadmap extended the mandate to hotels and quick-service restaurants, requiring 40% compostable share by 2027 and thus derisking new domestic capacity. Because enforcement carries financial penalties and brand-owner liability, offtake contracts now underpin capital spending decisions for greenfield plants from Hainan to Gujarat.
Surging Demand for Sustainable Packaging and Eco-Friendly Plastics
Consumer-packaged-goods leaders collectively pledged to displace 8.5 million tons of virgin plastic by 2030, yet 82% of that requirement remained uncontracted as of mid-2025. This procurement gap has fueled RFPs for both drop-in bio-PE and next-generation PLA alloys. Unilever lifted its bio-PE intake to 47,000 tons in 2024—up 22% year over year—and targets a three-fold increase by 2027. Nestlé Waters piloted full-PLA bottles in France that cut cradle-to-gate emissions by 35% versus rPET, though heat-distortion above 55 °C restricted sales to refrigerated channels. Danone’s March 2025 collaboration with NatureWorks aims to push PLA’s heat-deflection ceiling to 70 °C, unlocking ambient yogurt cups in Southern Europe. The takeaway is clear: brands are segmenting procurement between drop-ins for rigid formats and biodegradable alloys for flexible films, each pathway minimizing disruption to existing lines while meeting diverging regulatory tests.
Corporate Net-Zero Procurement of Low-Carbon Polymers
Scope 3 accounting now makes resin selection a direct lever in hitting Science Based Targets, forcing suppliers to disclose cradle-to-gate emissions through ISO 14044-verified LCAs. BASF allocated 320,000 tons of biomass-balance credits across its polymer slate in 2024, up 78% in two years[2]BASF, “Sustainability Report 2024,” basf.com . TotalEnergies Corbion posts a 0.5 kg CO₂-equivalent footprint for its PLA, roughly 75% below fossil PET, positioning it for premium tenders in food and medical packaging. Braskem’s sugar-based bio-PE achieves a –3.09 kg CO₂ balance per kg of polymer, a claim that Procter & Gamble cites in climate disclosures. Chain-of-custody certification has therefore become a ticket-to-trade: producers lacking ISCC PLUS or RSB audits rarely advance beyond pre-qualification.
Advanced Mechanical-Recycling Compatibility Incentives
Eco-modulated fees under France’s CITEO reduce levies by EUR 100 per ton for bio-PE bottles that behave like fossil analogs in optical sorters, whereas PLA still faces a EUR 50 surcharge. Germany’s ZSVR guidance from September 2024 offers minimum-recycled-content credits exclusively for bio-PE, bio-PET, and bio-PA, sidelining many biodegradable grades. Japan’s April 2025 subsidy funds enzymatic depolymerization retrofits so PLA can join PET loops, signaling a shift toward chemical recycling that could eventually close the infrastructure gap. In the interim, bio-based drop-ins enjoy a compliance tailwind wherever mature recycling streams exist.
Restraints Impact Analysis*
| Restraints | (~) % Impact on CAGR Forecast | Geographic Relevance | Impact Timeline |
|---|---|---|---|
| Price premium vs. petro-plastics with low oil prices | –2.7% | Global, acute in price-sensitive segments | Short term (≤ 2 years) |
| Heat-resistance and barrier gaps in PLA grades | –1.4% | North America, Europe | Medium term (2-4 years) |
| Limited industrial-composting infrastructure penalties | –1.6% | Asia-Pacific, Latin America | Long term (≥ 4 years) |
| Source: Mordor Intelligence | |||
Price Premium vs. Petro-Plastics Amid Low Oil Prices
PLA traded between USD 2,200 and USD 3,800 per ton in 2024-2025, roughly double virgin LDPE when Brent averaged USD 75 per barrel. Without carbon levies or mandated compostability, converters in India and Southeast Asia confront up to a 60% cost penalty for switching from PP to PLA in takeaway containers. Braskem’s bio-PE premium widened from USD 300 to USD 450 per ton in early 2025 as ethanol prices spiked 12% on Brazilian drought. Sustained crude weakness therefore threatens all but policy-driven demand, forcing most producers to hedge margins through long-term offtake deals indexed to sugar rather than oil.
Heat-Resistance and Barrier-Property Gaps in PLA Grades
Standard PLA softens at 55 °C–60 °C, barring use in hot-fill drinks or microwaveable trays. NatureWorks’ Ingeo 3D870 boosts heat-deflection to 100 °C but adds a 25% resin premium and lengthens cycle times by 15 seconds. Danimer’s Nodax PHA maintains flexibility across –40 °C to +60 °C yet displays oxygen-transmission rates three to five times higher than oriented PP, requiring multilayer laminates that complicate composting. BASF’s Ecovio blends close water-vapor gaps but dilutes renewable content because PBAT remains fossil-derived. Qualification, therefore, proceeds slowly, especially in applications that integrate mechanical and barrier demands into a single wall.
*Our forecasts treat driver/restraint impacts as directional, not additive. The impact forecasts reflect baseline growth, mix effects, and variable interactions.
Segment Analysis
By Type: Bio-based non-biodegradable Polymers Dominate, Biodegradables Accelerate
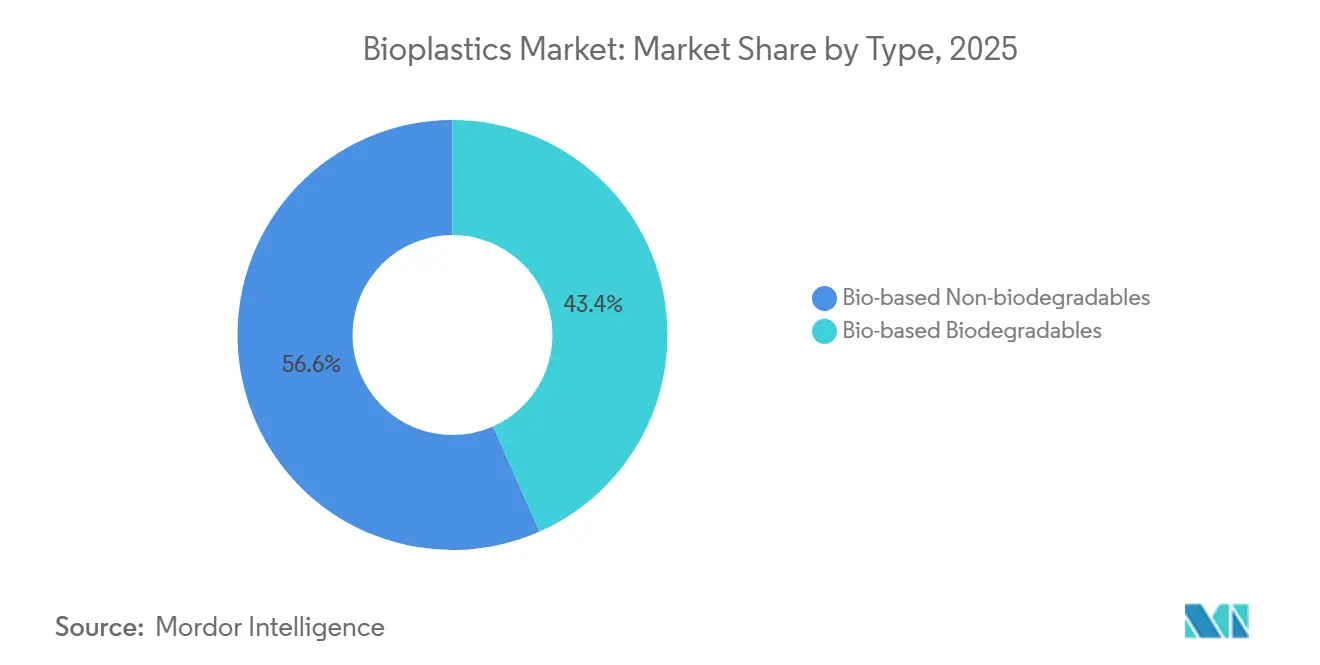
The bio-based non-biodegradable class held a 56.64% bioplastics market share in 2025 because bio-PET and bio-PE run on legacy facilities, preserve bottle-grade clarity, and fit established recycling loops. Coca-Cola shipped its 90 billionth PlantBottle in 2024, validating the scale advantage of partial bio-content that keeps PET bale purity intact. The biodegradables family, led by PLA and starch blends, is growing at 23.46% and will erode share as landfill-diversion mandates spread from Europe to South America. PLA already dominates transparent clamshells for North American produce, while starch-PBAT combinations own grocery bags across Southeast Asia, aided by cassava-based masterbatches priced 15% below corn counterparts. PHA’s marine-biodegradable profile tackles use-cases where litter risk is acute, such as fishing gear; Bacardi’s adoption for bottle caps demonstrates how niche applications can scale once performance meets brand aesthetics. Bio-PA remains a performance polymer for fuel-lines and textile fibers, its high margin insulating producers from crude swings. Overall, the segment profile signals that drop-ins will retain large-volume packaging accounts while biodegradables penetrate regulated niches, driving differentiated capacity deployment through 2031.


By Feedstock: Sugarcane Leads, Cellulosics Surge
Sugarcane and sugar-beet streams supplied 42.28% of total volume in 2025, anchoring cost curves because Brazilian mills bundle bagasse cogeneration credits and ethanol hedges to stabilize input margins. Corn-based dextrose feeds NatureWorks’ 150 ktpa Blair, Nebraska, PLA unit, yet price volatility and land-use scrutiny are pushing producers toward residue-based sugars. Cellulosic pathways will expand at a 24.59% CAGR, spearheaded by pulp mills that sell lignocellulosic syrup into Avantium’s polyethylene furanoate pilot line, which touts a 50% oxygen-barrier gain over PET. Cassava starch underwrites Thailand’s thermoplastic bag grades, exploiting local agronomy and BOI tax holidays that cut break-even time to six years. Algae and microbial oils attracted USD 180 million in venture funding during 2024-2025 and now supply RWDC’s Solon PHA at 20% below prevailing PHA index prices. Feedstock diversification, therefore, limits commodity risk and aligns with deforestation-free procurement pledges issued by major FMCG companies.
By Processing Technology: Extrusion Anchors Volume, 3D Printing Scales
Extrusion accounted for 46.94% of throughput in 2025 because film and sheet lines serve both flexible packaging and agricultural mulch. Screw-temperature profiles for PLA require colder zones and faster chill-roll speeds, yet upgrade costs remain modest relative to barrier-coextrusion investments. Injection molding ranks second as mobile-phone cases, consumer electronics, and rigid foodware adopt bio-PA and high-heat PLA, though mold-cool delays can extend cycle times by one-quarter. Blow-molding embraces bio-PET and bio-PE since they stretch-blow like fossil analogs; line-rate parity minimizes the capex required to meet recycled-content taxes in the United Kingdom. 3D printing is the standout, rising at 22.88% CAGR on the back of Stratasys’s carbon-fiber PLA filaments that print automotive jigs twice as fast as ABS. Binder-jetted wood-fiber composites from Desktop Metal promise furniture prototypes that biodegrade in garden compost piles. Over the forecast horizon, extrusion and injection will absorb most tonnage growth, but additive manufacturing offers the highest EBITDA margins at low volumes.
By Application: Flexible Packaging Leads, Automotive Gains
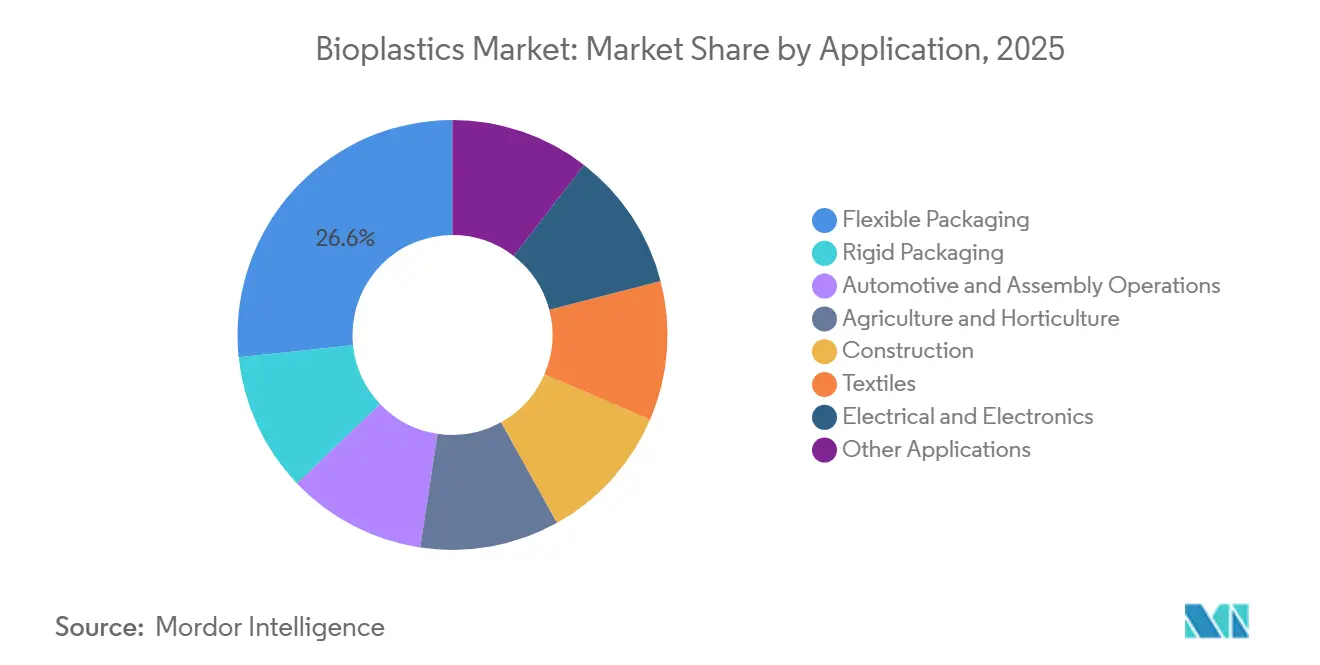
Flexible packaging captured 26.65% usage in 2025 and should rise at a 24.69% CAGR as France’s AGEC law and Germany’s VerpackG enforce compostability for coffee pods, e-commerce mailers, and fresh-produce films. Mondi’s March 2025 launch of a PLA-coated paper pouch shows the pathway to high-barrier formats that still compost in municipal plants, extending dry-good shelf life to 12 months. Rigid packaging leverages bio-PET’s compatibility with existing bottle loops but remains price-sensitive. Automotive interiors increasingly specify bio-PA and bio-PET composites; BMW’s i Vision Dee concept incorporated 40% bio-based plastics by weight and cut lifecycle emissions 25% versus the company’s 2021 baseline. Agriculture adopts starch-PBAT mulch films that eliminate retrieval labor, with Italy subsidizing the transition under its National Recovery and Resilience Plan. Construction and textiles remain nascent but show promise where green-building certifications or performance stretch fibers demand renewable content. Electrical uses grow more slowly due to the UL 94 V-0 hurdle, yet BASF met that requirement with a halogen-free bio-PA in 2024.

Geography Analysis
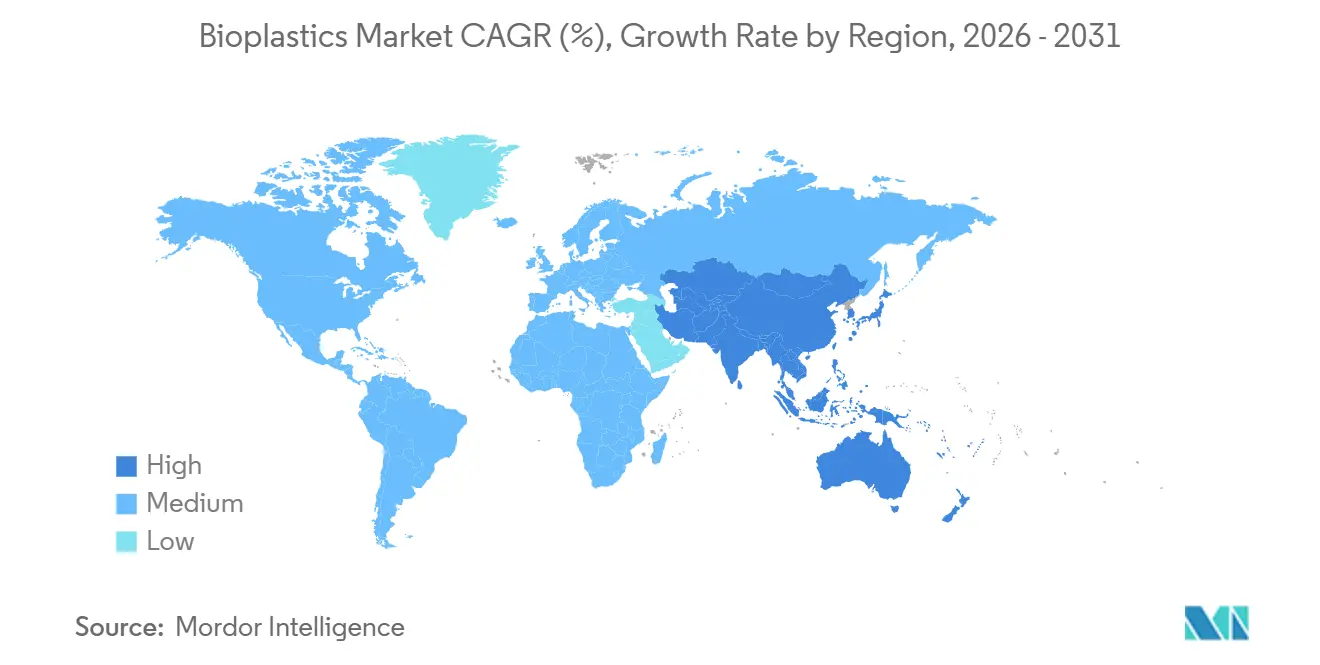
Asia-Pacific held 47.75% of global volume in 2025 and will grow at a 22.51% CAGR through 2031, driven by China’s 30% biodegradable-packaging mandate for express deliveries, Thailand’s tax holidays for PLA plants, and India’s single-use-plastic enforcement that re-tooled 12,000 converters toward compostable resins. Sinopec opened a 60 ktpa PBAT facility in Hainan in September 2024, integrated with sugarcane ethanol to shave 15% off feedstock costs while qualifying for Free Trade Port incentives. Reliance Industries and Danimer plan a 30 ktpa PHA plant in Gujarat by 2026 to serve both domestic mulch film and European marine-biodegradable demand. Japan’s April 2025 subsidy offset 50% of capex for SME molders converting to bio-resins, signaling policy recognition that supply-chain localization is a climate and security objective.
North America and Europe remain innovation hubs that write global specifications. The U.S. Inflation Reduction Act extends 45Q credits to carbon-negative polymers, making Nebraska’s PLA output competitive even when Brent flirts with USD 70. Germany funds enzymatic recycling pilots to handle PLA-PET contamination, hinting that chemical recycling could coexist with composting in the EU Circular Economy Action Plan. France’s AGEC law, fully in force since January 2024, pushes restaurants and canteens into compostable cutlery supplied by TotalEnergies Corbion’s Thai plant, illustrating how cross-border supply networks meet domestic mandates. The United Kingdom’s plastic-packaging tax indirectly favors bio-PE that qualifies for renewable-carbon credits once it reaches the 30% threshold.
South America leverages Brazil’s sugar platform; Braskem exports 60% of its bio-PE to Europe and North America, but domestic uptake lags due to absent bans and low willingness to pay. Argentina pilots source-separated compost collection in Buenos Aires and may scale nationally if contamination rates stay below 10%. The Middle East explores bio-naphtha; SABIC studies feedstock switching at Jubail to supply EU customers exposed to carbon-border adjustments. South Africa drafted producer-responsibility fees on non-compostables in late 2024 but faces implementation delays as small converters lobby for exemptions.

Value Chain Analysis
The bioplastics value chain starts with biomass cultivation and residue collection (sugarcane/sugar beet, corn dextrose, cassava/potato, and emerging cellulosic and wood-waste sugars), followed by feedstock pre-treatment and fermentation or catalytic conversion into intermediates (for example, lactic acid/lactide for PLA, BDO for PBAT, and bio-based C4 building blocks such as bioTHF/bioPTMEG). Polymerization and compounding into resin pellets follow, with vertical integration and bio-hub co-location becoming more visible as producers aim to reduce input cost volatility and tighten quality control, exemplified by NatureWorks opening a fully integrated Ingeo PLA facility in Nakhon Sawan, Thailand (about 75,000 metric tons per year) in April 2026 and Covation Biomaterials reaching mechanical completion of its first commercial bioTHF and bioPTMEG plant in Qidong, China in April 2026.
Downstream, resin is sold either directly to brand owners or via compounders and converters into packaging films and sheets (extrusion), molded food-service items (injection molding/thermoforming), bottles (blow molding for drop-in grades), and niche uses such as additive manufacturing (3D printing). Distribution relies on a mix of direct contracts and regional distributors, and certification and traceability (for example, ISCC PLUS/RSB and compostability standards such as EN 13432 and ISO 17088 referenced in procurement) act as practical gatekeepers into tenders and retail programs. Bottlenecks remain cost and infrastructure related, including resin premiums versus petro-plastics during low oil-price cycles, uneven access to industrial composting outside parts of Europe, and technical qualification constraints in high-heat and high-barrier applications. Together, these factors tend to shift volume toward drop-in bio-based polymers that fit established recycling streams, while biodegradable grades face pressure when end-of-life pathways are less clear.
Competitive Landscape
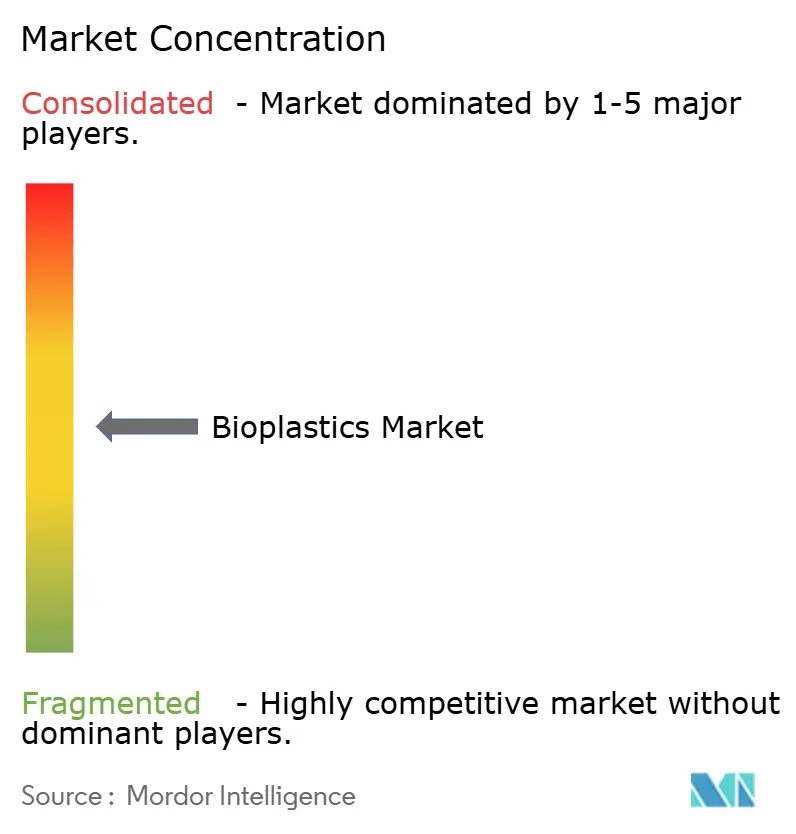
The bioplastics market is moderately consolidated, with leading players accounting for significant market share. However, no player exceeds a 10% individual share, leaving regional specialists ample room to penetrate niches. Integration is a strategic hedge: Braskem owns ethanol supply, while BASF’s biomass-balance credits allow renewable offerings without dedicated assets. Capacity is racing eastward; TotalEnergies Corbion will double its Thai PLA line to 150 ktpa by 2028. Patent activity centers on high-heat PLA crystallization. ISO 17088, EN 13432, ISCC PLUS, and RSB certifications now function as go-to-market prerequisites; smaller fermentation startups struggle to fund compliance audits, meaning that technological prowess alone is insufficient without credible chain-of-custody documentation.
Bioplastics Industry Leaders
NatureWorks LLC
TotalEnergies (Total Corbion)
BASF
Braskem
Eni S.p.A. (Novamont)
- *Disclaimer: Major Players sorted in no particular order

Market Opportunities and Future Outlook
A near-term opportunity is scaling integrated Asian feedstock-to-polymer platforms that lower delivered resin costs and improve supply reliability for converters. NatureWorks opening its fully integrated Ingeo PLA facility in Thailand in April 2026 provides incremental regional PLA supply and adds another large-scale sourcing node for multinational packaging value chains beyond North America and Europe. India is also showing local investment signals around PLA, with Balrampur Chini Mills securing INR 450 crore in equity funding in May 2026 for its planned 80,000 tonnes per year PLA project in Uttar Pradesh, which ties capacity development to tightening single-use plastics enforcement and converter retooling.
In Europe, opportunities are increasingly concentrated in compliance-ready materials with transparent lifecycle evidence and traceable chain-of-custody as policy scrutiny moves from broad sustainability claims toward performance and end-of-life compatibility. Regulation (EU) 2025/40 on packaging and packaging waste includes a formal review pathway for the technological development and environmental performance of biobased plastic packaging, pushing producers and brand owners to differentiate using verified LCAs and clearly defined recyclability or compostability claims rather than generic “bio” positioning. This creates room for bioplastics that fit advanced recycling or sorting regimes, including bio-based drop-ins that behave like fossil analogs, and for engineered PLA/PHA systems designed to close heat and barrier gaps in regulated packaging and durable goods. The direction also aligns with capital spending shifting toward Asia-Pacific capacity additions and supplier qualification programs built around certification and audited sustainability reporting.
Recent Industry Developments
- April 2026: NatureWorks officially opened a fully integrated Ingeo biopolymer manufacturing facility in Nakhon Sawan, Thailand, with about 75,000 metric tons per year of capacity. The plant adds Asia-based supply for PLA and helps converters qualify compostable and specialty PLA grades for packaging and other applications with tighter control over feedstock-to-polymer quality.
- March 2025: NatureWorks introduced the Ingeo Extend platform for biaxially oriented PLA (BOPLA) films, targeting processing efficiency improvements alongside biodegradation performance. The update supports higher-throughput film production and addresses a key adoption hurdle for flexible packaging where line speeds and scrap rates drive total conversion cost.
- June 2024: BASF launched biomass-balanced (BMB) ecoflex (PBAT) for packaging applications using renewable feedstocks from waste and residual biomass, supported by certification schemes including REDcert2 and ISCC PLUS. The product expands access to renewable-attributed compostable polymer options without requiring fully dedicated bio-based production assets, which can speed procurement qualification for converters operating under chain-of-custody requirements.


Research Methodology Framework and Report Scope
Market Definition and Coverage
For this study, the bioplastics market is defined as the demand and supply of polymer materials that are bio-based, biodegradable, or both, which are sold as resins and compounds for conversion into finished plastic products across end uses.
Scope exclusions: We exclude fossil-based plastics and additives that only modify biodegradability, and we do not count recycling or reuse value generated after the first sale of bioplastic resin.
Segmentation Overview
- By Type
- Bio-based Biodegradables
- Starch-based
- Polylactic Acid (PLA)
- Polyhydroxyalkanoates (PHA)
- Polyesters (PBS, PBAT, PCL)
- Other Bio-based Biodegradables
- Bio-based Non-biodegradables
- Bio Polyethylene Terephthalate (PET)
- Bio Polyethylene
- Bio Polyamides
- Bio Polytrimethylene Terephthalate
- Other Bio-based Non-biodegradables
- Bio-based Biodegradables
- By Feedstock
- Sugarcane / Sugar Beet
- Corn
- Cassava and Potato
- Cellulosic and Wood Waste
- Others (Algae and Microbial Oil)
- By Processing Technology
- Extrusion
- Injection Molding
- Blow Molding
- 3D Printing
- Others (Thermoforming, etc.)
- By Application
- Flexible Packaging
- Rigid Packaging
- Automotive and Assembly Operations
- Agriculture and Horticulture
- Construction
- Textiles
- Electrical and Electronics
- Other Applications
- By Geography
- Asia-Pacific
- China
- India
- Japan
- South Korea
- Indonesia
- Thailand
- Rest of Asia-Pacific
- North America
- United States
- Canada
- Mexico
- Europe
- Germany
- United Kingdom
- Italy
- France
- Netherlands
- Spain
- Rest of Europe
- South America
- Brazil
- Argentina
- Rest of South America
- Middle-East and Africa
- Saudi Arabia
- United Arab Emirates
- South Africa
- Egypt
- Rest of Middle-East and Africa
- Asia-Pacific
Data Sources, Market Sizing, and Validation
Desk Research
Desk research was used to set the market boundary, track core resin families, and create independent checks before primary work began. We mainly referenced public sources such as European Bioplastics publications, OECD and national statistical offices, UN Comtrade trade statistics, and regulatory sources such as the European Commission packaging rules and EPA materials guidance, since these help confirm production, trade direction, and policy-linked demand shifts.
Company annual reports, sustainability disclosures, investor presentations, and reputable press coverage were also reviewed to understand capacity additions, ramp-up timelines, and end-use pull in packaging and consumer goods. Patent database extracts were used selectively to validate technology direction in biodegradable polymers, and an import-export shipment-level database was used in a limited way to sense-check resin movement on major corridors. The sources named here are illustrative only, and many other public references were also used for collection, validation, and research clarification.
Primary Interviews and Surveys
Primary discussions were completed with resin producers, compounders, converters, distributors, and downstream buyers, followed by targeted check-ins with policy and standards stakeholders where compostability claims matter. Inputs from these conversations helped us validate realistic price bands, adoption pace by application, and how quickly announced capacity turns into sellable output across major regions.
Distribution of primary research fieldwork respondents
| Company type | Respondent position | Region |
|---|---|---|
| Top tier: 27% | CXOs: 12% | APAC: 38% |
| Mid tier: 51% | Functional/Unit leaders: 31% | EMEA: 35% |
| Smaller Players: 22% | Managers: 57% | Americas: 27% |
Market-Sizing & Forecasting
Sizing started with a top-down build where global capacity, utilization patterns, and trade corrected availability were translated into a demand pool, and then filtered by where bioplastics are technically and commercially used today. To keep the totals practical, we used selective bottom-up approximations using sampled price ranges by polymer family, typical conversion yields, and channel feedback on volumes moving into packaging, agriculture, and consumer goods.
Key inputs included installed and announced capacity by resin family, reported utilization and ramp-up timelines, trade flows for relevant HS codes where visibility exists, packaging regulation timelines that shift material selection, and average selling price logic by region and grade (including normalization for contract versus spot dynamics). For forecasting, scenario analysis was applied around policy enforcement timing, feedstock cost direction, and speed of new plant commissioning, and the forward path was then adjusted after reviewing what experts viewed as realistic adoption constraints. Where bottom-up visibility was thin, we used conservative penetration assumptions and then re-checked implied volumes against supply-side limits so the totals stayed feasible.
Data Validation & Update Cycle
Outputs were validated through multiple passes, starting with internal consistency checks across volume, value, and implied pricing so the model did not create impossible outcomes. We then compared results against independent signals such as capacity announcements, trade direction, and end-use demand cues, and outliers were flagged for rework before sign-off.
When a variance could not be explained by documented assumptions, respondents were re-contacted to confirm whether the issue came from pricing timing, scope boundaries, or a one-time event. The report is refreshed annually, with interim updates when a material change occurs, such as a major plant startup delay or a policy change that impacts packaging demand. Before delivery, a final analyst pass is completed so clients receive the latest updated view.
Mordor Intelligence's Bioplastics Market Estimate Compared With Other Published Estimates
Published bioplastics market values often diverge because different publishers lock pricing windows and exchange rates at different points in the year, and they also do not always count the same mix of bio-based drop-ins and biodegradable grades. In practice, small differences in assumed average selling prices and ramp-up timing can move the total value by a meaningful margin.
Key gap drivers in this market usually come from whether compostability and bio-content thresholds are applied consistently, how packaging-related demand is timed versus regulation enforcement, and whether reported values are normalized for inflation and currency timing. When price bands and currency conversions are refreshed close to the data cut and then cross-checked against capacity utilization and trade direction, the 2025 number stays anchored to plausible supply and consumption, which is how Mordor Intelligence keeps the estimate from drifting with stale ASP assumptions.
Benchmark comparison
| Source | Market Size | Gaps in Research Methodology |
|---|---|---|
| Mordor Intelligence | USD 18.40 B (2025) | |
| Global Consultancy A | USD 17.58 B (2025) | Uses a narrower ASP progression method and tends to hold exchange rates and contract price assumptions constant over a longer window, which can understate value when feedstock-linked pricing moves within the year. |
| Global Consultancy B | USD 18.40 B (2025) | Aligns on the headline year value, but the build appears more volume-led and can apply less granular price separation by region and application across bio-based drop-ins and biodegradable grades. |
The comparison suggests that most of the spread comes from timing choices in pricing and currency, and from how strictly qualifying rules are applied to what is counted as bioplastics in value terms. With clear variables, repeatable steps, and external checks tied to capacity and trade, the final figure remains easier to trace and stress-test during planning discussions.


Key Questions Answered in the Report
How large is the bioplastics market in 2026?
The bioplastics volume is estimated to reach 2.78 million tons in 2026 and is forecasted to climb to 6.18 million tons by 2031 at a 17.33% CAGR.
Which polymer class currently leads global demand?
Bio-based non-biodegradables such as bio-PET and bio-PE held 56.64% bioplastics market share in 2025 thanks to seamless compatibility with legacy processing and recycling loops.
What feedstock shows the fastest growth outlook?
Cellulosic and wood-waste streams are expanding at a 24.59% CAGR as pulp mills commercialize lignocellulosic sugar platforms that reduce land-use-change concerns.
Which region will add the most new capacity through 2031?
Asia-Pacific, led by China, Thailand, and India, will grow the bioplastics market at 22.51% CAGR and attract the majority of announced PLA and PHA projects.
What remains the biggest barrier to wider adoption?
Price premiums of 20%–40% over fossil polymers persist when crude prices sit below USD 80 per barrel, limiting uptake in price-sensitive segments absent policy support.
Are composting facilities keeping pace with material rollout?
No, fewer than 500 EU plants accept certified plastics and collection covers only 38% of residents, creating an infrastructure bottleneck that undermines disposal claims.
Page last updated on:




