
High-Performance Liquid Chromatography (HPLC) Market Size and Share
Market Overview
| Study Period | 2020 - 2031 |
|---|---|
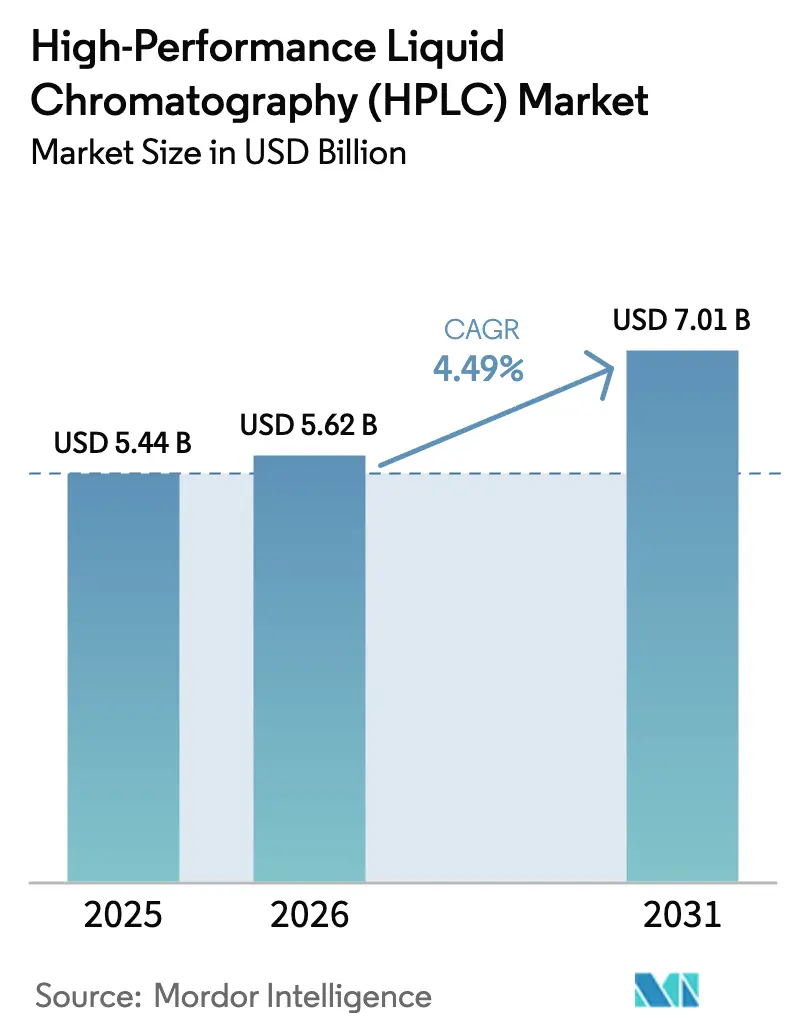
| Market Size (2026) | USD 5.62 Billion |
| Market Size (2031) | USD 7.01 Billion |
| Growth Rate (2026 - 2031) | 4.49 % |
| Fastest Growing Market | Asia Pacific |
| Largest Market | North America |
| Market Concentration | Medium |
Major Players *Disclaimer: Major Players sorted in no particular order Image © Mordor Intelligence. Reuse requires attribution under CC BY 4.0. | |
High-Performance Liquid Chromatography (HPLC) Market Analysis by Mordor Intelligence
The High-Performance Liquid Chromatography Market size is expected to grow from USD 5.44 billion in 2025 to USD 5.62 billion in 2026 and is forecast to reach USD 7.01 billion by 2031 at 4.49% CAGR over 2026-2031.
The steady course reflects durable instrument lifecycles that anchor recurring consumable sales, while periodic demand spikes originate from biopharmaceutical breakthroughs, stricter global quality-assurance mandates, and migration toward ultra-high-performance systems. Incumbent vendors are accelerating platform refreshes that bundle AI-enabled diagnostics and solvent-savings accessories to defend installed bases. Rising adoption in food safety labs, the pivot to antibody and gene-therapy pipelines, and Asia-Pacific’s regulatory harmonization with Western agencies together widen the addressable High-Performance Liquid Chromatography market opportunity. Competitive intensity remains moderate because razor-and-blade economics reward suppliers that can embed exclusive column chemistries into validated methods, yet white-space niches in microfluidic chips and predictive maintenance invite agile entrants.
Key Report Takeaways
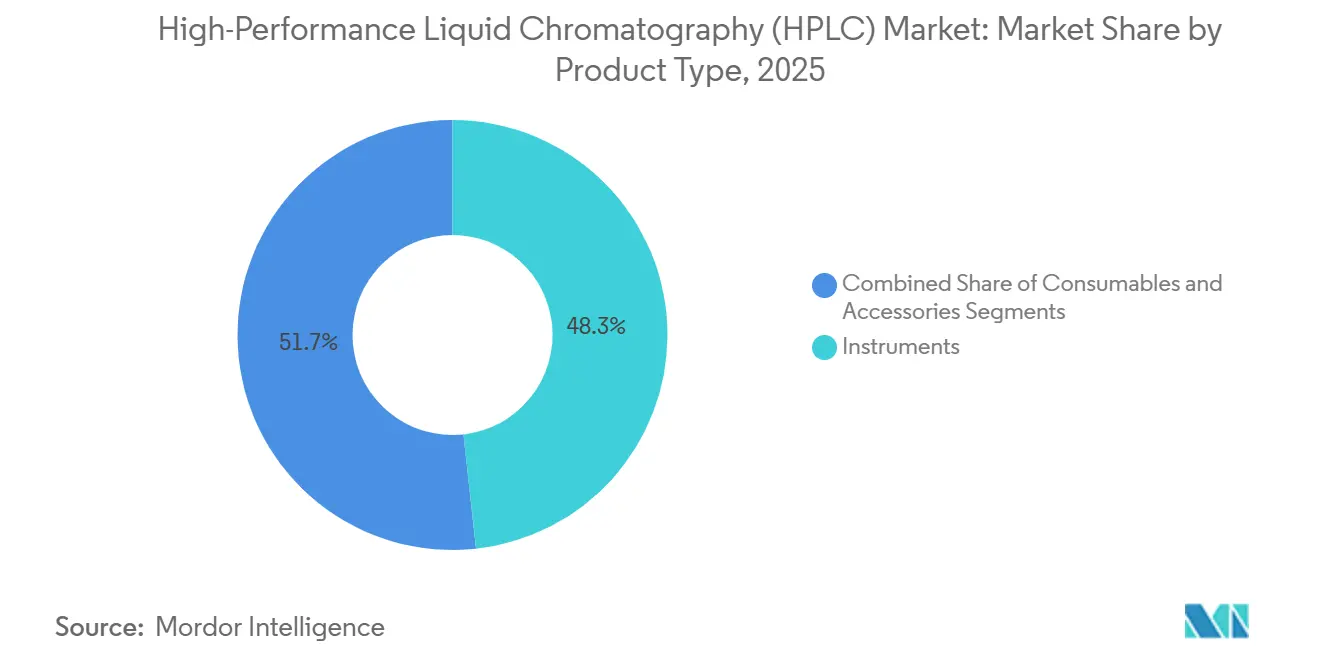
- By product type, instruments accounted for 48.25% of revenue share in 2025 while consumables are expanding at an 8.26% CAGR through 2031.
- By application, food and beverage testing is growing at 7.23% CAGR to 2031, whereas pharmaceutical and biotechnology research led with a 37.47% share in 2025.
- By separation mode, reverse-phase held 53.21% share in 2025, and affinity HPLC shows the fastest 8.66% CAGR to 2031.
- By detection method, UV/Vis dominated with 60.72% share in 2025, whereas mass-spectrometry detection is advancing at a 7.89% CAGR.
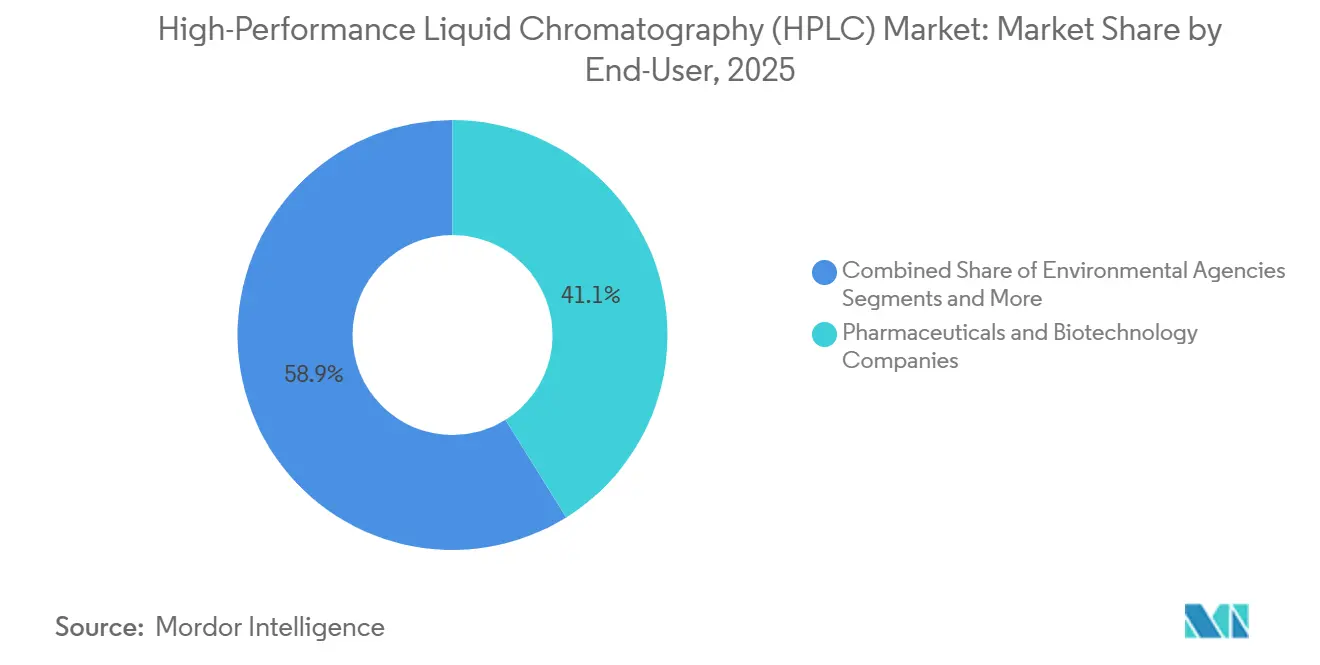
- By end-user, pharmaceutical and biotechnology companies captured 41.12% share in 2025, yet contract research organizations are pacing ahead at 6.34% CAGR.
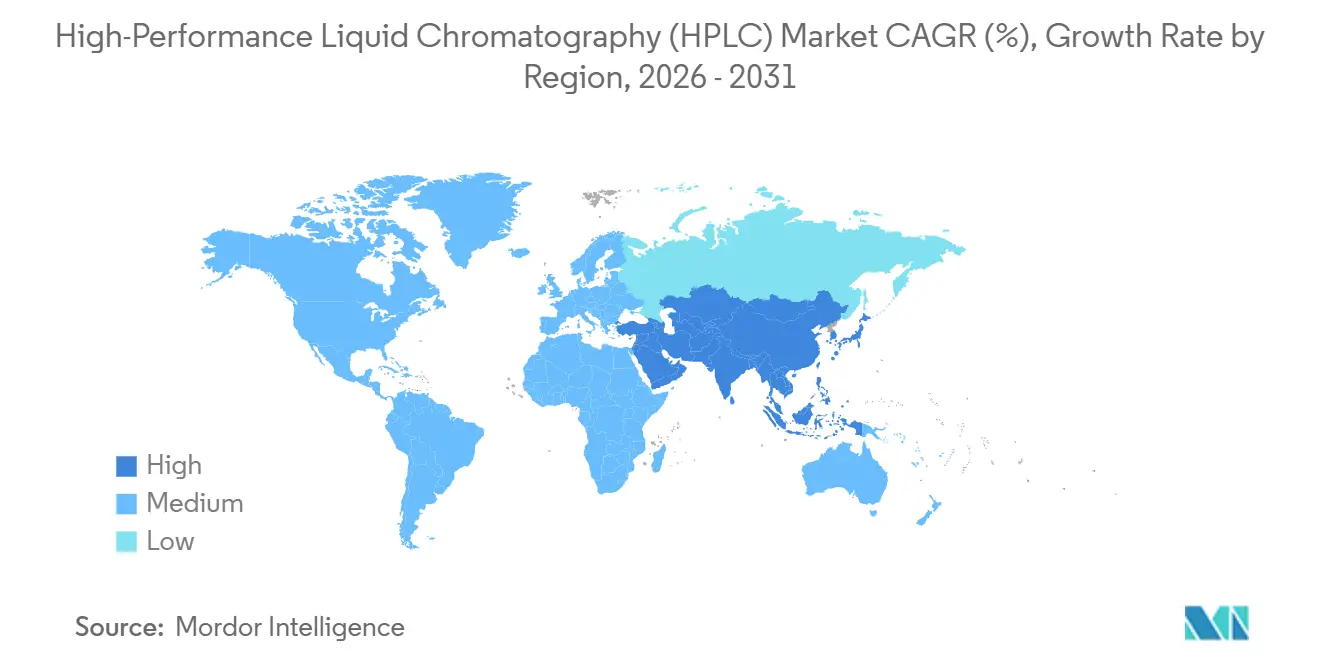
- By geography, North America retained a 37.66% share in 2025, while Asia-Pacific is progressing at a 6.72% CAGR toward 2031.
Note: Market size and forecast figures in this report are generated using Mordor Intelligence’s proprietary estimation framework, updated with the latest available data and insights as of January 2026.
Market Trends and Insights
Drivers Impact Analysis of High-Performance Liquid Chromatography (HPLC) Market*
| Driver | (~) % Impact on CAGR Forecast | Geographic Relevance | Impact Timeline |
|---|---|---|---|
| Rising demand for biopharmaceuticals & monoclonal antibodies | +1.2% | North America, Europe, China, India, South Korea | Long term (≥ 4 years) |
| Increasing adoption in food safety & environmental testing | +0.8% | China, India, European Union, North America | Medium term (2-4 years) |
| Growing prominence of UHPLC for high-throughput screening | +0.7% | United States, Germany, Japan | Short term (≤ 2 years) |
| Advances in microfluidic / chip-based HPLC platforms | +0.5% | United States, Germany, United Kingdom | Long term (≥ 4 years) |
| Integration of AI-driven predictive maintenance | +0.4% | United States, Canada, Western Europe | Medium term (2-4 years) |
| Stringent regulatory guidelines for pharma QA | +0.9% | Global, prominence in United States, Europe, China, India | Long term (≥ 4 years) |
| Source: Mordor Intelligence | |||


Rising Demand for Biopharmaceuticals & Monoclonal Antibodies
Eighteen monoclonal antibodies won FDA approval in 2024, sustaining a pipeline that now depends on multi-column purification trains combining affinity, ion-exchange, and size-exclusion modes to assure 99% purity thresholds.[1]U.S. Food and Drug Administration Staff, “Novel Drug Approvals 2024,” U.S. Food and Drug Administration, fda.gov Contract manufacturers without in-house method-development talent are therefore acquiring complete HPLC workstations bundled with vendor service contracts covering validation and lifecycle support. Biosimilar producers in India and China face 18-month bioequivalence windows that reward validated UHPLC methods over legacy protocols, compressing buying cycles for high-throughput instruments. EMA’s 2025 revision of ICH Q6B now compels orthogonal glycosylation confirmation, driving demand for dual-detector configurations that pair UV with fluorescence or mass spectrometry. Cell- and gene-therapy vectors require quantification of residual plasmid DNA at parts-per-billion levels, catalyzing column innovation toward sub-2 µm particle beds that withstand 18,000 psi operating pressures. Collectively, these factors enlarge the High-Performance Liquid Chromatography market footprint in bioprocess analytics.
Increasing Adoption in Food Safety & Environmental Testing
The U.S. FDA’s final preventive-controls rule added mandatory mycotoxin screening for imported grains, triggering around 2,500 instrument placements across border laboratories in 2024.[2]U.S. Food and Drug Administration Staff, “FDA Updates Mycotoxins in Domestic and Imported Human Foods Compliance Program,” U.S. Food and Drug Administration, fda.gov China released 47 new food-safety standards in 2025, most citing HPLC as the reference technique for pesticides, thereby shifting provincial budgets toward columns and solvent packs rather than gas-chromatography alternatives.[3]Zhuohong Wang and Xiong Yuyang, “47 National Food Safety Standards Released,” Foreign Agricultural Service, fas.usda.gov The European Union incorporated HPLC-MS into its 2024 Drinking Water Directive update to monitor PFAS compounds that lack chromophores. Brazil now obliges aflatoxin verification in coffee exports using HPLC, illustrating how emerging economies retrofit facilities to meet EU thresholds, which in turn fertilizes regional demand in the High-Performance Liquid Chromatography market. Authenticity testing for olive oil and honey further expands column throughput by applying chromatographic fingerprints to verify geographic origin for premium labeling.
Growing Prominence of UHPLC for High-Throughput Screening
Operating beyond 15,000 psi, UHPLC shortened routine assays from 30 minutes to under 5 minutes, enabling pharmaceutical discovery groups to screen approximately 1.2 million compounds per year, according to a 2025 Journal of Medicinal Chemistry survey. Although a UHPLC system costs roughly USD 150,000 versus USD 50,000 for conventional units, heavy-use laboratories recover the premium within 18 months through instrument consolidation. Novel sub-2 µm polysaccharide-based chiral columns now resolve enantiomers inside 3 minutes, feeding CRO service models that bill per injection rather than per sample batch. Compact form factors under 0.5 m² and <500 W power consumption bring UHPLC capabilities to universities in Southeast Asia and Latin America where infrastructure limits once curbed adoption. Solvent usage remains a friction point; higher flow rates can double acetonitrile consumption, so vendors are integrating recycling loops and method-optimization software, strengthening consumables pull-through in the High-Performance Liquid Chromatography market.
Advances in Microfluidic / Chip-Based HPLC Platforms
Microfluidic chips no larger than a credit card now integrate injection valves, separation channels, and on-chip UV detection, achieving 90% correlation with benchtop systems in a 2024 Analytical Chemistry validation. Production costs have fallen near USD 50 per chip, yet fragile glass and a lack of connector standards curb commercialization outside research. Agilent’s 2025 patent on a polymer chip with built-in gradient mixing signals incumbent hedging, even as they prioritize consumable-rich conventional columns. Open-source academic consortia may accelerate commoditization if regulators accept chip workflows for method validation, a shift that could fragment the High-Performance Liquid Chromatography market. Integration with MS remains challenging because low-nanoliter flow rates depress ionization efficiency, confining chip platforms to analytes amenable to UV detection and delaying their use in proteomics.
Restraints Impact Analysis of High-Performance Liquid Chromatography (HPLC) Market*
| Restraint | (~) % Impact on CAGR Forecast | Geographic Relevance | Impact Timeline |
|---|---|---|---|
| High cost of instruments & maintenance | -0.6% | Emerging markets in Asia-Pacific, Middle East & Africa, South America | Short term (≤ 2 years) |
| Shortage of skilled chromatographers | -0.4% | Asia-Pacific, Middle East & Africa | Medium term (2-4 years) |
| Regulatory push toward greener analytical techniques | -0.3% | Europe, North America | Long term (≥ 4 years) |
| Competition from alternative separation technologies | -0.5% | Global | Medium term (2-4 years) |
| Source: Mordor Intelligence | |||
High Cost of Instruments & Maintenance
Entry-level systems priced at USD 40,000 escalate to >USD 250,000 when mass-spectrometry compatibility and CFR Part 11 software are included, intimidating small labs in emerging economies. Annual service contracts add another 8–12% of purchase price, yet forgoing OEM maintenance often voids warranties and jeopardizes regulatory compliance. High-throughput sites may burn through 30 columns per year at USD 500–1,500 each, lifting total ownership above USD 500,000 across ten years, a barrier that stretches replacement cycles and dampens High-Performance Liquid Chromatography market growth. Lease-to-own models offer relief but impose interest costs near 8%, and clauses frequently restrict buyers to vendor consumables.
Shortage of Skilled Chromatographers
An American Chemical Society 2025 survey found 38% of labs struggle to hire HPLC-trained analysts, as university enrollment in analytical chemistry wanes. Training novices to manage gradient optimization, system-suitability metrics, and audit-trail software takes up to 18 months, delaying productivity gains. Modern instruments meld fluidics, electronics, and informatics, demanding hybrid skill sets scarce in Asia-Pacific production hubs. Vendor-run certification courses cover basic operation but seldom impart troubleshooting acumen, prolonging downtime when ghost peaks or retention drift occur. Dependence on expatriate specialists elevates costs for manufacturers in India and China, tightening High-Performance Liquid Chromatography market margins.
*Our forecasts treat driver/restraint impacts as directional, not additive. The impact forecasts reflect baseline growth, mix effects, and variable interactions.
High-Performance Liquid Chromatography (HPLC) Market Segment Analysis
By Product Type:
Consumables Outpace InstrumentsConsumables are projected to grow at 8.26% through 2031, nearly twice the overall High-Performance Liquid Chromatography market. Column turnover every 200–500 injections, solvent consumption that averages 10–20 L of acetonitrile weekly, and proprietary buffer packs together reinforce a steady consumable pull. The instruments segment, which captured 48.25% in 2025, expands more slowly because robust UHPLC chassis remain serviceable for >10 years with regular maintenance.
Column innovations extend lifetime by up to 50%, yet higher UHPLC pressures hasten wear, ensuring recurring demand. Accessories—autosamplers, degassers, column ovens—add incremental upgrades as labs retrofit legacy systems for data-integrity compliance. Vendors leveraging razor-and-blade economics secure durable footholds in the High-Performance Liquid Chromatography market, especially when validated methods embed exclusive column chemistries.


By Application:
Food Testing Gains MomentumFood and beverage testing advances at 7.23% CAGR to 2031, driven by import regulations, contamination scandals, and authenticity verification. Pharmaceutical and biotechnology research still represents the single largest slice at 37.47% in 2025, but its share erodes as generic competition compresses R&D budgets and biologics rely on orthogonal analytics.
Clinical diagnostics grows slowly because point-of-care immunoassays replace many HPLC tests, relegating chromatography to specialist panels. Environmental monitoring remains stable, while forensic labs expand usage for seized-drug profiling and toxicology. Demand diversification cushions the High-Performance Liquid Chromatography market against cyclical swings in pharmaceutical capital expenditure.
By Separation Mode:
Affinity HPLC SurgesReverse-phase systems held 53.21% of 2025 revenue, fueled by small-molecule versatility, yet affinity HPLC exhibits the strongest 8.66% CAGR, mirroring monoclonal antibody growth. Ion-exchange and size-exclusion remain essential for charge-variant and aggregation analyses, though lengthy run times constrain throughput.
Affinity HPLC adoption accelerates in biosimilar manufacturing hubs across Asia, where multi-column setups purify concurrent antibody projects. Reverse-phase methods face sustainability scrutiny for acetonitrile consumption, encouraging greener buffer systems that could subtly tilt High-Performance Liquid Chromatography market preferences over the next decade.

By Detection Method:
Mass Spectrometry AscendsUV/Vis detectors dominated with 60.72% share in 2025 thanks to compendial references, yet mass-spectrometry detectors are climbing at 7.89% CAGR, propelled by falling triple-quadrupole prices and expanding metabolomics datasets. Fluorescence, refractive-index, and electrochemical detectors inhabit specialist niches but jointly account for a minority share.
High-resolution time-of-flight systems now support routine impurity profiling, eroding UV-only installations in drug-development labs. As capital costs drop below USD 200,000, LC-MS adoption rises among mid-tier CROs and academic cores, widening the addressable High-Performance Liquid Chromatography market.
By End-User:
CROs Capture SharePharmaceutical and biotechnology companies retained 41.12% share in 2025, yet contract research organizations are pacing ahead at 6.34% CAGR, reflecting the sector’s shift to asset-light models. Academic institutes show minimal expansion due to grant cycles, while hospital labs migrate toward point-of-care devices, capping HPLC demand.
Environmental agencies maintain a steady replacement cadence governed by statutory monitoring, whereas food-processing firms bring testing in-house to safeguard supply chains. Outsourcing momentum ensures CRO laboratories remain a pivotal growth engine within the High-Performance Liquid Chromatography market.
Geography Analysis
North America High-Performance Liquid Chromatography (HPLC) Market
North America commanded 37.66% of 2025 revenue courtesy of FDA-driven validation norms that stipulate triplicate HPLC runs for each batch release. An aging installed base—40% of systems exceed 10 years—creates a ripe replacement pool as vendors offer trade-in credits toward AI-enabled UHPLC platforms. Canada and Mexico contribute incremental growth, the latter benefitting from near-shoring that places analytical labs near manufacturing plants to shorten logistics.
APAC High-Performance Liquid Chromatography (HPLC) Market
Asia-Pacific advances at 6.72% CAGR through 2031 as China, India, and South Korea tighten GMP parity with Western agencies. China’s 2024 Drug Administration Law amendment forces chromatographic testing even for traditional medicines, while Indian generic producers invest in data-integrity upgrades to satisfy FDA observations. Southeast Asian exporters adopt HPLC to meet EU pesticide residue limits, diffusing demand across Thailand, Vietnam, and Indonesia and enlarging the regional High-Performance Liquid Chromatography market.
EMEA and South America High-Performance Liquid Chromatography (HPLC) Market
Europe exhibits steady uptake anchored by EMA and EFSA directives. Western European nations modernize fleets with solvent-savings accessories aligned to the EU Green Deal, and Southern Europe’s olive-oil and wine sectors deploy HPLC authenticity assays to secure denomination-of-origin labels. Eastern Europe attracts pharmaceutical investments seeking EU-based yet cost-effective production, channeling instrument placements into Poland and the Czech Republic. Middle East & Africa and South America maintain modest shares, yet public investment in food-safety and local drug manufacturing underpins incremental growth, with Brazil and GCC states leading regional adoption.

Regulatory Landscape
HPLC platforms used in regulated laboratories operate within a layered framework that combines device quality systems with method-validation expectations. In the United States, high-pressure liquid chromatography systems for clinical use are classified by the US FDA as Class I devices under 21 CFR 862.2260, and they are currently 510(k) exempt, while laboratories and manufacturers still face stringent expectations around data integrity and documented performance qualification in GMP/GLP environments.
Across geographies, method governance is tightening around lifecycle-based validation and harmonized standards. ICH Q2(R2) (validation of analytical procedures) took effect on June 14, 2024, shaping how HPLC methods are qualified and maintained across pharma QA/QC. The US FDA Quality Management System Regulation (QMSR) took effect February 2, 2026, aligning CGMP requirements more closely with ISO 13485:2016. In clinical laboratories, ISO 15189:2022 implementation is being operationalized for chromatography, including a June 2026 European Federation of Laboratory Medicine (EFLM) technical guidance on applying ISO 15189 requirements to chromatographic methods, reinforcing documentation and ongoing verification needs for routine HPLC workflows.
Value Chain Analysis
The HPLC value chain starts with specialty inputs and precision manufacturing, then moves into validated service delivery and recurring consumables. Upstream suppliers provide high-purity materials for stationary phases (porous silica, polymers, hybrid substrates), solvent and reagent ecosystems, and high-tolerance components for pumps, injectors, and detectors. Key bottlenecks cluster around stationary phase particle synthesis, ligand bonding chemistry, and high-pressure column packing, where reproducibility and lot-to-lot consistency affect method transfer and regulatory acceptance.
Midstream manufacturing and integration are handled by instrument OEMs and consumables specialists that often pursue vertical integration to control quality and supply continuity. Waters points to internal production for sorbent materials in Taunton, Massachusetts and column hardware in Milford, Massachusetts, supported by centralized distribution through Wexford, Ireland, while Tosoh Bioscience manufactures instrumentation, columns, and bulk media resins at its Nanyo Complex in Yamaguchi, Japan. Downstream, sales are routed through direct field teams and distributors into pharma/biotech, CROs, food testing, and public laboratories, with recurring revenue supported by qualification requirements in GMP/GLP and switching costs driven by platform re-validation and method lock-in to specific columns and consumables.
Competitive Landscape
The High-Performance Liquid Chromatography market demonstrates moderate concentration. These incumbents bind customers through multi-year service pacts that couple preventative maintenance with proprietary consumable supply, elevating switching barriers. Yet microfluidic chip start-ups and software-centric entrants challenge this hold by offering open architectures that welcome third-party columns and detectors.
Product differentiation now tilts toward informatics. Agilent’s AI-driven method-development assistant recommends gradients from molecular structure libraries, cutting development cycles. Waters’ cloud analytics platform aggregates chromatograms across facilities, employing multivariate models to flag subtle batch deviations in real time. These software pivots turn hardware into gateways for recurring subscription revenue, reframing competitive stakes inside the High-Performance Liquid Chromatography market.
Disruptors face regulatory inertia, as pharmaceutical firms favor platforms with documented precedent in FDA submissions. ISO 17025 accreditation further deters unproven hardware. Nonetheless, white-space remains in ruggedized, battery-powered instruments for on-site water assessment and point-of-care drug monitoring, where incumbents’ large-footprint systems struggle. Strategic partnerships, such as Shimadzu’s 2024 biopharma alliance and Waters’ cross-licensing of microfluidic patents, illustrate how leaders hedge against erosion while reinforcing installed ecosystems.
High-Performance Liquid Chromatography (HPLC) Industry Leaders
Waters Corporation
Agilent Technologies Inc.
Thermo Fisher Scientific Inc.
Shimadzu Corporation
Danaher Corporation
- *Disclaimer: Major Players sorted in no particular order

High-Performance Liquid Chromatography (HPLC) Market Companies Covered in this Report
- Agilent Technologies
- Bio-Rad Laboratories
- Danaher
- Gilson
- Hamilton Company
- Hitachi
- Jasco Inc.
- Knauer Wissenschaftliche Geräte
- LECO
- Merck KGaA (MilliporeSigma)
- Restek
- Revvity Inc
- Shimadzu
- Thermo Fisher Scientific
- Tosoh
- Trajan Scientific
- Waters Corporation
- YMC Co., Ltd.
Read Analysis of High-Performance Liquid Chromatography (HPLC) Companies

Market Opportunities and Future Outlook
Method lifecycle modernization is creating near-term whitespace for vendors that can help regulated labs shift from legacy HPLC to higher-throughput UHPLC while keeping validation packages defensible. With ICH Q2(R2) in force since June 2024 and ICH Q14 (analytical procedure development) enabling scientifically justified method changes, laboratories have a clearer basis to rationalize changes such as column format, flow, and detector configuration without restarting from scratch. That, in turn, lifts demand for compliance-ready software, migration toolkits, and service-led validation support.
Biopharma modalities are widening the addressable opportunity for advanced columns and integrated LC-MS workflows in QC, particularly for peptides and lipid nanoparticles used in newer drug platforms. In 2026, Waters launched 1 mm I.D. microflow LC columns using MaxPeak Premier Technology positioned to reduce sample and solvent usage by 75%, and it followed with BioResolve Peptide and GTxResolve Lipid column platforms aimed at faster characterization of GLP-1 peptides and LNP components. On the workflow side, Agilent introduced a Multi-Attribute Method (MAM) solution integrating LC/HRMS for biopharma QC, and Phenomenex launched Luna Omega HILIC columns to improve separation of polar compounds relevant to biopharmaceutical and clinical testing. Together, these moves reflect continued product investment around complex analytes, reduced solvent consumption, and higher selectivity separations.
Recent Industry Developments in High-Performance Liquid Chromatography (HPLC) Market
- July 2026: Agilent expanded its Altura HPLC column portfolio with new inert size exclusion chromatography (SEC) and PLRP-S columns aimed at biotherapeutic analysis. The additions target large-molecule separations that press QC labs to improve recovery and reproducibility for proteins and related modalities, strengthening Agilent's consumables pull-through in regulated environments.
- June 2026: Waters launched BioResolve Peptide and GTxResolve Lipid columns positioned for faster characterization of GLP-1 peptides and lipid nanoparticle components used in drug development. The release signals intensified column innovation for complex biopharma workflows, where throughput and selectivity shape routine method adoption and ongoing consumables demand.
- July 2025: Waters announced an agreement to combine with BD's Biosciences and Diagnostic Solutions business to form a life science and diagnostics company focused on regulated, high-volume testing. The transaction underscores consolidation pressure in analytical and diagnostic ecosystems and can reshape instrument and consumables bundling, service coverage, and procurement dynamics for chromatography-heavy labs.


High-Performance Liquid Chromatography (HPLC) Market Report Scope and Research Methodology
Market Definition and Coverage
For this methodology, the market covers revenue generated from high-performance liquid chromatography used to separate, identify, and quantify compounds in liquid samples under high pressure, across research, quality control, and testing labs worldwide.
Scope exclusions: We exclude gas, thin-layer, and paper chromatography methods, and we also exclude disposable cartridge kits that are part of point-of-care analyzers.
Segments Covered in This Report
- By Product Type
- Instruments
- Consumables
- Accessories
- By Application
- Pharmaceutical & Biotechnology Research
- Clinical Diagnostics
- Food & Beverage Testing
- Environmental Analysis
- Forensic Science
- Other Industrial Applications
- By Separation Mode
- Reverse-Phase HPLC
- Ion-Exchange HPLC
- Size-Exclusion HPLC
- Affinity HPLC
- Hydrophobic-Interaction HPLC
- Other Modes
- By Detection Method
- UV/Vis Detectors
- Fluorescence Detectors
- Refractive-Index Detectors
- Mass-Spectrometry Detectors
- Electrochemical Detectors
- Others
- By End-User
- Pharmaceutical & Biotechnology Companies
- Academic & Research Institutes
- Contract Research Organizations
- Hospitals & Clinics
- Environmental Agencies
- Food & Beverage Companies
- By Geography
- North America
- United States
- Canada
- Mexico
- Europe
- Germany
- France
- United Kingdom
- Italy
- Spain
- Rest of Europe
- Asia-Pacific
- China
- Japan
- India
- South Korea
- Australia
- Rest of Asia-Pacific
- Middle East & Africa
- GCC
- South Africa
- Rest of Middle East & Africa
- South America
- Brazil
- Argentina
- Rest of South America
- North America
Data Sources, Market Sizing, and Validation
Desk Research
Desk work starts by mapping where HPLC demand shows up in public data, and then we align it with how laboratories typically buy systems, columns, solvents, and accessories. We review sources such as the US FDA and USP for analytical and quality expectations, the US EPA for environmental testing methods, and the European Medicines Agency for regulated lab practices that influence instrument and consumable choices.
To quantify and sanity-check the model inputs, we also use sources such as UN Comtrade for trade flows of chromatography-related equipment, the World Bank and OECD for macro indicators that link to lab spending, and peer-reviewed journals for adoption patterns like UHPLC uptake and column usage norms. These are then supported by company filings, annual reports, and investor presentations to understand portfolio mix and geographic exposure, along with a paid subscription for company financials and another for patent databases to track technology direction. The sources listed here are illustrative only, and additional public references were used for data collection, validation, and clarification.
Primary Interviews and Surveys
Primary inputs are gathered through expert interviews and structured surveys with instrument suppliers, channel partners, lab managers, and method development specialists who see purchasing cycles firsthand. For a global market like HPLC, we balance feedback across major regions so that pricing assumptions, replacement timing, and consumables pull-through are checked against what labs report they buy and when.
Distribution of primary research fieldwork respondents
| Company type | Respondent position | Region |
|---|---|---|
| Top tier: 35% | CXOs: 13% | APAC: 41% |
| Mid tier: 51% | Functional/Unit leaders: 35% | EMEA: 36% |
| Smaller Players: 14% | Managers: 52% | Americas: 23% |
Market-Sizing & Forecasting
Sizing is built using a top-down approach where regulated testing intensity and lab activity are reconstructed into an addressable HPLC demand pool, and then converted into spend using pricing and replacement patterns. Key inputs include pharmaceutical and biotech manufacturing output, clinical and analytical testing volumes, installed base replacement cycles for HPLC and UHPLC systems, column consumption per instrument, and solvent and accessory usage that tracks method throughput.
The totals are corroborated with selective bottom-up approximations, such as sampled supplier revenue splits, distributor channel checks, and ASP multiplied by estimated unit shipments in key regions, which helps us adjust for gaps where public reporting is bundled. Forecasts are produced using scenario analysis supported by expert consensus, where the variables above are stress-tested for changes in regulated testing, lab funding, and technology mix shifts (for example, the pace of UHPLC upgrades).
Data Validation & Update Cycle
Validation is done by triangulating the model output against independent signals like instrument shipment momentum, consumables pull-through indicators, and regional lab spending trends, and then reviewing variance drivers that cannot be explained by clear inputs. When unusual jumps appear, we re-check assumptions, revisit the underlying source tables, and re-contact select respondents so the final estimate remains consistent with observed market behavior.
Each study goes through multi-step analyst review before sign-off, with separate checks for arithmetic integrity, currency conversion timing, and year-to-year continuity. Reports are refreshed annually, and interim updates are triggered when material events occur, after which a final pre-delivery pass is completed so clients receive the latest updated view.
Mordor Intelligence's High Performance Liquid Chromatography Market Size Versus Other Published Estimates
It is normal to see different HPLC market values across publications because the boundaries of what gets counted can shift in small but important ways. The base year choice, what gets bundled with instruments, and how pricing is updated in the forecast window are usually the biggest reasons the numbers do not line up.
By tracking installed base replacement timing and consumables pull-through in the model, Mordor Intelligence separates recurring spend on columns, solvents, and small accessories from adjacent lab spend, which shifts totals versus studies that emphasize instruments or apply broader chromatography bundles. Differences also come from whether the estimate is anchored to a 2024 current-year view or a 2026 sizing year, plus how currency timing and inflation pass-through are treated when projecting ASP progression.
Benchmark comparison
| Source | Market Size | Gaps in Research Methodology |
|---|---|---|
| Mordor Intelligence | USD 5.62 B (2026) | |
| Global Consultancy A | USD 4.96 B (2024) | Uses an earlier base year and a 2025-2030 forecast window, and its scope presentation is more centered on market splits by product and end use, which can understate consumables pull-through when it is not explicitly modeled against installed base behavior. |
| Industry Publisher B | USD 5.01 B (2024) | Starts from a 2024 base and extends to 2032, and it explicitly includes software as a product segment, which can lift totals if software is counted as stand-alone revenue rather than as part of integrated system sales and service bundles. |
Looking across the table, the spread is mainly explained by base-year anchoring, what is treated as in-scope HPLC-related spend, and how price and mix shifts are carried through the forecast. Our approach stays traceable to observable lab activity and replacement behavior, which makes the sizing steps easier to repeat and to pressure-test when conditions change.


Key Questions Answered in the Report
What is the forecast value of the High-Performance Liquid Chromatography market in 2031?
The market is expected to reach USD 7.01 billion by 2031.
Which application area will grow the fastest through 2031?
Food and beverage testing is projected to expand at a 7.23% CAGR, the highest among all applications.
Why are consumables outperforming instruments?
Recurring column and solvent needs, combined with method-validation lock-in, drive consumables’ 8.26% CAGR versus slower instrument replacement cycles.
What region will contribute the most new revenue?
Asia-Pacific, with a 6.72% CAGR, will add the largest incremental revenue due to regulatory harmonization and manufacturing expansion.
Which detection method is gaining momentum over UV/Vis?
Mass-spectrometry detectors are rising at a 7.89% CAGR on the back of proteomics and metabolomics adoption.
Page last updated on:


 Your data is secure and never sold or shared.


