
Market Overview
| Study Period | 2020 - 2031 |
|---|---|
| Forecast Data Period | 2026 - 2031 |
| Base Year Market Size (2025) | USD 177 Billion |
| Market Size (2026) | USD 187.05 Billion |
| Market Size (2031) | USD 246.56 Billion |
| Growth Rate (2026 - 2031) | 5.68 % |
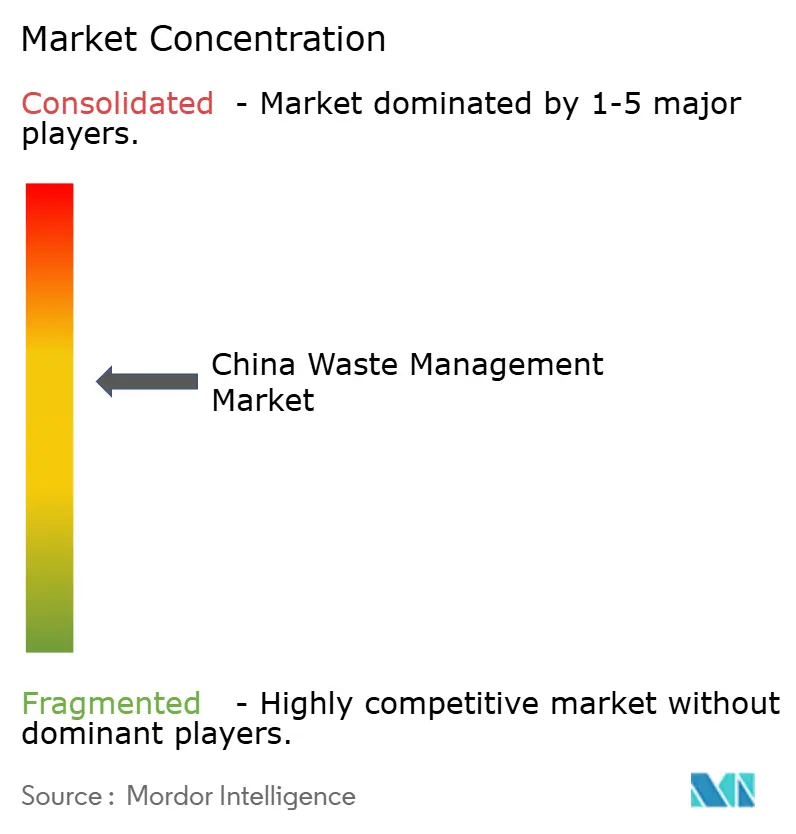
| Market Concentration | Medium |
Major Players *Disclaimer: Major Players sorted in no particular order Image © Mordor Intelligence. Reuse requires attribution under CC BY 4.0. | |
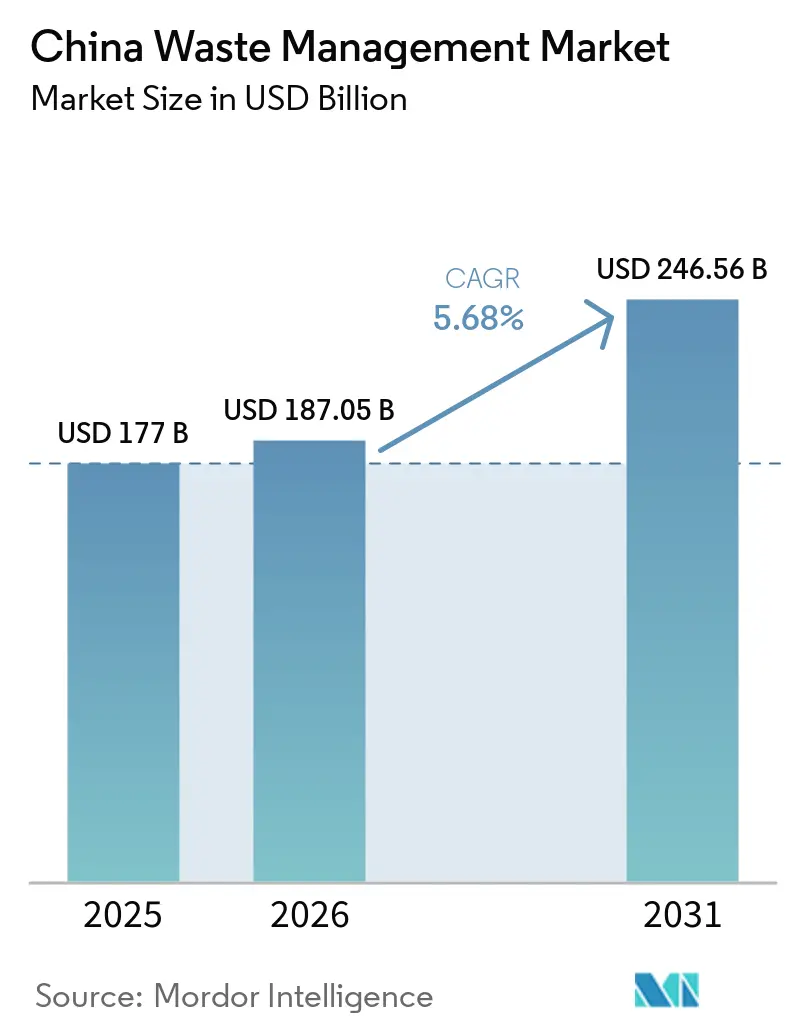
China Waste Management Market Analysis by Mordor Intelligence
The China Waste Management Market size was valued at USD 177 billion in 2025 and estimated to grow from USD 187.05 billion in 2026 to reach USD 246.56 billion by 2031, at a CAGR of 5.68% during the forecast period (2026-2031). Policy commitments embedded in the Beautiful China blueprint and the national carbon-neutrality timetable are converting waste streams into revenue sources, as shown by waste-to-energy plants that now account for almost half of global installed capacity. Urbanization in tier-2 and tier-3 cities, corporate ESG mandates, and capital-market appetite for environmental public–private partnerships are reinforcing steady demand for integrated solutions. Standardized frameworks introduced through the zero-waste city program are improving project bankability, while digital technologies such as AI-enabled route planning and blockchain waste tracking strengthen operational performance. International expansion by domestic operators into Southeast Asia and the Middle East reveals a shift from a purely municipal service model toward an export-oriented, technology-rich resource recovery industry[1].
Key Report Takeaways
- By source, residential waste led with a 40.12% share of the Chinese waste management market in 2025; commercial waste is forecast to grow at a 10.95% CAGR through 2031.
- By service type, collection and transportation captured 32.65% revenue share in 2025, while recycling and resource recovery are set to expand at an 10.92% CAGR to 2031.
- By waste type, municipal solid waste held 46.78% of the Chinese waste management market share in 2025; e-waste is the fastest-growing category at a 9.96% CAGR.
- By region, Eastern China accounted for 18.55% of market revenue in 2025, whereas Southern China is projected to record a 9.12% CAGR between 2026 and 2031.
Note: Market size and forecast figures in this report are generated using Mordor Intelligence’s proprietary estimation framework, updated with the latest available data and insights as of 2026.
Market Trends and Insights
Drivers Impact Analysis of China Waste Management Market*
| Driver | (~) % Impact on CAGR Forecast | Geographic Relevance | Impact Timeline |
|---|---|---|---|
| Expansion of waste-to-energy capacity backed by feed-in tariffs | +1.5% | Nationwide, concentrated in Eastern and Southern China | Short term (≤ 2 years) |
| Urbanization-driven MSW volume surge in tier-2 & tier-3 cities | +1.2% | Central and Southern China; spillover to Western regions | Medium term (2-4 years) |
| Corporate ESG mandates driving industrial waste outsourcing | +0.9% | Eastern manufacturing hubs; extending to Central provinces | Medium term (2-4 years) |
| Zero-waste city pilot program scaling nationwide | +0.8% | National, with early gains in Eastern provinces | Long term (≥ 4 years) |
| E-commerce packaging waste & single-use plastic ban enforcement | +0.7% | National; highest impact in tier-1 cities | Short term (≤ 2 years) |
| Capital-market preference for environmental PPPs lowering cost of capital | +0.6% | National; led by developed Eastern provinces | Long term (≥ 4 years) |
| Source: Mordor Intelligence | |||
Expansion of Waste-to-Energy Capacity Backed by Feed-in Tariffs
More than 1,010 incineration plants form almost half of global capacity, yet many run below design load because of uneven feedstock supply. The 2025 reform moves feed-in tariffs toward market-based pricing while integrating green electricity certificates. Facilities achieving 70.9% thermal efficiency show payback periods near 4.8 years, enabling profitability with limited subsidies. Overcapacity is driving Chinese firms to invest in Vietnam and the Gulf states, exporting turnkey plants and O&M expertise.
Urbanization-driven MSW Volume Surge in Tier-2 and Tier-3 Cities
Rapid migration is lifting municipal solid waste output faster than infrastructure can keep pace. The 2024 National Development and Reform Commission report confirms 90% rural collection coverage, yet urbanizing districts still face capacity shortfalls. Demand is rising for scalable, asset-light systems that combine smart bins with modular transfer stations. Central and Southern cities are adopting waste-to-energy as a dual solution for waste and electricity, supported by a national goal of 100% safe disposal in all urban areas by 2030. Technology suppliers benefit from contracts that bundle equipment with digital O&M services, accelerating deployment cycles and reducing upfront capital risks.
Corporate ESG Mandates Driving Industrial Waste Outsourcing
Mandatory sustainability reporting from 2025 increases transparency around hazardous waste handling. Studies link stronger ESG systems with higher ROE and ROA, incentivizing firms to outsource treatment to certified operators. Uncapped punitive damages for environmental infringements further elevate compliance costs, bolstering demand for full-service waste contracts in automotive, electronics, and chemical clusters.
Zero-Waste City Program Scaling Nationwide
The initiative expanded from 11 pilots to 113 municipalities during the 14th Five-Year Plan. Shanghai’s Changning District created “waste-free cells” across public facilities, while Zhanjiang’s 12345 model targets 94% industrial waste utilization by 2025. Standardized metrics, earmarked funding, and performance incentives align local actions with national targets. Community engagement campaigns nurture household participation in sorting, boosting recovery rates and lowering contamination. Replicability across diverse municipal contexts positions the program as a long-term demand anchor for the Chinese waste management market[2].
Restraints Impact Analysis of China Waste Management Market*
| Restraint | (~) % Impact on CAGR Forecast | Geographic Relevance | Impact Timeline |
|---|---|---|---|
| Local-government fiscal constraints limiting PPP payments | -0.4% | Central and Western China; smaller municipalities | Medium term (2-4 years) |
| Community opposition to incinerator siting in dense provinces | -0.3% | Eastern urban centers and tier-1 cities | Short term (≤ 2 years) |
| SME non-compliance with hazardous-waste manifest system | -0.2% | National industrial clusters | Medium term (2-4 years) |
| Fragmented recycling logistics inflating reverse-haul costs | -0.2% | National; greatest in inland provinces | Short term (≤ 2 years) |
| Source: Mordor Intelligence | |||
Local-Government Fiscal Constraints Limiting PPP Payments
Budget pressures restrict the ability of mid-sized cities to guarantee PPP annuities, delaying project execution and raising counterparty risk. Developers respond with asset-light service models and revenue-sharing arrangements that reduce municipal cash outlay yet preserve service standards. Blended-finance vehicles incorporating green bonds and carbon credits are emerging to close funding gaps.
Community Opposition to Incinerator Siting in Dense Provinces
Despite significant emission-control upgrades, public perception hurdles persist in coastal megacities. Concerns over property values and health impacts force extensive outreach, transparent emissions reporting, and provision of community amenities within plant footprints. Design innovations such as enclosed waste pits, odor-control biofilters, and visitor education centers are easing resistance but add to capital costs and permitting timelines[3].
*Our forecasts treat driver/restraint impacts as directional, not additive. The impact forecasts reflect baseline growth, mix effects, and variable interactions.
China Waste Management Market Segment Analysis
By Source:
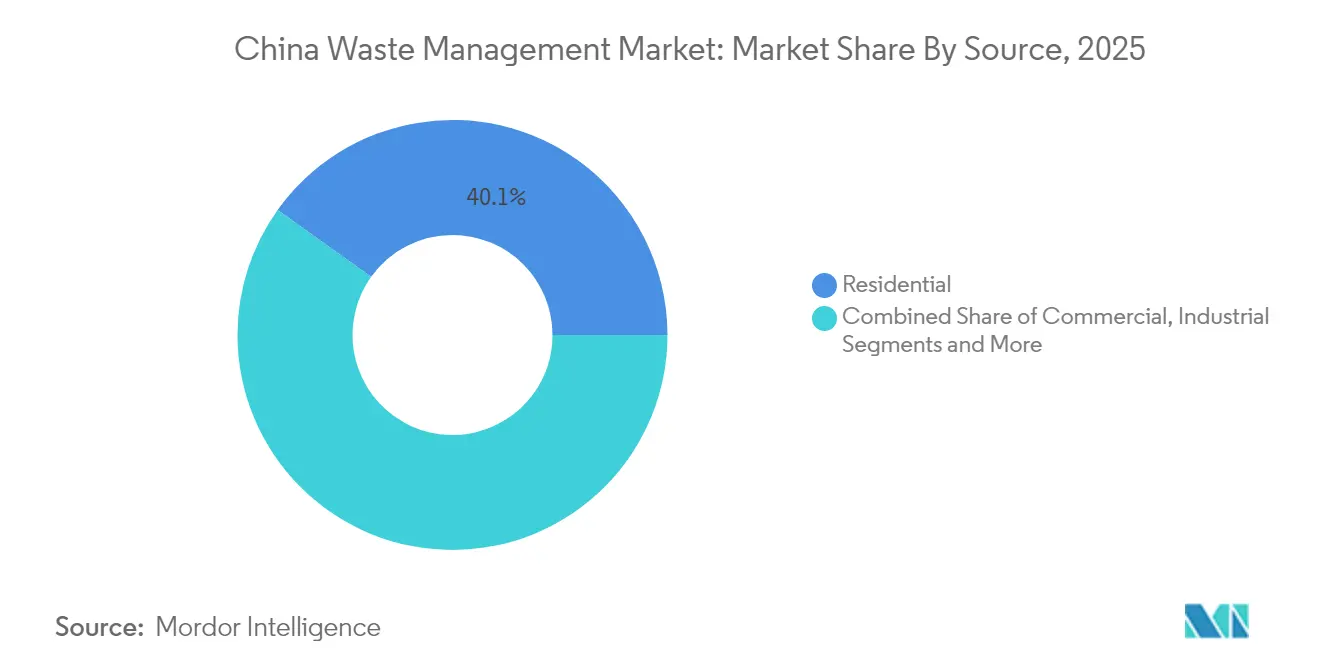
Residential Dominance Drives Infrastructure InvestmentResidential waste contributed 40.12% of the Chinese waste management market in 2025, cementing its role as the backbone for collection network planning. Continuous urban household formation and rising consumer spending push bin-to-truck volumes upward, compelling municipalities to deploy IoT-enabled smart bins that trigger pickups only when 80% full, lifting route efficiency by 30%. Commercial waste, propelled by e-commerce packaging and food delivery trends, is forecast to register an 10.95% CAGR to 2031, the fastest among all sources. Retail fulfillment centers in Guangdong and Jiangsu have already contracted third-party operators for dedicated cardboard baling and plastics shredding, illustrating how service specialization follows waste-stream concentration.
Enhanced residential segregation rules require four-stream sorting that separates recyclables, food, hazardous, and residual waste at the doorstep. This regulatory push spurs demand for color-coded container fleets and AI vision systems that verify sorting accuracy at transfer stations. Urban neighborhood PPPs bundle collection, outreach, and data reporting under single contracts, creating multi-year revenue visibility for private firms. In parallel, industrial clusters outsource hazardous waste management to certified handlers offering cradle-to-grave manifest traceability, expanding service scope beyond household waste.

By Service Type:
Collection Infrastructure Leads Resource Recovery SurgeCollection, transportation, sorting, and segregation accounted for 32.65% of 2025 revenue, reflecting heavy investment in fleet renewal and automated transfer. Smart dispatch platforms now integrate GPS, fill-level telemetry, and traffic analytics, achieving 92% on-time performance and a 30% CO₂ reduction through optimized routing. Recycling and resource recovery is rising at an 10.92% CAGR, the fastest service line, as closed-loop initiatives monetize plastics, metals, and organics. High-density polyethylene pellets recovered from household packaging reach parity with virgin material pricing in Jiangsu, encouraging brand-owner offtake agreements.
Landfill services shift toward engineered cells with geomembrane liners, leachate circulation, and methane capture that feed combined-heat-and-power units. Waste-to-energy incineration remains the growth centerpiece within treatment, supported by grid-price reforms that keep power purchase agreements bankable. Consulting and audit services expand as multinationals seek alignment with local regulations, while digital twins of treatment plants allow predictive maintenance that cuts unplanned downtime by 15%. The Chinese waste management market size for advanced recycling systems is expected to outpace base collection growth as circular-economy legislation tightens.
By Waste Type:
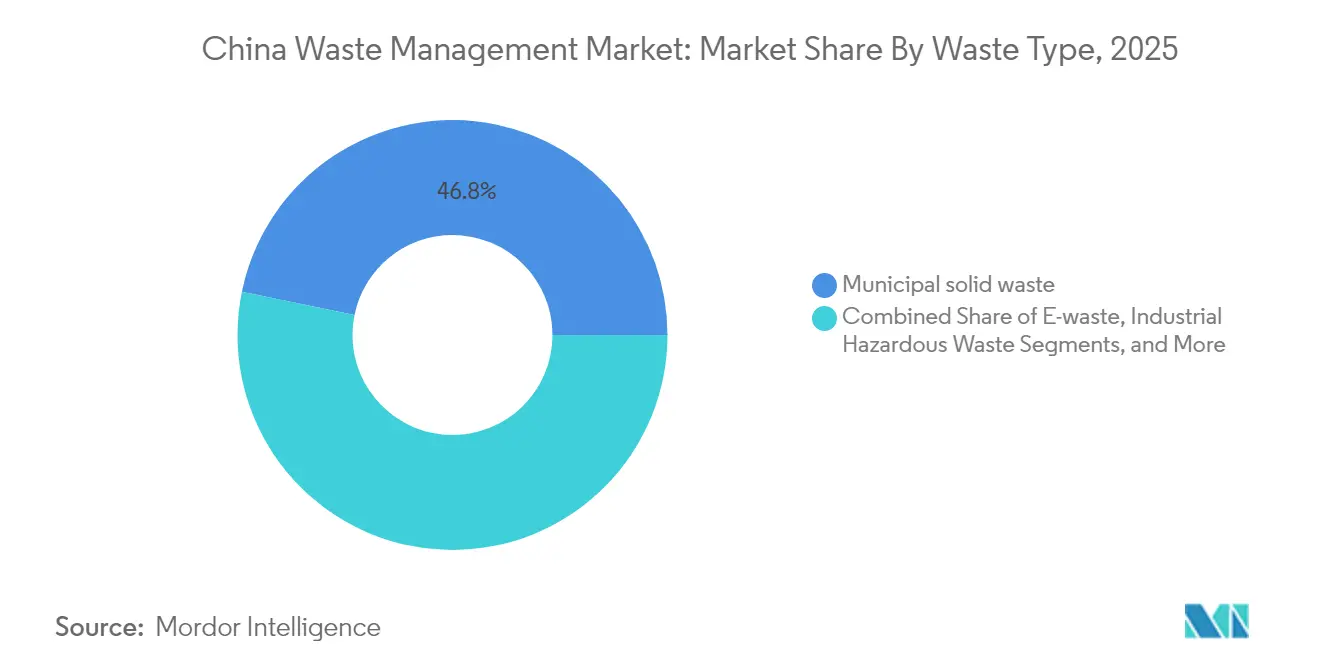
Municipal Solid Waste Scale Contrasts E-waste InnovationMunicipal solid waste retained a 46.78% share in 2025, underlining the scale economies inherent in mixed household refuse streams. Cities are introducing dynamic tipping-fee structures that reward diversion away from landfills, shifting tonnage toward composting and anaerobic digestion. Simultaneously, e-waste is advancing at a 9.96% CAGR, reflecting high smartphone and appliance turnover. Specialized dismantling parks in Guangdong extract precious metals with hydrometallurgical circuits, achieving 95% gold recovery, delivering both environmental and economic gains.
Industrial hazardous waste generators rely on barcode-based manifest systems, ensuring cradle-to-grave auditing and reducing illegal dumping incidents by 18% year-on-year. Biomedical waste volumes grow in tandem with hospital expansions, prompting investment in microwave and plasma sterilization units. Extended producer responsibility rules covering single-use plastics empower regulators to shift disposal costs upstream, encouraging lightweighting and materials substitution. Construction and demolition debris recycling rates rise as recycled aggregates find new applications in road sub-base and low-grade concrete, strengthening circular-economy momentum.
Geography Analysis
Eastern China’s 18.55% share underscores a first-mover advantage built on early investment and regulatory alignment. Dense population centers generate stable feedstock that keeps multi-line incinerators running near nameplate capacity, while land scarcity accelerates pivot toward high-energy-density treatments and vertical composting modules. Jiangsu’s rural classification program illustrates policy trickle-down as village committees reach 35% sorting accuracy, guided by data dashboards that benchmark performance against neighboring districts.
Southern China is the market’s growth engine at a projected 9.12% CAGR to 2031. Manufacturing clusters in Guangdong and Fujian create large, relatively homogeneous waste streams, supporting specialized plastics and metals recovery parks. Proximity to ASEAN markets spurs joint ventures that process cross-border recyclables, turning regional logistics into a strategic asset. Provincial grants for smart-waste pilots enable AI-driven route optimization that reduces per-ton collection cost by 20%, accelerating private-sector participation.
Northern and Central provinces, plus Western and autonomous regions, make up the remainder of the Chinese waste management market. National subsidies and technology transfer narrow service gaps, while mega-projects such as 5,000-t-per-day incinerators in Hebei serve multiple municipalities under regional governance compacts. A nationwide sensor network with more than 330,000 monitoring stations supplies real-time emissions and volume data, allowing regulators to adjust tipping fees and dispatch compliance inspections within 24 hours. The combined effect is a progressively harmonized market in which local variations shape tailored service packages rather than fragmented standards.
Regulatory Landscape
China’s waste-management regulation is tightening and becoming more integrated under national-level frameworks. In January 2026, the State Council released the Action Plan for Comprehensive Treatment of Solid Waste (2026-2030), reinforcing full-chain governance priorities spanning waste reduction, resource utilization, and harmless treatment, alongside stronger policy support for recycling and treatment infrastructure. In March 2026, enactment of the Ecological Environment Code consolidated environmental oversight and supervision responsibilities, strengthening the compliance baseline for municipal, industrial, and hazardous waste handlers.
Enforcement is also moving toward measurable, technology-enabled compliance. The Ministry of Ecology and Environment (MEE) published the List of Hazardous Waste Management Exclusions (2026 Edition), clarifying which wastes fall outside hazardous-waste management requirements and tightening focus on the remaining regulated streams. At the standards level, local emission rules (for example, DB11/503-2026 and DB31/1665-2026) add stricter atmospheric pollutant limits for incineration across municipal, medical, and hazardous waste, increasing demand for ultra-low-emission upgrades, continuous monitoring, and compliant O&M practices.
Value Chain Analysis
China’s waste management value chain spans source segregation and collection, transfer and sorting, treatment and disposal, and downstream resource recovery of plastics, metals, organics, and specialty industrial streams. Municipalities and district sanitation entities anchor upstream volumes, while midstream operators deploy transfer stations and material recovery facilities to reduce contamination and improve feedstock quality for recycling and waste-to-energy (WtE). Downstream, integrated eco-industrial park models combine WtE, recycling, and industrial waste services, with participants ranging from large state-linked contractors to private and international environmental service providers (for example, China Construction Fifth Engineering Bureau, SUS ENVIRONMENT, and SUEZ), alongside an increasing mix of digital tracking and monitoring tools to meet rising compliance requirements.
Key bottlenecks and value pools sit around feedstock quality, traceability, and higher-value industrial circularity. Uneven waste sorting and fragmented reverse logistics raise costs and constrain treatment-facility throughput utilization, pushing operators to invest in smarter transfer and sorting configurations (such as integrated split-and-compress transfer stations) and stricter data reporting. As regulation emphasizes full-chain control and landfill remediation milestones, the chain is shifting from basic disposal toward higher-margin segments, including organic solvent recovery, lithium battery materials recycling, and other industrial resource-regeneration services that can be embedded into park-based offerings and multi-year service contracts.
Competitive Landscape
Market concentration is moderate, with state-linked conglomerates and private specialists sharing territory. Beijing Enterprises Holdings processed 90.2 million tons in 2024 and operates turnkey waste-to-energy plants across Asia, signaling a strategy that monetizes domestic engineering depth in export markets. China Everbright Environment deployed USD 211 million in new projects during 2024, focusing on county-level integrated facilities that combine MSW incineration with leachate treatment to capture multiple revenue streams.
Strategy centers on digitalization, vertical integration, and overseas diversification. Operators embed IoT sensors across fleet and plant assets, feeding AI analytics that cut fuel expenditure by 8% and predict boiler fouling events seven days in advance. Blockchain waste-tracking pilots create immutable records that verify ESG compliance for brand owners, opening new service revenue tied to data provision. Domestic overcapacity drives firms to pursue build-operate-transfer deals in Vietnam, Indonesia, and the Gulf, exporting Chinese standards and equipment under Belt and Road frameworks.
Niche innovators target value pockets such as food-waste biorefineries, lithium-battery recycling, and AI optical-sorting modules capable of distinguishing 22 plastic resins at 2 tons per hour. Partnerships between equipment manufacturers and platform providers bundle machinery sales with software subscriptions, locking in post-installation revenue. As policy tightens around hazardous waste manifests and plastic packaging, incumbents race to secure treatment quotas and recycling licenses, intensifying competition for feedstock contracts in high-growth corridors.
China Waste Management Industry Leaders
-
Veolia Environment SA
-
China Everbright Environment Group Ltd.
-
Suez SA (SUEZ NWS)
-
Beijing Enterprises Environment Group Ltd.
-
Tus-Sound Environmental Resources Co., Ltd.
- *Disclaimer: Major Players sorted in no particular order
China Waste Management Market Companies Covered in this Report
- Veolia Environment SA (Veolia China)
- China Everbright Environment Group Ltd.
- Suez SA (SUEZ NWS)
- Beijing Enterprises Environment Group Ltd.
- Tus-Sound Environmental Resources Co., Ltd.
- Capital Environment Holdings Ltd.
- Canvest Environmental Protection Group Co., Ltd.
- Grandblue Environment Co., Ltd.
- Dynagreen Environmental Protection Group Co., Ltd.
- Shanghai Environment Group Co., Ltd.
- Shenzhen Energy Environmental Co., Ltd.
- China Jinjiang Environment Holding Co., Ltd.
- Weiming Environmental Protection Co., Ltd.
- CITIC Envirotech Ltd.
- Sound Global Ltd.
- Guangxi Bossco Environmental Protection Co., Ltd.
- Hangzhou Jinjiang Group Co., Ltd.
- Anhui Shengyun Environment-Protection Group Co., Ltd.
- C&G Environmental Protection Holdings Ltd.
- Resou Resources Recovery Co., Ltd.
Market Opportunities and Future Outlook
Policy-led scaling of circular economy infrastructure is creating white space in resource recycling, digital supervision, and specialty waste streams. The State Council’s Solid Waste Integrated Management Action Plan (Jan 2026) and the solid-waste pollution prevention and control plan for the 15th Five-Year Plan period (2026-2030) include national targets by 2030, such as annual utilization of 4.5 billion tonnes of bulk solid waste and 510 million tonnes of major recycled renewable resources, which will push localities and enterprises toward higher utilization and compliant treatment capacity. Separately, the 15th Five-Year Plan circular economy strategy set an output-value target of 8 trillion yuan for the resource-recycling industry by 2030, described as a 60% increase from 2025, reinforcing investment and procurement momentum in recycling and recovery services.
Operationally, requirements for integrated digital supervision networks across key solid-waste sectors are widening demand for monitoring, reporting, and traceability solutions, including satellite remote sensing and drone-enabled enforcement tools referenced in policy direction. This supports near-term opportunity for operators and technology providers that can bundle compliant collection and sorting with data services, and for industrial-focused players offering closed-loop solutions (for example, battery materials recycling and solvent recovery) aligned with stricter hazardous-waste governance and park-based industrial upgrading agendas.
Recent Industry Developments in China Waste Management Market
- May 2026: SUEZ signed a strategic investment cooperation agreement with Eagoal New Energy Group to develop a lithium battery materials recycling facility in Changshu, Jiangsu. The move deepens SUEZ’s exposure to high-growth specialty recycling tied to electrification supply chains, expanding beyond municipal waste services into industrial circularity.
- April 2026: SUEZ held a groundbreaking ceremony for an organic solvent recycling project in Chongqing’s Changshou Economic and Technological Development Zone, with Phase 1 capacity stated at 30,000 tonnes per year. This adds dedicated hazardous and industrial waste recovery capability and supports industrial-park customers seeking compliant treatment and higher-value regeneration pathways.
- April 2024: The State Council amended regulations on express delivery to advance biodegradable packaging and establish recycling systems. The change pushes upstream packaging reduction and downstream recycling collection needs, strengthening demand for commercial waste sorting, plastics recovery, and compliance services for logistics and e-commerce supply chains.
China Waste Management Market Report Scope and Research Methodology
Market Definition and Coverage
This market covers paid services used to collect, transport, sort, treat, recover, and dispose of solid waste generated across mainland China, covering municipal, commercial, industrial, healthcare, and construction sources. The market sizing is captured in USD value for the full service chain.
Scope exclusions: excluded items include liquid wastewater services and dedicated mining overburden handling.
Segments Covered in This Report
- By Source
- Residential
- Commercial (Retail, Office, etc.)
- Industrial
- Medical (Health and Pharmaceutical)
- Construction & Demolition
- Others (Institutional, Agricultural, etc.)
- By Service Type
- Collection, Trasportation, Sorting & Seggregation
- Disposal / Treatment
- Landfill
- Recycling & Resource Recovery
- Incineration & Waste-to-Energy
- Others (Chemical Treatment, Composting, etc.)
- Others (Consulting, Audit & Training, etc.)
- By Waste Type
- Municipal Solid Waste
- Industrial Hazardous Waste
- E-waste
- Plastic Waste
- Biomedical Waste
- Construction & Demolition Waste
- Agricultural Waste
- Other Specialized Waste (Radio Active, etc.)
- By Region
- Eastern China
- Northern China
- Central China
- Southern China
- Others
Data Sources, Market Sizing, and Validation
Desk Research
Desk work starts with building the demand and policy context for solid waste volumes and treatment routes in China. We used public sources such as the National Bureau of Statistics of China, the Ministry of Ecology and Environment, the National Health Commission (for medical waste signals), and provincial or municipal statistical bulletins to anchor macro direction.
To convert activity into market value, we also reviewed items such as government tenders and project disclosures, operator annual reports and investor decks, and customs or trade releases where equipment imports help explain capacity additions. Patent databases were used selectively to sanity check adoption direction for sorting, incineration controls, and recycling processes. In a few places, paid subscriptions supporting company financials and shipment-level import and export tracking were used to cross-check scale. This list is illustrative, since many other public sources were also read for validation and clarification.
Primary Interviews and Surveys
Primary work was used to test pricing logic, utilization, and how quickly capacity gets ramped after new plants or transfer stations start operating. We spoke with a mix of service operators, equipment and EPC participants, municipal stakeholders, and large waste generators to clarify what is charged as a service fee versus what is treated as a separate commodity sale.
Because conditions vary by province, feedback was balanced across coastal and inland demand centers, then rechecked where a datapoint looked inconsistent with observed policy statements or project pipeline signals.
Distribution of primary research fieldwork respondents
| Company type | Respondent position |
|---|---|
| Top tier: 27% | CXOs: 17% |
| Mid tier: 53% | Functional/Unit leaders: 32% |
| Smaller Players: 20% | Managers: 51% |
Market-Sizing & Forecasting
Sizing starts with a top-down build where official waste generation series and treatment shares are used to reconstruct the serviceable waste flow, which is then converted into value using typical fee ranges by service step and treatment route. We then corroborate totals using selective bottom-up checks, including sampled operator revenue splits, discussions on gate fees at channel level, and simple volume times ASP approximations for major routes such as landfill, incineration, and recycling.
Key inputs in this market include municipal solid waste volumes, industrial and hazardous waste handling intensity, construction and demolition activity signals, treatment capacity additions and utilization rates, and observed gate fee movements by province. When an input is missing for a local pocket, we fill gaps using proxy indicators such as nearby city benchmarks, permitted capacity, and urban population change, then adjust the local view after interviews.
Forecasting relies on scenario analysis anchored on policy enforcement strength and the speed of new capacity ramp-up. The scenarios are stress-tested with expert expectations on recycling rates, waste-to-energy utilization, and landfill diversion trends. Finally, the outputs are reviewed against short-cycle signals such as tender pipelines and plant commissioning timelines so the curve stays realistic.
Data Validation & Update Cycle
Numbers are checked through multiple passes so the model does not drift from real-world operating signals. We compare outputs with independent indicators such as reported waste volumes, visible capacity pipeline, and utilization narratives from operators, then investigate outliers before final sign-off.
If interview feedback or new public releases show a meaningful shift, the assumptions are reopened and contacts are revisited to confirm what changed and when it started. Reports are refreshed annually, with interim updates when material policy changes, large project awards, or major disruptions are observed. Before delivery, the full model is re-run with a last validation pass so clients receive the most current view.
Mordor Intelligence's China Waste Management Market Estimate Compared With Other Published Estimates
Published numbers for China waste management can look far apart even when they use the same country name, because the included services and the year basis are not consistent. Differences also come from how each study treats landfill versus waste-to-energy revenues, and whether constant or current USD is used in the conversion.
Liquid wastewater services are kept outside Mordor Intelligence's scope for this market, and that single exclusion alone can move totals when other estimates blend solid waste and wastewater under one umbrella. Another common gap is timing. Some sources use 2024 as the anchor year and then apply a forward CAGR without rechecking province-level gate fee movements or utilization, which can overstate near-term value when new capacity is still ramping.
Benchmark comparison
| Source | Market Size | Gaps in Research Methodology |
|---|---|---|
| Mordor Intelligence | USD 177 B (2025) | |
| Regional Consultancy A | USD 77.43 B (2024) | Uses an earlier anchor year and a narrower value pool in practice, where parts of the full service chain can be undercounted when fees, recovery revenues, and multi-step handling are not consistently added together across provinces. |
| Industry Publisher B | USD 77.49 B (2024) | Often applies a broad CAGR path from a 2024 base with limited visibility on utilization ramp-up and local gate fee dispersion, which can keep the starting value low and shift more value into later years. |
The spread in the table is mainly explained by what gets counted in the service chain and which year is treated as the starting point. With clear inclusions and exclusions, a transparent unit-to-value conversion, and repeated checks with operating signals, the final number stays traceable to practical drivers that can be revisited and updated.
Key Questions Answered in the Report
What is the current size of the Chinese waste management market?
The market stands at USD 187.05 billion in 2026 and is forecast to reach USD 246.56 billion by 2031.
Which waste source generates the largest revenue?
Residential waste leads with 40.12% market share in 2025, reflecting dense urban household generation.
Where is the fastest regional growth expected?
Southern China is projected to grow at a 9.12% CAGR from 2026 to 2031, driven by manufacturing expansion and urbanization.
What service segment shows the highest growth potential?
Recycling and resource recovery is set to expand at an 10.92% CAGR, outpacing traditional collection services.
How are policy changes influencing waste-to-energy projects?
Market-oriented feed-in tariff reforms combined with green electricity certificates keep waste-to-energy plants financially viable while reducing subsidy dependence.
Why are companies outsourcing industrial waste management?
Mandatory ESG disclosures and stricter penalties for non-compliance make professional outsourcing a cost-effective way to meet regulatory and stakeholder expectations.