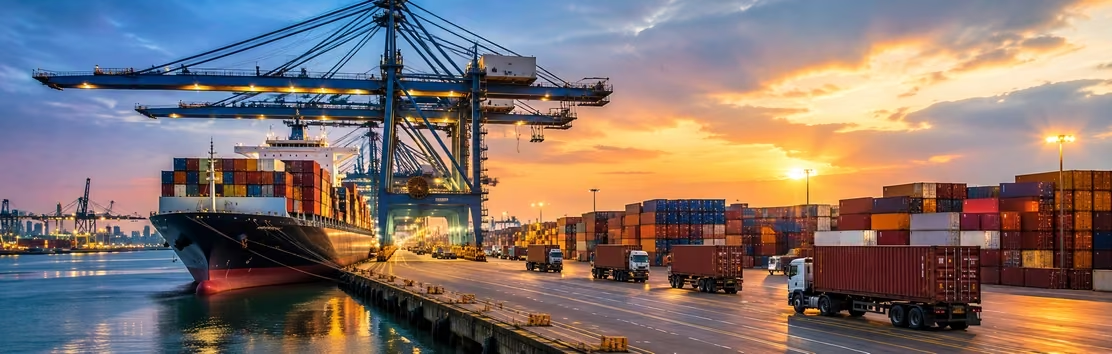
A structural rupture in global energy geography and the realignment it has set in motion. The Strait of Hormuz was the world's most reliable shipping lane for half a century. In 2026, that reliability didn't break once. It broke three times.
Executive Summary
Mordor Intelligence's read, from tracking energy contracts, infrastructure, and capital flows across 90-plus markets: the 2026 Hormuz crisis is not a supply shock the market waits out. It is an origin shock that permanently moves where the world's gas comes from, and the repricing has only partly happened. Qatar's Ras Laffan complex is offline for 3–5 years, stranding 12.8 MTPA; the June 17 MoU briefly lifted transits from a wartime low of 4 a day to a peak near 40 before reversing; Iran resumed attacks in early July, the US reimposed a naval blockade on July 14, and daily transits fell to 9 by July 15, below even the initial closure's trajectory. Whichever way the current escalation resolves, the structural realignment already in motion does not reverse: the US is now the world's swing LNG supplier, FLNG and nuclear have moved from optional to necessary, and every energy-infrastructure valuation built on stable Hormuz assumptions is wrong.
What this brief adds to that consensus is Mordor Intelligence's analytical layer, built on licensed contract data (Cedigaz LNG Supply Contracts Database) and Mordor Intelligence's own tracking: contract-exposure mapping, replacement-capacity and capital-flow tracking, and a cross-desk read across the five verticals this shock actually touches, not one.
| Data | Figure |
|---|---|
| Total Qatari LNG under an active long-term contract | 105.88 MTPA across 49 contracts |
| Volume held by portfolio buyers with trading flexibility | 16.55 MTPA (Shell, TotalEnergies, KOGAS, Eni, others) |
| Volume held by non-portfolio, destination-fixed buyers | 89.33 MTPA |
| Contracts with explicit destination-flexibility clauses | 6.2 MTPA (5.9% of total) |
| Share of 2025 deliveries on fixed DES terms | 87% (70.7 Mt of 81.2 Mt delivered) |
| Buyers with no realistic substitute within 24 months | Pakistan (6.8), Bangladesh (6.8), Kuwait (7.0), Taiwan (9.8) MTPA = ~30 MTPA |
| Replacement spot price for stranded buyers | 2–3× contracted price |
The structural vulnerability of Hormuz was exposed, and it was baked into the contract book years before the first missile landed. In LNG, security of supply is no longer just about having contracts; it's about having optionality when geopolitics disrupts the market.
The Strategic Picture: Six Propositions on the Hormuz Crisis
The disruption is structural, and it is not over. These are our calls, not a recap of the news.
- The disruption is structural, and the recovery was never real. Transits rebuilt only to approximately 40 per day, roughly one-third of the 147-vessel pre-war baseline, before collapsing again to 9 per day by July 15, 2026. How energy origin risk is priced will never be the same.
- Qatar's 12.8 MTPA gap does not close before 2029. Equipment procurement lead times for replacement gas turbines alone run two to four years. New liquefaction cannot fill the gap in any commercially relevant planning horizon through 2028.
- The US is the swing supplier, but capacity-constrained until 2029. US LNG exports reached an all-time high of 18.5 Bcf/d in March 2026 and averaged 17.9 Bcf/d in April at approximately 94% terminal utilization. Major new capacity additions ramp only through 2029.
- Gas, not oil, is the binding vulnerability for Japan, South Korea, and Taiwan. Oil can be stockpiled; LNG cannot. Neither Japan (250-day oil reserve) nor Taiwan (140-day oil reserve) has meaningful specialist LNG storage.
- FLNG, nuclear, and overland pipelines are now primary strategic responses, not the fallbacks they were before 2026. Capital allocation has shifted accordingly. FLNG sanctioning has accelerated: Delfin FLNG 1, the largest FLNG project globally at 4.4 MTPA, took a USD 5 billion FID in June 2026, following Coral North's FID in October 2025.
- Every LNG, pipeline, and regas model built on stable Hormuz assumptions is wrong, proven twice. Valuations now need a chokepoint-risk premium that standard DCF frameworks never carried.
Two anchors are public; the two right-hand cells above are Mordor Intelligence's own tracking. Ship transits fell from 147/day pre-war to 4/day at the initial closure, rebuilt to a peak of ~40/day (averaging ~28) under the June 17 MoU, and fell to 9/day by July 15 as the recovery reversed.
The Energy Shock: A Passage That Stopped Being Reliable
Start with the distinction that drives every decision in this brief, and that most coverage still gets wrong. A supply shock is a volume problem: temporary, fungible, and correctable once other producers raise output. An origin shock changes the source of energy for years and forces the rebuilding of contracts, routes, and infrastructure that took decades to assemble. Unlike crude, LNG is infrastructure-specific; it cannot simply be rerouted. Read through the origin-shock lens, not the supply-shock one; the crisis points to different decisions, and that is the lens Mordor Intelligence applies to the evidence that follows.
The backdrop: a 33-km passage carried roughly 20 million barrels of oil a day in 2025, close to a quarter of seaborne oil trade, plus about a fifth of traded LNG, almost all of it Qatari. Iranian strikes on March 18–19 damaged two of Qatar's 14 LNG trains and a GTL facility at Ras Laffan, 12.8 MTPA offline, ~USD 20 billion a year in lost revenue, a 3–5 year restoration. Crude rose 27% and LNG 74% in the fortnight that followed.
“The issue is no longer production capacity. The issue is confidence in uninterrupted delivery. Buyers are asking for origin diversification and route resilience in every new discussion.”
What Prices Are Already Telling Us
The price signal is not "gas got expensive." It is that the constraint has moved from production to logistics, and that is where the next five years of energy capital will be decided. Henry Hub, the US domestic price, fell 9% after the initial closure because America had ample gas and could not export it fast enough. Asia and Europe paid 35–51% more for the same molecule in the same window. That gap, between what the US can produce and what it can ship, is simultaneously the commercial opportunity and the bottleneck.
| Metric | Pre-War | During War | Present (15-Jul-26) |
|---|---|---|---|
| Brent crude | ~USD 72/bbl | ~USD 85–100/bbl peak-risk | Mid-USD 80s/bbl |
| TTF (European gas) | ~EUR 33–35/MWh | ~EUR 50–55/MWh | ~EUR 53–55/MWh |
| JKM (Asian spot LNG) | USD 8–10/MMBtu | ~USD 16.5–18.9/MMBtu | USD 16.7–17.8/MMBtu |
| Henry Hub (US gas) | USD 2–2.5/MMBtu | ~USD 2.9–3.3/MMBtu | ~USD 2.9/MMBtu |
The signal is consistent across all four benchmarks: the constraint is not the US gas supply. It is the ability to move molecules into global LNG markets fast enough and reliably enough to satisfy a structurally undersupplied world.
Mordor Intelligence's Global LNG Report puts the segment at 553 MTPA in 2026, growing to 822 MTPA by 2031 at an 8.25% CAGR, a projection that was bullish before Ras Laffan and looks conservative now.
Why the Replacement Timeline Is Structural, Not Cyclical
Qatar produced 77–80 MTPA in 2025, about a fifth of globally traded volumes, with plans to reach 142 MTPA by 2030 before the strikes. The instinct to find a fast replacement is understandable and wrong for any timeline that matters through 2029. The IEA confirmed the closure cut Qatari and UAE LNG by more than 300 million m³/day since March 1, over 2 billion m³ a week, with nearly 90% of that gas bound for Asia.
New liquefaction could theoretically close the gap, but the US and Qatar together account for 70% of the ~300 bcm/year of new capacity the IEA expects by 2030. With Qatar's share stranded, US total nameplate capacity is on track for approximately 28.7 Bcf/d in DOE-approved export authority by 2029, but the physical ramp of projects under construction (Golden Pass Trains 2–3, Port Arthur, Rio Grande) occurs gradually and sequentially through that window.
| Project | Location | Capacity | First production |
|---|---|---|---|
| Golden Pass LNG | Sabine Pass, Texas | 15.6 MTPA authorized (~18 MTPA expandable) | Start-up 2026; phased ramp 2026–2027 |
| Port Arthur LNG Phase 1 | Port Arthur, Texas | ~13 MTPA | Train 1 2027; Train 2 2028 |
| Rio Grande LNG | Brownsville, Texas | 17.6 MTPA Phase 1 (~48 MTPA under construction/development) | First LNG 2027; later trains through 2030 |
Built on the Cedigaz LNG Supply Contracts Database together with Mordor Intelligence's own contract tracking, this view maps long-term LNG supply agreements by origin geography, transit chokepoint exposure, and tenor. It shows which buyer portfolios carry more than 30% direct Qatar exposure, which substitute contracts have been activated, and at what spot premium. This mapping is available to subscribers of the Global LNG Report and on request from the Strategic Intelligence Division.
The Energy Transition in Reverse
High LNG prices are pushing Asia back to coal. Australian thermal coal is up roughly 20% as buyers fuel-switch, and Wood Mackenzie projects Northeast Asian LNG demand falling 4–5 Mt through Q3 2026. A decade of transition progress in Bangladesh, Pakistan, and Southeast Asia is unwinding, not from policy failure, but because the molecules aren't available at a price these economies can absorb.
The New Geography of Advantage
Mordor Intelligence's winners-and-losers call: the US Gulf Coast and the Australian Pilbara/Darwin operators capture the repricing; Japan, South Korea, and Taiwan carry the most serious exposure. US Gulf Coast liquefaction is running at 94% of maximum DOE-approved export levels; 2025 was a record US FID year (over 83 bcm/yr sanctioned, more than 90% of global FIDs), and CP2 Phase 2 and Commonwealth LNG both reached FID in 2026. Total US capacity is on track for 28.7 Bcf/d by 2029. The US is now the swing supplier, extraordinary pricing leverage that will persist. Australia's operators are seeing a once-in-a-generation repricing of contracted volumes; buyers who spent years squeezing Qatar on price are calling Woodside and Santos back.
On the exposed side: Qatar supplies 15–35% of gas in Japan, South Korea, and Singapore, with South Asian economies relying on it for 45–99% of LNG imports. Oil can be stockpiled; LNG cannot, and neither Japan nor Taiwan has anywhere near sufficient specialist storage. Their 250- and 140-day oil reserves offer false comfort when it is gas that is running short. The contractual fallout keeps spreading: QatarEnergy declared force majeure on contracts with South Korea, China, Italy, and Belgium on March 24, with Shell, TotalEnergies, and Edison following downstream. The July escalation raises a harder question than force majeure alone: a naval blockade is a different legal category from a war-risk claim, and it hits contracts that assumed a return to normal transit by now.
“The mistake is treating this as a supply shock you wait out. It is an origin shock: the source of the molecule has moved, and the contracts, routes, and infrastructure built around the old source have to move with it. The organizations that price chokepoint concentration once, as a standing balance-sheet risk across every Gulf-linked input, will spend the next decade acting while everyone else keeps rediscovering the same exposure one vertical at a time.”
Capital Reallocation: Four Infrastructure Redirections
Where the capital is actually moving, read against Mordor Intelligence's infrastructure forecasts.
FLNG moves from concept to necessity
Building liquefaction on a ship rather than in a remote country was always the clever option and is now the urgent one. Coral North reached FID in October 2025 and Delfin FLNG 1 followed in June 2026; Mordor Intelligence's Floating LNG Report values the market at USD 25.57 billion in 2025, growing to USD 44.72 billion by 2031 at a 9.66% CAGR. Mozambique, Argentina, and Canada's Cedar LNG are the new strategic assets.
| Project | Location | Capacity | First production |
|---|---|---|---|
| Delfin FLNG 1 | Offshore Louisiana, US | 4.4 MTPA | Targeted 2030; USD 5B, first US-based FLNG |
| Delfin FLNG 2 | Offshore Louisiana, US | 4.4 MTPA | Advancing toward FID by end-2026 |
| Coral North FLNG | Rovuma Basin, Mozambique | 3.6 MTPA | Target output by 2028 |
| Nigeria UTM FLNG | Offshore Akwa Ibom, Nigeria | 2.8 MTPA | Production expected 2029–2030 |
Oil and Gas Pipelines: Repriced for Geopolitical Risk
Energy-infrastructure risk is being repriced from regulatory to geopolitical. The core insight is structural: a pipeline cannot be blockaded at sea. Mordor Intelligence's Oil & Gas Pipeline Report puts the segment at USD 108 billion in 2026, reaching USD 138 billion by 2031 at a 4.92% CAGR.
Pipeline Services: Structural Renaissance
Mordor Intelligence's Pipeline Services Report estimates the segment at USD 45 billion in 2025, growing to USD 64 billion by 2031 at a 6.33% CAGR.
Nuclear becomes an energy-security argument, not just a climate one
Capacity is forecast to grow from 400 GW in 2025 to 425 GW by 2031. South Korea confirmed two new reactors in January 2026, and the US–Korea–Japan SMR agreement is now treated as an energy-security emergency. The argument is simple: uranium doesn't transit the Strait of Hormuz.
The Strategic Rehabilitation of Overland Infrastructure
The dominant narrative is that this disruption accelerates the LNG buildout. True, but incomplete: it has also restored the strategic logic of pipelines, the technology LNG was supposed to make obsolete. Pipelines can't be blockaded at sea. The Central Asia–China Gas Pipeline already moves 55 bcm a year overland from Turkmenistan, Uzbekistan, and Kazakhstan, not a kilometer of it over water. Kazakhstan is evaluating Trans-Caspian expansions, and Russia's Lavrov personally offered Xi compensation for any shortfall. Moscow had a contingency plan; most of the market didn't. Mordor Intelligence estimates the Pipeline Services segment will grow from USD 45 billion in 2025 to USD 64 billion by 2031 at a 6.33% CAGR. Political vulnerability to a known counterparty is now preferable to kinetic vulnerability at an anonymous chokepoint, a permanent shift in the risk calculus.
Mapping Chokepoint Exposure in an LNG Contract Portfolio
A large gas-importing utility carried a portfolio of long-term LNG supply agreements that it had always managed by price and counterparty. When Ras Laffan went offline and force majeure notices began arriving, the procurement team could not answer a board-level question quickly: how much of our contracted supply physically depends on the Strait of Hormuz, and where are the alternatives?
Mapped every long-term agreement by source geography, transit chokepoint, and force-majeure trigger, then stress-tested the portfolio against a sustained-closure scenario using the same origin-shock lens set out in this brief. The analysis separated volumes that could be re-sourced from US or Atlantic-basin cargoes from those structurally locked to Gulf origin, and modeled the cost and lead time of each substitution.
A chokepoint-risk register the board could act on, a ranked view of which contracts carried unhedged Hormuz exposure, which alternative supply pathways were realistic within one and three years, and where a floating-regas or diversified-origin commitment would most reduce structural risk per dollar.
Chokepoint exposure does not appear on a supply contract. Pricing it requires mapping physical origin and transit route behind every agreement, the difference between repricing an asset deliberately and discovering the risk through the next force-majeure notice.
One Shock, Five Verticals: Why This Isn't Just an Energy Story
This is the analysis a single-sector desk cannot write, and it is Mordor Intelligence's strongest claim to a view no competitor can match. The same origin shock is propagating through five verticals at once. Gulf gas isn't just LNG feedstock; it's the primary input for nitrogen fertilizer. Roughly a third of the global seaborne fertilizer trade and about half of globally traded sulfur originate from the same region. This brief covers the energy side, now driving a projected 60% rise in urea prices and an FAO food-security warning covering up to 45 million additional people. That isn't a coincidence next to this story; it's the same shock, one sector over.
The practical implication: an organization that reprices its LNG contracts and pipeline assets for chokepoint risk but leaves its agricultural inputs, chemicals, or shipping insurance on the old assumption has done only half the work. The origin shock doesn't respect sector boundaries, and neither should the response.
Our View
This is a chokepoint-concentration story before it is an energy story or a fertilizer story. The organizations treating it as sector-specific will keep discovering new exposure, one vertical at a time, for years. The ones treating chokepoint concentration as the standing risk, across energy, fertilizer, shipping, and insurance, will price it once and move on.
Five Decisions Whose Deferral Carries Compounding Strategic Cost
- 1Start with your contracts; treat this as a balance-sheet event, not a procurement problem.Map every long-term energy agreement by source geography and transit chokepoint, the exact method in the case study above. QatarEnergy's force majeure already covers South Korea, China, Italy, and Belgium, and the July blockade adds a harder legal question on top of it. Our Global LNG Report breaks contracted volumes down by origin, buyer country, and tenor.
- 2Reprice every energy-infrastructure asset you own or are evaluating.DCF models built on stable Hormuz have been wrong twice in five months. QatarEnergy losing USD 20 billion a year in revenue is what chokepoint risk looks like as a line item, not a footnote. Our LNG Infrastructure Report tracks the segment with scenario analysis on transit-infrastructure disruption.
- 3Make the FLNG decision now, not after the next ceasefire.Floating LNG deploys in 3–4 years, roughly half a land terminal's lead time. Our Floating LNG Report tracks the pipeline from Mozambique to Cedar LNG, the assets most likely to fill the 2029–2031 gap. Waiting for consensus means waiting for capacity that's already spoken for.
- 4Take nuclear seriously as a commercial decision, not a political one.Capacity grows from 400 GW (2025) to 425 GW (2031). The case isn't carbon; it's the one large-scale power source whose fuel supply is immune to origin shock. Our Nuclear Power Report covers the pipeline by country and reactor type.
- 5Don't underestimate the pipeline opportunity, or the cross-sector exposure next to it.Overland gas infrastructure is in a structural renaissance most Western allocators haven't priced. The Pipeline Services segment grows from USD 45 billion (2025) to USD 64 billion (2031). If your organization also touches agricultural inputs, chemicals, or Gulf-linked shipping, read this alongside our fertilizer coverage of the same chokepoint.
The Next Layer of Intelligence
Most energy procurement strategies and infrastructure valuations were built on a Strait of Hormuz that functioned. That assumption broke in March 2026, broke again in July, and the organizations still running on it are carrying risks they haven't measured. Mordor Intelligence's Value Chain & Supply Chain Analysis practice maps supply-origin exposure, contract vulnerability, and infrastructure access at the facility level. For teams repricing assets or evaluating capital commitments, our Commercial Pre-Feasibility Studies stress-test viability across market size, competitive dynamics, and geopolitical-risk scenarios before capital is deployed.